
Key Insights
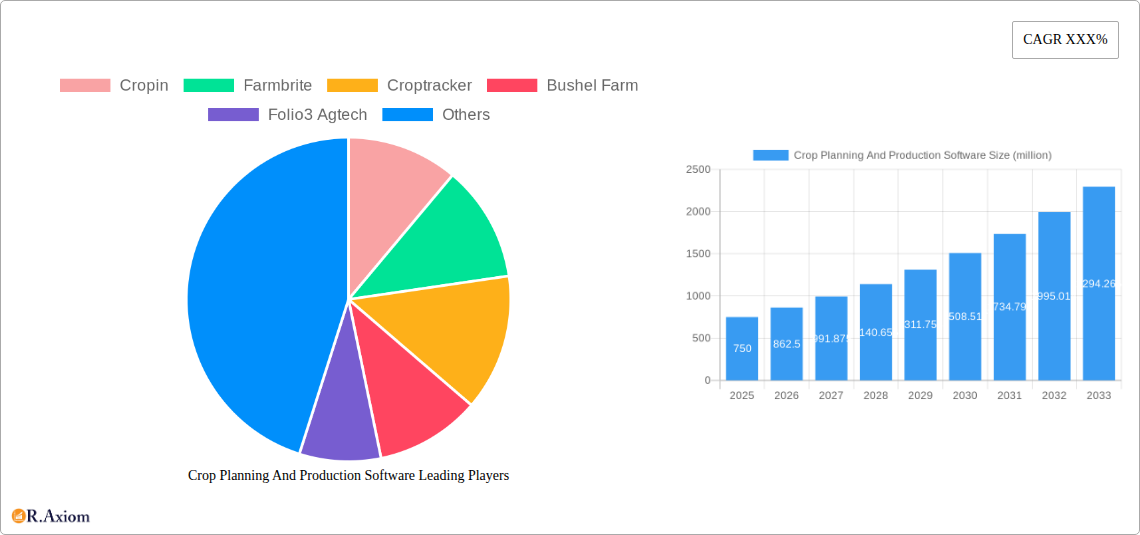
The global Crop Planning and Production Software market is poised for significant expansion, with an estimated market size of approximately $750 million in 2025. This growth is fueled by an increasing adoption rate of precision agriculture technologies, driven by the escalating need for enhanced crop yields, optimized resource utilization, and sustainable farming practices. Key market drivers include the rising global population and the subsequent demand for food security, coupled with the growing awareness among farmers regarding the benefits of digital farming solutions. Furthermore, government initiatives promoting agricultural modernization and the increasing availability of cloud-based platforms are further accelerating market penetration. The software offers critical functionalities such as crop health monitoring, yield prediction, pest and disease management, and resource allocation, directly contributing to improved farm profitability and operational efficiency.
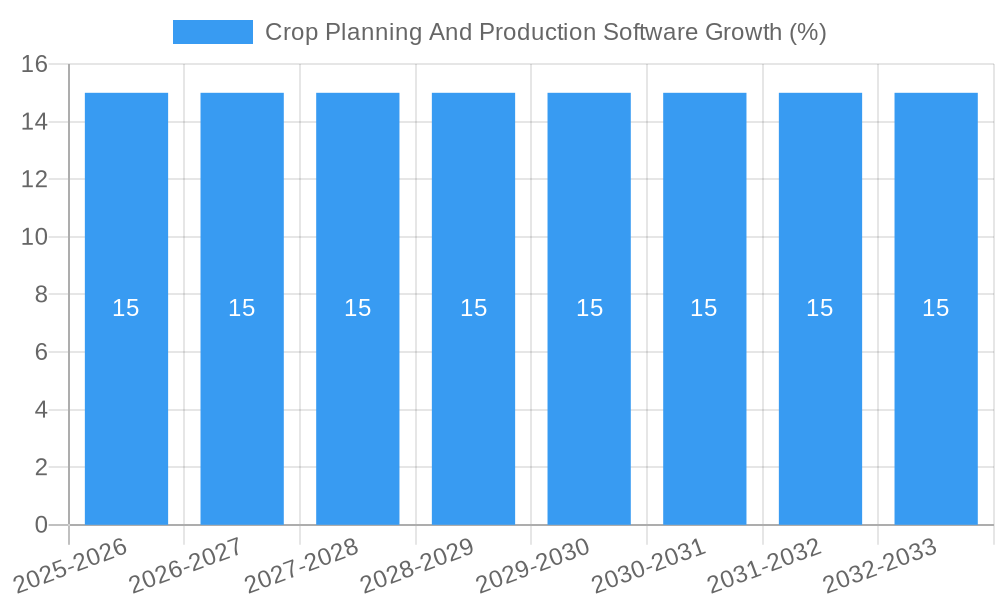
The market is projected to witness a robust Compound Annual Growth Rate (CAGR) of around 15% from 2025 to 2033, indicating substantial long-term growth potential. This expansion will be driven by advancements in AI and machine learning integration, enabling more sophisticated data analysis and predictive capabilities within the software. The market is segmented by application into Agricultural Enterprises, Individual Farmers, and Others, with Agricultural Enterprises expected to dominate due to their larger operational scales and greater investment capacity in technology. By type, Cloud-Based solutions are anticipated to outpace On-Premises offerings, owing to their flexibility, scalability, and accessibility. Geographically, Asia Pacific, particularly China and India, is expected to emerge as a high-growth region, driven by the large agrarian base and supportive government policies. However, the market may face restraints such as the initial cost of implementation, the need for digital literacy among farmers, and concerns regarding data security and privacy.
Crop Planning And Production Software Market Concentration & Innovation
The global Crop Planning and Production Software market exhibits moderate concentration, with leading players like Cropin, Farmbrite, Croptracker, Bushel Farm, Folio3 Agtech, AgriERP, Conservis, Field Margin, Topcon, FarmERP, MyCrops, Agworld, NAVFarm, KhetiBuddy, and AGRIVI vying for market share. Innovation is a critical differentiator, driven by advancements in AI, IoT, big data analytics, and precision agriculture technologies. These innovations aim to enhance crop yield prediction, optimize resource allocation, automate farm management tasks, and improve overall farm profitability. Regulatory frameworks, while generally supportive of agricultural technology adoption, can vary by region, influencing the pace of innovation and market entry for new solutions. Product substitutes, such as traditional farm management practices, manual record-keeping, and generalized business software, pose a competitive challenge, though they often lack the specialized functionality and data-driven insights offered by dedicated crop planning software. End-user trends are increasingly leaning towards integrated solutions that offer comprehensive farm management capabilities, from seed selection to harvest and sales. Mergers and acquisitions (M&A) are also a notable feature of the market landscape, with deal values often in the tens of millions of dollars, as larger companies seek to expand their product portfolios and market reach. For instance, strategic acquisitions aimed at integrating complementary technologies or expanding into new geographical markets are common.
Crop Planning And Production Software Industry Trends & Insights
The Crop Planning and Production Software market is poised for substantial growth, driven by a confluence of factors. The escalating global population, projected to reach over 9 million by 2050, necessitates a significant increase in food production, making efficient and data-driven farming practices indispensable. This demand fuels the adoption of crop planning software as farmers seek to optimize yields and minimize losses. Technological disruptions are at the forefront of this evolution. The proliferation of IoT sensors, drone technology, and satellite imagery provides unprecedented real-time data on soil conditions, weather patterns, crop health, and pest infestations. Advanced analytics and artificial intelligence (AI) then process this data to offer actionable insights for optimizing planting schedules, irrigation, fertilization, and pest control strategies. The market penetration of these sophisticated software solutions is steadily increasing, moving beyond large agricultural enterprises to smaller individual farmers as costs decrease and user-friendliness improves. Consumer preferences for sustainably sourced and traceable food products also play a crucial role. Crop planning software enables farmers to meticulously track their production processes, providing the transparency consumers increasingly demand. Furthermore, government initiatives and subsidies aimed at promoting agricultural modernization and digital transformation are creating a favorable environment for market expansion. Competitive dynamics are characterized by intense innovation and a focus on delivering comprehensive, user-friendly, and cost-effective solutions. The average annual growth rate (CAGR) is projected to be in the range of 15-20% over the forecast period. Key market drivers include the need for increased food security, the adoption of precision agriculture techniques, and the growing awareness of the benefits of data-driven farm management. The ability of software to provide predictive analytics for yield forecasting and risk management is a significant draw for stakeholders.
Dominant Markets & Segments in Crop Planning And Production Software
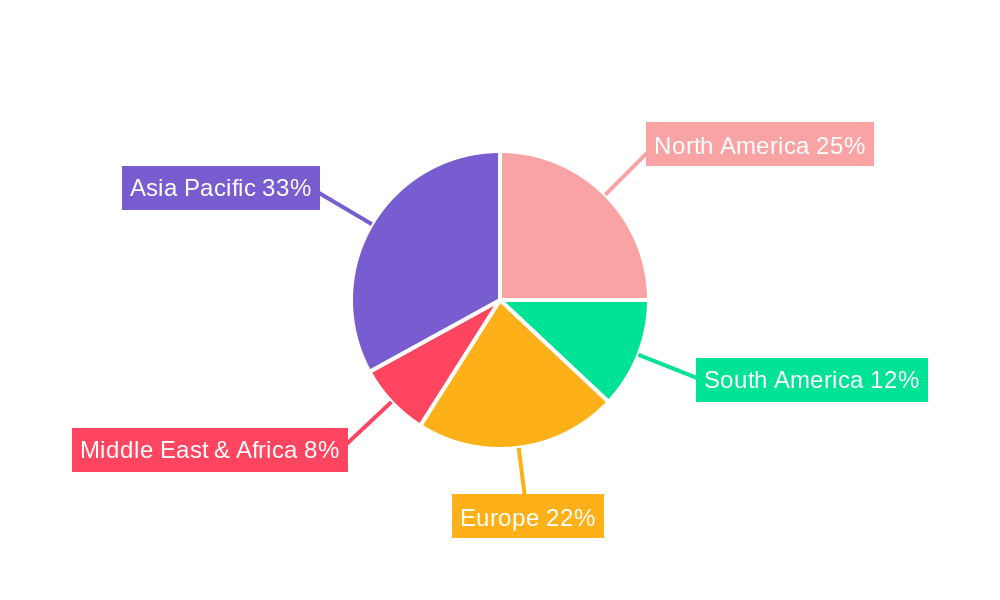
The Crop Planning and Production Software market is experiencing significant dominance by Cloud-Based solutions across various geographical regions and applications. This preference is largely attributed to the inherent scalability, accessibility, and cost-effectiveness of cloud platforms, which eliminate the need for substantial upfront infrastructure investment for farmers. Regions with strong agricultural sectors and a high adoption rate of digital technologies, such as North America, Europe, and parts of Asia-Pacific, are leading the market.
- Leading Region: North America, driven by its advanced agricultural practices, significant investment in agritech, and supportive government policies, currently holds the largest market share. The region's focus on large-scale commercial farming enterprises necessitates sophisticated software for optimizing complex operations and maximizing profitability. Economic policies promoting technological adoption and robust infrastructure for internet connectivity further solidify its dominance.
- Leading Country: The United States, within North America, stands out due to its large agricultural output and early adoption of precision farming techniques. The country's proactive approach to agricultural innovation and the presence of numerous agritech companies contribute to its leading position.
- Dominant Application Segment: Agricultural Enterprises represent the largest application segment. These large-scale operations have the financial capacity and operational complexity to benefit most significantly from the comprehensive features offered by crop planning and production software, including advanced analytics, resource management, and compliance reporting. The ability to manage vast acreages and diverse crop types efficiently drives their adoption.
- Dominant Type Segment: Cloud-Based solutions are the undisputed leaders in the type segment. The accessibility from any internet-connected device, automatic updates, and reduced IT overhead make cloud solutions highly attractive to both large enterprises and increasingly, individual farmers. The subscription-based models also offer predictable costs.
- Individual Farmers: While currently a smaller segment compared to agricultural enterprises, the adoption rate among individual farmers is rapidly accelerating. This growth is fueled by the decreasing cost of technology, the availability of more user-friendly interfaces, and a growing understanding of the tangible benefits in terms of yield improvement and cost reduction. Government initiatives and cooperative efforts are also playing a role in bringing these solutions to smaller farms.
- Others: This segment, encompassing research institutions, agricultural consultants, and government agricultural departments, also utilizes crop planning and production software for data analysis, trend identification, and policy formulation. Their adoption, while smaller in volume, contributes significantly to market insights and the overall ecosystem.
Crop Planning And Production Software Product Developments
Recent product developments in Crop Planning and Production Software are centered on enhancing predictive analytics, automating farm operations, and integrating with a wider ecosystem of agritech devices. Innovations include AI-powered yield forecasting models that leverage historical data, weather patterns, and satellite imagery to provide highly accurate predictions. Enhanced capabilities for precision irrigation and fertilization, tailored to specific field zones, are also prominent. Competitive advantages are being built around user-friendly interfaces, mobile accessibility, and robust data security. The focus remains on delivering tangible ROI for farmers by optimizing resource utilization and minimizing risks associated with crop production.
Report Scope & Segmentation Analysis
This report meticulously analyzes the Crop Planning and Production Software market across key segments. The Application segmentation includes Agricultural Enterprises, characterized by large-scale operations seeking comprehensive farm management solutions and projected to hold a market size of over $500 million by 2025, with a CAGR of approximately 18%. Individual Farmers, representing a rapidly growing segment with a projected market size exceeding $300 million by 2025, are adopting these solutions for improved efficiency and profitability, showing a CAGR of around 20%. The Others segment, encompassing research institutions and consultants, is estimated at over $100 million with a CAGR of 15%. Segmentation by Type includes Cloud-Based solutions, projected to dominate with a market size of over $800 million and a CAGR of 19%, owing to their scalability and accessibility. On-Premises solutions, while still relevant for specific security and integration needs, are projected to hold a market size of around $100 million with a CAGR of 10%.
Key Drivers of Crop Planning And Production Software Growth
The growth of the Crop Planning and Production Software market is propelled by several critical drivers. Technological advancements, particularly in AI, machine learning, and IoT, enable more sophisticated data analysis and automation. The escalating need for food security due to a growing global population necessitates optimized agricultural practices, making efficient planning software crucial. Increasing government support and initiatives promoting digital agriculture and precision farming further incentivize adoption. The growing awareness among farmers about the economic benefits of data-driven decision-making, such as improved yield and reduced input costs, also fuels market expansion.
Challenges in the Crop Planning And Production Software Sector
Despite robust growth, the Crop Planning and Production Software sector faces several challenges. High initial implementation costs, particularly for advanced solutions, can be a barrier for smaller farmers. The need for adequate internet connectivity and digital literacy among the farming community can also limit adoption in certain regions. Regulatory hurdles related to data privacy and ownership, though evolving, can create complexities. Moreover, the fragmented nature of the agricultural industry and resistance to change among some traditional farmers present ongoing competitive pressures.
Emerging Opportunities in Crop Planning And Production Software
Emerging opportunities in the Crop Planning and Production Software market are abundant. The integration of blockchain technology for enhanced food traceability and supply chain transparency presents a significant avenue. Expansion into emerging markets with large agricultural bases but lower current adoption rates offers substantial growth potential. The development of hyper-localized weather forecasting and pest management modules, leveraging advanced AI, will cater to specific regional needs. Furthermore, offering tailored solutions for niche crop types and organic farming practices can tap into specialized markets.
Leading Players in the Crop Planning And Production Software Market
- Cropin
- Farmbrite
- Croptracker
- Bushel Farm
- Folio3 Agtech
- AgriERP
- Conservis
- Field Margin
- Topcon
- FarmERP
- MyCrops
- Agworld
- NAVFarm
- KhetiBuddy
- AGRIVI
Key Developments in Crop Planning And Production Software Industry
- 2023 (Ongoing): Increased integration of AI for predictive analytics in yield forecasting and disease detection.
- 2023 (Q4): Rise in partnerships between software providers and hardware manufacturers (e.g., drone companies, sensor providers).
- 2024 (Q1): Focus on enhancing user experience and mobile accessibility for individual farmers.
- 2024 (Q2): Growing adoption of subscription-based pricing models across the market.
- 2024 (Q3): Emphasis on sustainability reporting features to meet consumer and regulatory demands.
- 2024 (Q4): Continued consolidation through strategic acquisitions to expand market reach and product portfolios.
Strategic Outlook for Crop Planning And Production Software Market
The strategic outlook for the Crop Planning and Production Software market remains exceptionally positive. Continued innovation in AI, IoT, and data analytics will drive the development of more sophisticated and integrated solutions. The increasing global demand for food security, coupled with governmental support for agricultural digitalization, will serve as powerful growth catalysts. The market is expected to witness further consolidation as companies seek to achieve economies of scale and expand their service offerings. Emerging markets present significant untapped potential, and a focus on user-centric design and affordability will be crucial for widespread adoption among individual farmers, solidifying the indispensable role of this software in modern agriculture.
Crop Planning And Production Software Segmentation
-
1. Application
- 1.1. Agricultural Enterprises
- 1.2. Individual Farmers
- 1.3. Others
-
2. Type
- 2.1. Cloud-Based
- 2.2. On-Premises
Crop Planning And Production Software Segmentation By Geography
-
1. North America
- 1.1. United States
- 1.2. Canada
- 1.3. Mexico
-
2. South America
- 2.1. Brazil
- 2.2. Argentina
- 2.3. Rest of South America
-
3. Europe
- 3.1. United Kingdom
- 3.2. Germany
- 3.3. France
- 3.4. Italy
- 3.5. Spain
- 3.6. Russia
- 3.7. Benelux
- 3.8. Nordics
- 3.9. Rest of Europe
-
4. Middle East & Africa
- 4.1. Turkey
- 4.2. Israel
- 4.3. GCC
- 4.4. North Africa
- 4.5. South Africa
- 4.6. Rest of Middle East & Africa
-
5. Asia Pacific
- 5.1. China
- 5.2. India
- 5.3. Japan
- 5.4. South Korea
- 5.5. ASEAN
- 5.6. Oceania
- 5.7. Rest of Asia Pacific
Crop Planning And Production Software REPORT HIGHLIGHTS
| Aspects | Details |
|---|---|
| Study Period | 2019-2033 |
| Base Year | 2024 |
| Estimated Year | 2025 |
| Forecast Period | 2025-2033 |
| Historical Period | 2019-2024 |
| Growth Rate | CAGR of XXX% from 2019-2033 |
| Segmentation |
|
Table of Contents
- 1. Introduction
- 1.1. Research Scope
- 1.2. Market Segmentation
- 1.3. Research Methodology
- 1.4. Definitions and Assumptions
- 2. Executive Summary
- 2.1. Introduction
- 3. Market Dynamics
- 3.1. Introduction
- 3.2. Market Drivers
- 3.3. Market Restrains
- 3.4. Market Trends
- 4. Market Factor Analysis
- 4.1. Porters Five Forces
- 4.2. Supply/Value Chain
- 4.3. PESTEL analysis
- 4.4. Market Entropy
- 4.5. Patent/Trademark Analysis
- 5. Global Crop Planning And Production Software Analysis, Insights and Forecast, 2019-2031
- 5.1. Market Analysis, Insights and Forecast - by Application
- 5.1.1. Agricultural Enterprises
- 5.1.2. Individual Farmers
- 5.1.3. Others
- 5.2. Market Analysis, Insights and Forecast - by Type
- 5.2.1. Cloud-Based
- 5.2.2. On-Premises
- 5.3. Market Analysis, Insights and Forecast - by Region
- 5.3.1. North America
- 5.3.2. South America
- 5.3.3. Europe
- 5.3.4. Middle East & Africa
- 5.3.5. Asia Pacific
- 5.1. Market Analysis, Insights and Forecast - by Application
- 6. North America Crop Planning And Production Software Analysis, Insights and Forecast, 2019-2031
- 6.1. Market Analysis, Insights and Forecast - by Application
- 6.1.1. Agricultural Enterprises
- 6.1.2. Individual Farmers
- 6.1.3. Others
- 6.2. Market Analysis, Insights and Forecast - by Type
- 6.2.1. Cloud-Based
- 6.2.2. On-Premises
- 6.1. Market Analysis, Insights and Forecast - by Application
- 7. South America Crop Planning And Production Software Analysis, Insights and Forecast, 2019-2031
- 7.1. Market Analysis, Insights and Forecast - by Application
- 7.1.1. Agricultural Enterprises
- 7.1.2. Individual Farmers
- 7.1.3. Others
- 7.2. Market Analysis, Insights and Forecast - by Type
- 7.2.1. Cloud-Based
- 7.2.2. On-Premises
- 7.1. Market Analysis, Insights and Forecast - by Application
- 8. Europe Crop Planning And Production Software Analysis, Insights and Forecast, 2019-2031
- 8.1. Market Analysis, Insights and Forecast - by Application
- 8.1.1. Agricultural Enterprises
- 8.1.2. Individual Farmers
- 8.1.3. Others
- 8.2. Market Analysis, Insights and Forecast - by Type
- 8.2.1. Cloud-Based
- 8.2.2. On-Premises
- 8.1. Market Analysis, Insights and Forecast - by Application
- 9. Middle East & Africa Crop Planning And Production Software Analysis, Insights and Forecast, 2019-2031
- 9.1. Market Analysis, Insights and Forecast - by Application
- 9.1.1. Agricultural Enterprises
- 9.1.2. Individual Farmers
- 9.1.3. Others
- 9.2. Market Analysis, Insights and Forecast - by Type
- 9.2.1. Cloud-Based
- 9.2.2. On-Premises
- 9.1. Market Analysis, Insights and Forecast - by Application
- 10. Asia Pacific Crop Planning And Production Software Analysis, Insights and Forecast, 2019-2031
- 10.1. Market Analysis, Insights and Forecast - by Application
- 10.1.1. Agricultural Enterprises
- 10.1.2. Individual Farmers
- 10.1.3. Others
- 10.2. Market Analysis, Insights and Forecast - by Type
- 10.2.1. Cloud-Based
- 10.2.2. On-Premises
- 10.1. Market Analysis, Insights and Forecast - by Application
- 11. Competitive Analysis
- 11.1. Global Market Share Analysis 2024
- 11.2. Company Profiles
- 11.2.1 Cropin
- 11.2.1.1. Overview
- 11.2.1.2. Products
- 11.2.1.3. SWOT Analysis
- 11.2.1.4. Recent Developments
- 11.2.1.5. Financials (Based on Availability)
- 11.2.2 Farmbrite
- 11.2.2.1. Overview
- 11.2.2.2. Products
- 11.2.2.3. SWOT Analysis
- 11.2.2.4. Recent Developments
- 11.2.2.5. Financials (Based on Availability)
- 11.2.3 Croptracker
- 11.2.3.1. Overview
- 11.2.3.2. Products
- 11.2.3.3. SWOT Analysis
- 11.2.3.4. Recent Developments
- 11.2.3.5. Financials (Based on Availability)
- 11.2.4 Bushel Farm
- 11.2.4.1. Overview
- 11.2.4.2. Products
- 11.2.4.3. SWOT Analysis
- 11.2.4.4. Recent Developments
- 11.2.4.5. Financials (Based on Availability)
- 11.2.5 Folio3 Agtech
- 11.2.5.1. Overview
- 11.2.5.2. Products
- 11.2.5.3. SWOT Analysis
- 11.2.5.4. Recent Developments
- 11.2.5.5. Financials (Based on Availability)
- 11.2.6 AgriERP
- 11.2.6.1. Overview
- 11.2.6.2. Products
- 11.2.6.3. SWOT Analysis
- 11.2.6.4. Recent Developments
- 11.2.6.5. Financials (Based on Availability)
- 11.2.7 Conservis
- 11.2.7.1. Overview
- 11.2.7.2. Products
- 11.2.7.3. SWOT Analysis
- 11.2.7.4. Recent Developments
- 11.2.7.5. Financials (Based on Availability)
- 11.2.8 Field Margin
- 11.2.8.1. Overview
- 11.2.8.2. Products
- 11.2.8.3. SWOT Analysis
- 11.2.8.4. Recent Developments
- 11.2.8.5. Financials (Based on Availability)
- 11.2.9 Topcon
- 11.2.9.1. Overview
- 11.2.9.2. Products
- 11.2.9.3. SWOT Analysis
- 11.2.9.4. Recent Developments
- 11.2.9.5. Financials (Based on Availability)
- 11.2.10 FarmERP
- 11.2.10.1. Overview
- 11.2.10.2. Products
- 11.2.10.3. SWOT Analysis
- 11.2.10.4. Recent Developments
- 11.2.10.5. Financials (Based on Availability)
- 11.2.11 MyCrops
- 11.2.11.1. Overview
- 11.2.11.2. Products
- 11.2.11.3. SWOT Analysis
- 11.2.11.4. Recent Developments
- 11.2.11.5. Financials (Based on Availability)
- 11.2.12 Agworld
- 11.2.12.1. Overview
- 11.2.12.2. Products
- 11.2.12.3. SWOT Analysis
- 11.2.12.4. Recent Developments
- 11.2.12.5. Financials (Based on Availability)
- 11.2.13 NAVFarm
- 11.2.13.1. Overview
- 11.2.13.2. Products
- 11.2.13.3. SWOT Analysis
- 11.2.13.4. Recent Developments
- 11.2.13.5. Financials (Based on Availability)
- 11.2.14 KhetiBuddy
- 11.2.14.1. Overview
- 11.2.14.2. Products
- 11.2.14.3. SWOT Analysis
- 11.2.14.4. Recent Developments
- 11.2.14.5. Financials (Based on Availability)
- 11.2.15 AGRIVI
- 11.2.15.1. Overview
- 11.2.15.2. Products
- 11.2.15.3. SWOT Analysis
- 11.2.15.4. Recent Developments
- 11.2.15.5. Financials (Based on Availability)
- 11.2.1 Cropin
List of Figures
- Figure 1: Global Crop Planning And Production Software Revenue Breakdown (million, %) by Region 2024 & 2032
- Figure 2: North America Crop Planning And Production Software Revenue (million), by Application 2024 & 2032
- Figure 3: North America Crop Planning And Production Software Revenue Share (%), by Application 2024 & 2032
- Figure 4: North America Crop Planning And Production Software Revenue (million), by Type 2024 & 2032
- Figure 5: North America Crop Planning And Production Software Revenue Share (%), by Type 2024 & 2032
- Figure 6: North America Crop Planning And Production Software Revenue (million), by Country 2024 & 2032
- Figure 7: North America Crop Planning And Production Software Revenue Share (%), by Country 2024 & 2032
- Figure 8: South America Crop Planning And Production Software Revenue (million), by Application 2024 & 2032
- Figure 9: South America Crop Planning And Production Software Revenue Share (%), by Application 2024 & 2032
- Figure 10: South America Crop Planning And Production Software Revenue (million), by Type 2024 & 2032
- Figure 11: South America Crop Planning And Production Software Revenue Share (%), by Type 2024 & 2032
- Figure 12: South America Crop Planning And Production Software Revenue (million), by Country 2024 & 2032
- Figure 13: South America Crop Planning And Production Software Revenue Share (%), by Country 2024 & 2032
- Figure 14: Europe Crop Planning And Production Software Revenue (million), by Application 2024 & 2032
- Figure 15: Europe Crop Planning And Production Software Revenue Share (%), by Application 2024 & 2032
- Figure 16: Europe Crop Planning And Production Software Revenue (million), by Type 2024 & 2032
- Figure 17: Europe Crop Planning And Production Software Revenue Share (%), by Type 2024 & 2032
- Figure 18: Europe Crop Planning And Production Software Revenue (million), by Country 2024 & 2032
- Figure 19: Europe Crop Planning And Production Software Revenue Share (%), by Country 2024 & 2032
- Figure 20: Middle East & Africa Crop Planning And Production Software Revenue (million), by Application 2024 & 2032
- Figure 21: Middle East & Africa Crop Planning And Production Software Revenue Share (%), by Application 2024 & 2032
- Figure 22: Middle East & Africa Crop Planning And Production Software Revenue (million), by Type 2024 & 2032
- Figure 23: Middle East & Africa Crop Planning And Production Software Revenue Share (%), by Type 2024 & 2032
- Figure 24: Middle East & Africa Crop Planning And Production Software Revenue (million), by Country 2024 & 2032
- Figure 25: Middle East & Africa Crop Planning And Production Software Revenue Share (%), by Country 2024 & 2032
- Figure 26: Asia Pacific Crop Planning And Production Software Revenue (million), by Application 2024 & 2032
- Figure 27: Asia Pacific Crop Planning And Production Software Revenue Share (%), by Application 2024 & 2032
- Figure 28: Asia Pacific Crop Planning And Production Software Revenue (million), by Type 2024 & 2032
- Figure 29: Asia Pacific Crop Planning And Production Software Revenue Share (%), by Type 2024 & 2032
- Figure 30: Asia Pacific Crop Planning And Production Software Revenue (million), by Country 2024 & 2032
- Figure 31: Asia Pacific Crop Planning And Production Software Revenue Share (%), by Country 2024 & 2032
List of Tables
- Table 1: Global Crop Planning And Production Software Revenue million Forecast, by Region 2019 & 2032
- Table 2: Global Crop Planning And Production Software Revenue million Forecast, by Application 2019 & 2032
- Table 3: Global Crop Planning And Production Software Revenue million Forecast, by Type 2019 & 2032
- Table 4: Global Crop Planning And Production Software Revenue million Forecast, by Region 2019 & 2032
- Table 5: Global Crop Planning And Production Software Revenue million Forecast, by Application 2019 & 2032
- Table 6: Global Crop Planning And Production Software Revenue million Forecast, by Type 2019 & 2032
- Table 7: Global Crop Planning And Production Software Revenue million Forecast, by Country 2019 & 2032
- Table 8: United States Crop Planning And Production Software Revenue (million) Forecast, by Application 2019 & 2032
- Table 9: Canada Crop Planning And Production Software Revenue (million) Forecast, by Application 2019 & 2032
- Table 10: Mexico Crop Planning And Production Software Revenue (million) Forecast, by Application 2019 & 2032
- Table 11: Global Crop Planning And Production Software Revenue million Forecast, by Application 2019 & 2032
- Table 12: Global Crop Planning And Production Software Revenue million Forecast, by Type 2019 & 2032
- Table 13: Global Crop Planning And Production Software Revenue million Forecast, by Country 2019 & 2032
- Table 14: Brazil Crop Planning And Production Software Revenue (million) Forecast, by Application 2019 & 2032
- Table 15: Argentina Crop Planning And Production Software Revenue (million) Forecast, by Application 2019 & 2032
- Table 16: Rest of South America Crop Planning And Production Software Revenue (million) Forecast, by Application 2019 & 2032
- Table 17: Global Crop Planning And Production Software Revenue million Forecast, by Application 2019 & 2032
- Table 18: Global Crop Planning And Production Software Revenue million Forecast, by Type 2019 & 2032
- Table 19: Global Crop Planning And Production Software Revenue million Forecast, by Country 2019 & 2032
- Table 20: United Kingdom Crop Planning And Production Software Revenue (million) Forecast, by Application 2019 & 2032
- Table 21: Germany Crop Planning And Production Software Revenue (million) Forecast, by Application 2019 & 2032
- Table 22: France Crop Planning And Production Software Revenue (million) Forecast, by Application 2019 & 2032
- Table 23: Italy Crop Planning And Production Software Revenue (million) Forecast, by Application 2019 & 2032
- Table 24: Spain Crop Planning And Production Software Revenue (million) Forecast, by Application 2019 & 2032
- Table 25: Russia Crop Planning And Production Software Revenue (million) Forecast, by Application 2019 & 2032
- Table 26: Benelux Crop Planning And Production Software Revenue (million) Forecast, by Application 2019 & 2032
- Table 27: Nordics Crop Planning And Production Software Revenue (million) Forecast, by Application 2019 & 2032
- Table 28: Rest of Europe Crop Planning And Production Software Revenue (million) Forecast, by Application 2019 & 2032
- Table 29: Global Crop Planning And Production Software Revenue million Forecast, by Application 2019 & 2032
- Table 30: Global Crop Planning And Production Software Revenue million Forecast, by Type 2019 & 2032
- Table 31: Global Crop Planning And Production Software Revenue million Forecast, by Country 2019 & 2032
- Table 32: Turkey Crop Planning And Production Software Revenue (million) Forecast, by Application 2019 & 2032
- Table 33: Israel Crop Planning And Production Software Revenue (million) Forecast, by Application 2019 & 2032
- Table 34: GCC Crop Planning And Production Software Revenue (million) Forecast, by Application 2019 & 2032
- Table 35: North Africa Crop Planning And Production Software Revenue (million) Forecast, by Application 2019 & 2032
- Table 36: South Africa Crop Planning And Production Software Revenue (million) Forecast, by Application 2019 & 2032
- Table 37: Rest of Middle East & Africa Crop Planning And Production Software Revenue (million) Forecast, by Application 2019 & 2032
- Table 38: Global Crop Planning And Production Software Revenue million Forecast, by Application 2019 & 2032
- Table 39: Global Crop Planning And Production Software Revenue million Forecast, by Type 2019 & 2032
- Table 40: Global Crop Planning And Production Software Revenue million Forecast, by Country 2019 & 2032
- Table 41: China Crop Planning And Production Software Revenue (million) Forecast, by Application 2019 & 2032
- Table 42: India Crop Planning And Production Software Revenue (million) Forecast, by Application 2019 & 2032
- Table 43: Japan Crop Planning And Production Software Revenue (million) Forecast, by Application 2019 & 2032
- Table 44: South Korea Crop Planning And Production Software Revenue (million) Forecast, by Application 2019 & 2032
- Table 45: ASEAN Crop Planning And Production Software Revenue (million) Forecast, by Application 2019 & 2032
- Table 46: Oceania Crop Planning And Production Software Revenue (million) Forecast, by Application 2019 & 2032
- Table 47: Rest of Asia Pacific Crop Planning And Production Software Revenue (million) Forecast, by Application 2019 & 2032
Frequently Asked Questions
1. What is the projected Compound Annual Growth Rate (CAGR) of the Crop Planning And Production Software?
The projected CAGR is approximately XXX%.
2. Which companies are prominent players in the Crop Planning And Production Software?
Key companies in the market include Cropin, Farmbrite, Croptracker, Bushel Farm, Folio3 Agtech, AgriERP, Conservis, Field Margin, Topcon, FarmERP, MyCrops, Agworld, NAVFarm, KhetiBuddy, AGRIVI.
3. What are the main segments of the Crop Planning And Production Software?
The market segments include Application, Type.
4. Can you provide details about the market size?
The market size is estimated to be USD XXX million as of 2022.
5. What are some drivers contributing to market growth?
N/A
6. What are the notable trends driving market growth?
N/A
7. Are there any restraints impacting market growth?
N/A
8. Can you provide examples of recent developments in the market?
N/A
9. What pricing options are available for accessing the report?
Pricing options include single-user, multi-user, and enterprise licenses priced at USD 2900.00, USD 4350.00, and USD 5800.00 respectively.
10. Is the market size provided in terms of value or volume?
The market size is provided in terms of value, measured in million.
11. Are there any specific market keywords associated with the report?
Yes, the market keyword associated with the report is "Crop Planning And Production Software," which aids in identifying and referencing the specific market segment covered.
12. How do I determine which pricing option suits my needs best?
The pricing options vary based on user requirements and access needs. Individual users may opt for single-user licenses, while businesses requiring broader access may choose multi-user or enterprise licenses for cost-effective access to the report.
13. Are there any additional resources or data provided in the Crop Planning And Production Software report?
While the report offers comprehensive insights, it's advisable to review the specific contents or supplementary materials provided to ascertain if additional resources or data are available.
14. How can I stay updated on further developments or reports in the Crop Planning And Production Software?
To stay informed about further developments, trends, and reports in the Crop Planning And Production Software, consider subscribing to industry newsletters, following relevant companies and organizations, or regularly checking reputable industry news sources and publications.
Methodology
Step 1 - Identification of Relevant Samples Size from Population Database


Step 2 - Approaches for Defining Global Market Size (Value, Volume* & Price*)

Note*: In applicable scenarios
Step 3 - Data Sources
Primary Research
- Web Analytics
- Survey Reports
- Research Institute
- Latest Research Reports
- Opinion Leaders
Secondary Research
- Annual Reports
- White Paper
- Latest Press Release
- Industry Association
- Paid Database
- Investor Presentations

Step 4 - Data Triangulation
Involves using different sources of information in order to increase the validity of a study
These sources are likely to be stakeholders in a program - participants, other researchers, program staff, other community members, and so on.
Then we put all data in single framework & apply various statistical tools to find out the dynamic on the market.
During the analysis stage, feedback from the stakeholder groups would be compared to determine areas of agreement as well as areas of divergence


