

Key Insights
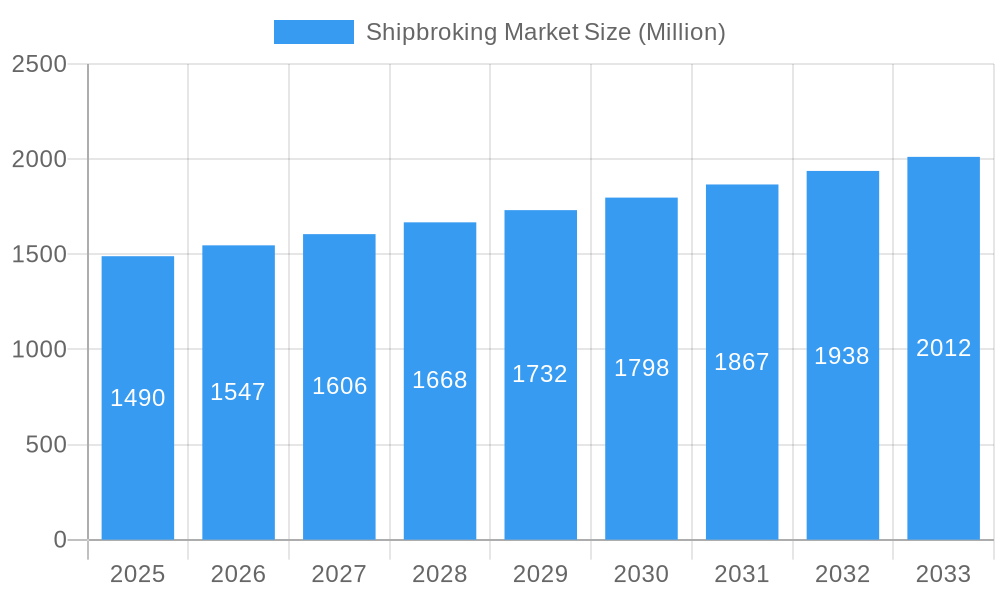
The global shipbroking market, valued at $1.49 billion in 2025, is projected to experience steady growth, driven primarily by increasing global trade volumes and the ongoing demand for efficient vessel management and chartering services. The market's Compound Annual Growth Rate (CAGR) of 3.65% from 2019 to 2033 indicates a consistent upward trajectory, albeit a moderate one, suggesting a stable and relatively predictable market environment. Growth will be fueled by several factors, including the expansion of global shipping lanes, the need for sophisticated logistical solutions in an increasingly complex supply chain, and the adoption of advanced technologies such as AI and machine learning for optimizing vessel operations and charter negotiations. Key players like Aries Shipbroking (Asia) Pte Ltd, BRS Group, and Clarkson PLC are actively shaping the market landscape through strategic partnerships, technological investments, and expansion into new geographical regions. However, the market is also subject to external factors such as fluctuating fuel prices, geopolitical instability, and environmental regulations impacting shipping practices. These uncertainties may introduce periods of slower growth or even temporary contraction, although the long-term outlook remains positive.
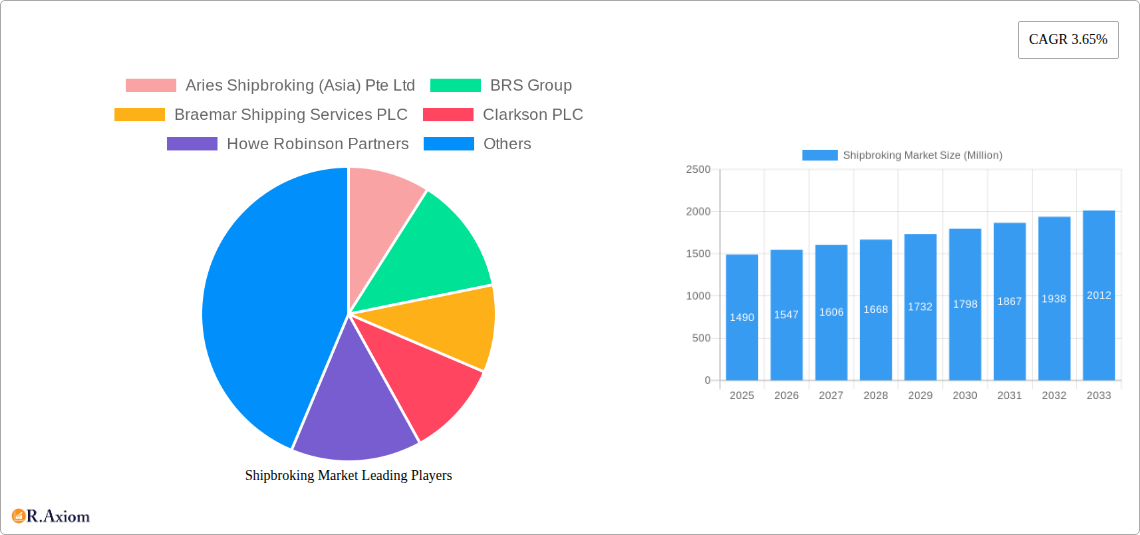
Shipbroking Market Market Size (In Billion)
Despite the projected growth, the shipbroking market is anticipated to witness a degree of consolidation, with larger players acquiring smaller firms to enhance their market share and service offerings. This trend will increase the competitive pressure within the industry. Segmentation within the market is likely to continue based on vessel type (dry bulk, tankers, containerships), geographic region, and the specific services offered (chartering, sale & purchase, etc.). The rising adoption of digital platforms and data analytics is expected to transform operational efficiency and provide improved decision-making capabilities for brokers. However, challenges like cybersecurity threats and the need for skilled professionals will need careful consideration to maintain the market’s growth momentum. The successful players will be those who adapt quickly to technological changes, maintain a strong network of contacts, and effectively manage risks.
Shipbroking Market Company Market Share
This meticulously researched report provides a detailed analysis of the global Shipbroking Market, offering invaluable insights for industry stakeholders, investors, and strategic decision-makers. Covering the period from 2019 to 2033, with a base year of 2025, this report examines market dynamics, competitive landscapes, and future growth potential. The report includes detailed segmentation, growth projections, and a comprehensive analysis of key players, enabling informed strategic planning and investment decisions.
Shipbroking Market Market Concentration & Innovation
The Shipbroking market is characterized by a moderately concentrated landscape, featuring a few dominant entities alongside a robust ecosystem of specialized niche players. In 2025, established leaders such as Clarkson PLC, Braemar Shipping Services PLC, and Fearnleys A/S are projected to collectively hold a significant portion of the market share, estimated at **xx%**. This concentration is balanced by a multitude of agile, smaller brokers, each catering to specific vessel types, trade routes, or client needs, fostering a highly competitive and dynamic environment.
Market Concentration Insights (2025 Projections):
- Top 3 Players' Market Share: xx%
- Top 5 Players' Market Share: xx%
- Herfindahl-Hirschman Index (HHI): xx (Indicative of moderate market concentration)
Catalysts for Innovation in Shipbroking:
- Digital Transformation: Advancements in vessel tracking systems, sophisticated data analytics platforms, and integrated digital brokerage portals are revolutionizing operational efficiencies, enhancing transparency, and providing deeper market intelligence.
- Artificial Intelligence (AI) & Machine Learning (ML): The burgeoning adoption of AI and ML algorithms is proving instrumental in refining freight rate predictions, optimizing risk management strategies, and automating routine tasks, thereby driving significant innovation.
- Specialized Service Development: A continuous drive towards developing highly specialized brokerage services tailored to distinct vessel categories (e.g., LNG, specialized tankers, offshore vessels) and intricate trade routes is a key innovation trend.
- Sustainability and ESG Focus: Emerging innovations are also geared towards assisting clients with navigating the complexities of environmental regulations and promoting sustainable shipping practices.
Regulatory Landscape and Strategic Consolidation:
- Navigating Regulatory Frameworks: Adherence to increasingly stringent international and national maritime and trade regulations necessitates robust compliance strategies and can influence operational costs and business models.
- Mergers & Acquisitions (M&A) Trends: The period between 2019 and 2024 has seen substantial M&A activity, with deal values surpassing **xx Million**. These consolidations are often strategic moves aimed at achieving economies of scale, expanding global reach, and acquiring specialized expertise.
- Competitive Pressures: While direct owner-to-charterer negotiations present a potential substitute, particularly for smaller brokers, the inherent value proposition of established shipbrokers lies in their profound market knowledge, extensive networks, and ability to manage complex transactions.
Evolving End-User Demands:
- Digital Preference: Shipowners and charterers are increasingly gravitating towards digital platforms and streamlined online brokerage services for greater convenience and accessibility.
- Demand for Transparency and Efficiency: A heightened expectation for end-to-end transparency and seamless documentation processes throughout the entire shipping transaction lifecycle.
Shipbroking Market Industry Trends & Insights
The global Shipbroking Market is experiencing robust growth, driven by increasing global trade volumes and the demand for efficient vessel chartering solutions. The market is projected to witness a Compound Annual Growth Rate (CAGR) of xx% during the forecast period (2025-2033). This growth is propelled by several factors, including the expansion of global trade, particularly in emerging economies; fluctuations in global fuel prices impacting charter rates; and the increasing complexity of maritime regulations.
Technological disruptions, such as the adoption of blockchain technology for secure and transparent documentation, are reshaping the industry. The market penetration of these technologies is gradually increasing, though adoption rates vary across different regions and segments. Furthermore, evolving consumer preferences towards greater transparency, efficiency, and personalized services are influencing the strategies of shipbroking firms. Competitive dynamics are largely characterized by intense rivalry among established players and the emergence of new entrants offering innovative digital solutions.
Dominant Markets & Segments in Shipbroking Market
The **Asia-Pacific region is poised to maintain its leadership** in the global Shipbroking Market throughout the projected forecast period. This dominance is primarily fueled by the region's robust economic expansion, ongoing investments in state-of-the-art port infrastructure, and the substantial growth in intra-regional and international trade volumes. Key contributors to this regional strength include China, India, and the dynamic economies of Southeast Asia.
Key Factors Underpinning Asia-Pacific's Market Dominance:
- Accelerated Economic Growth: The rapid economic development of emerging Asian economies directly translates into increased demand for maritime transportation services.
- Infrastructure Investment: Significant capital expenditure on developing and upgrading port facilities and logistics networks enhances shipping efficiency and capacity.
- Intra-Regional Trade Flourishing: Growing trade partnerships and supply chain integration within the Asia-Pacific zone itself significantly boost shipping activity.
- Supportive Government Policies: Favorable maritime trade policies and incentives implemented by governments across the region further bolster the sector's growth.
A comprehensive analysis of market share distribution and segment-specific dominance, encompassing key areas such as dry bulk, tanker, container, and specialized cargo, will be detailed within the full market report. The report will explicitly identify the segments exhibiting the largest market share and the highest growth potential. Furthermore, an in-depth country-level analysis will provide granular insights into the distinct market dynamics prevalent in specific regions.
Shipbroking Market Product Developments
Recent advancements in the shipbroking sector are predominantly centered around the pervasive integration of **digital technologies and sophisticated data analytics capabilities**. This wave of innovation encompasses the deployment of advanced software solutions designed for real-time vessel tracking, highly accurate freight rate forecasting, and robust risk management frameworks. The overarching objective is to streamline operational workflows, significantly boost overall efficiency, and deliver more precise and actionable market intelligence to clients. These technological leaps empower brokers with a distinct competitive edge through enhanced speed, superior accuracy, and improved cost-effectiveness in their service delivery.
Report Scope & Segmentation Analysis
This report segments the Shipbroking Market based on vessel type (dry bulk, tankers, containers, etc.), geographic region (North America, Europe, Asia-Pacific, etc.), and service type (chartering, sale & purchase, etc.). Each segment is analyzed in detail, including growth projections, market size, and competitive dynamics. Market size for each segment will be provided for historical, base, and forecast years.
Key Drivers of Shipbroking Market Growth
The expansion of the Shipbroking Market is propelled by a confluence of significant factors. The continuous rise in global trade volumes necessitates increasingly efficient and expert vessel chartering services. The growing intricacy and evolving nature of maritime regulations demand specialized brokerage expertise for compliance and navigation. Furthermore, the proactive adoption of cutting-edge technologies is demonstrably improving operational efficiency and fostering greater transparency across the industry. The robust economic expansion witnessed in emerging markets, coupled with substantial government investments in enhancing port infrastructure, also plays a crucial role in driving market growth.
Challenges in the Shipbroking Market Sector
The Shipbroking Market faces challenges such as increasing regulatory complexity, fluctuating fuel prices impacting charter rates, and intense competition among brokers. Supply chain disruptions and cybersecurity risks also pose significant threats.
Emerging Opportunities in Shipbroking Market
Emerging opportunities lie in the increasing adoption of digital technologies, such as AI and blockchain, for enhanced efficiency and transparency. The expansion of e-commerce and the growth of specialized niche markets (e.g., LNG carriers) also present new avenues for growth.
Leading Players in the Shipbroking Market Market
- Aries Shipbroking (Asia) Pte Ltd
- BRS Group
- Braemar Shipping Services PLC
- Clarkson PLC
- Howe Robinson Partners
- Simpson Spense Young
- Fearnleys A/S
- ACM Shipping Group PLC
- Chowgule Brothers Pvt Ltd
- Affinity (Shipping) LLP
Note: This list is not exhaustive and represents key prominent players in the market.
Key Developments in Shipbroking Market Industry
- September 2023: ZIM Integrated Shipping Services Ltd. and MSC announced a new operational collaboration agreement, enhancing service standards and operational efficiencies. This collaboration signifies a shift towards strategic partnerships in the container shipping sector, influencing market dynamics.
- January 2024: Maersk and Hapag-Lloyd announced a significant long-term collaboration, consolidating hundreds of vessels. This partnership signals a trend toward consolidation among major players, potentially impacting market competition and capacity.
Strategic Outlook for Shipbroking Market Market
The Shipbroking Market is poised for continued growth, driven by increasing global trade and technological advancements. Opportunities exist in specialized segments and the adoption of digital solutions. Strategic partnerships and mergers & acquisitions are likely to shape the market landscape, further enhancing efficiency and competitiveness. Focus on innovation, digital transformation, and specialized services will be crucial for success in the years to come.
Shipbroking Market Segmentation
-
1. Type
- 1.1. Dry Cargo Broking
- 1.2. Tanker Broking
- 1.3. Container Vessel Broking
- 1.4. Other Types
-
2. Service
- 2.1. Charting
- 2.2. Sales and Purchases
- 2.3. Offshore Services
- 2.4. Newbuilding Services
- 2.5. Salvage &Towage Services
-
3. Industry
- 3.1. Oil and Gas
- 3.2. Manufacturing
- 3.3. Aerospace and Defense
- 3.4. Government
- 3.5. Other Industries
Shipbroking Market Segmentation By Geography
-
1. North America
- 1.1. United States
- 1.2. Canada
- 1.3. Rest of North America
-
2. Europe
- 2.1. Germany
- 2.2. United Kingdom
- 2.3. France
- 2.4. Russia
- 2.5. Spain
- 2.6. Rest of Europe
-
3. Asia Pacific
- 3.1. India
- 3.2. China
- 3.3. Japan
- 3.4. Rest of Asia Pacific
-
4. South America
- 4.1. Brazil
- 4.2. Argentina
- 4.3. Rest of South America
-
5. Middle East and Africa
- 5.1. United Arab Emirates
- 5.2. Saudi Arabia
- 5.3. Rest of Middle East and Africa
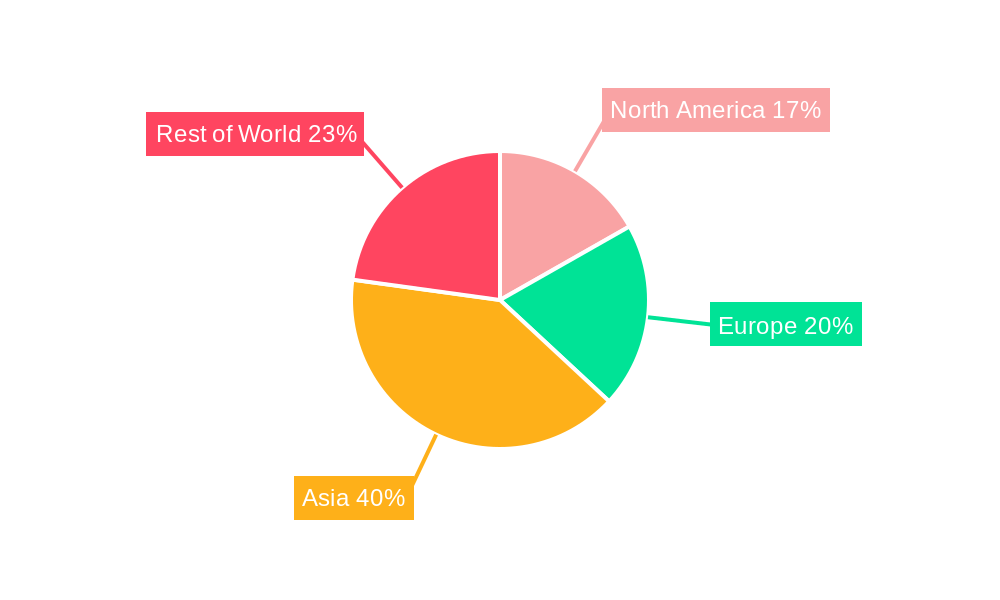
Shipbroking Market Regional Market Share
Geographic Coverage of Shipbroking Market
Shipbroking Market REPORT HIGHLIGHTS
| Aspects | Details |
|---|---|
| Study Period | 2020-2034 |
| Base Year | 2025 |
| Estimated Year | 2026 |
| Forecast Period | 2026-2034 |
| Historical Period | 2020-2025 |
| Growth Rate | CAGR of 3.65% from 2020-2034 |
| Segmentation |
|
Table of Contents
- 1. Introduction
- 1.1. Research Scope
- 1.2. Market Segmentation
- 1.3. Research Objective
- 1.4. Definitions and Assumptions
- 2. Executive Summary
- 2.1. Market Snapshot
- 3. Market Dynamics
- 3.1. Market Drivers
- 3.2. Market Restrains
- 3.3. Market Trends
- 3.4. Market Opportunities
- 4. Market Factor Analysis
- 4.1. Porters Five Forces
- 4.1.1. Bargaining Power of Suppliers
- 4.1.2. Bargaining Power of Buyers
- 4.1.3. Threat of New Entrants
- 4.1.4. Threat of Substitutes
- 4.1.5. Competitive Rivalry
- 4.2. PESTEL analysis
- 4.3. BCG Analysis
- 4.3.1. Stars (High Growth, High Market Share)
- 4.3.2. Cash Cows (Low Growth, High Market Share)
- 4.3.3. Question Mark (High Growth, Low Market Share)
- 4.3.4. Dogs (Low Growth, Low Market Share)
- 4.4. Ansoff Matrix Analysis
- 4.5. Supply Chain Analysis
- 4.6. Regulatory Landscape
- 4.7. Current Market Potential and Opportunity Assessment (TAM–SAM–SOM Framework)
- 4.8. RAX Analyst Note
- 4.1. Porters Five Forces
- 5. Market Analysis, Insights and Forecast 2021-2033
- 5.1. Market Analysis, Insights and Forecast - by Type
- 5.1.1. Dry Cargo Broking
- 5.1.2. Tanker Broking
- 5.1.3. Container Vessel Broking
- 5.1.4. Other Types
- 5.2. Market Analysis, Insights and Forecast - by Service
- 5.2.1. Charting
- 5.2.2. Sales and Purchases
- 5.2.3. Offshore Services
- 5.2.4. Newbuilding Services
- 5.2.5. Salvage &Towage Services
- 5.3. Market Analysis, Insights and Forecast - by Industry
- 5.3.1. Oil and Gas
- 5.3.2. Manufacturing
- 5.3.3. Aerospace and Defense
- 5.3.4. Government
- 5.3.5. Other Industries
- 5.4. Market Analysis, Insights and Forecast - by Region
- 5.4.1. North America
- 5.4.2. Europe
- 5.4.3. Asia Pacific
- 5.4.4. South America
- 5.4.5. Middle East and Africa
- 5.1. Market Analysis, Insights and Forecast - by Type
- 6. Global Shipbroking Market Analysis, Insights and Forecast, 2021-2033
- 6.1. Market Analysis, Insights and Forecast - by Type
- 6.1.1. Dry Cargo Broking
- 6.1.2. Tanker Broking
- 6.1.3. Container Vessel Broking
- 6.1.4. Other Types
- 6.2. Market Analysis, Insights and Forecast - by Service
- 6.2.1. Charting
- 6.2.2. Sales and Purchases
- 6.2.3. Offshore Services
- 6.2.4. Newbuilding Services
- 6.2.5. Salvage &Towage Services
- 6.3. Market Analysis, Insights and Forecast - by Industry
- 6.3.1. Oil and Gas
- 6.3.2. Manufacturing
- 6.3.3. Aerospace and Defense
- 6.3.4. Government
- 6.3.5. Other Industries
- 6.1. Market Analysis, Insights and Forecast - by Type
- 7. North America Shipbroking Market Analysis, Insights and Forecast, 2020-2032
- 7.1. Market Analysis, Insights and Forecast - by Type
- 7.1.1. Dry Cargo Broking
- 7.1.2. Tanker Broking
- 7.1.3. Container Vessel Broking
- 7.1.4. Other Types
- 7.2. Market Analysis, Insights and Forecast - by Service
- 7.2.1. Charting
- 7.2.2. Sales and Purchases
- 7.2.3. Offshore Services
- 7.2.4. Newbuilding Services
- 7.2.5. Salvage &Towage Services
- 7.3. Market Analysis, Insights and Forecast - by Industry
- 7.3.1. Oil and Gas
- 7.3.2. Manufacturing
- 7.3.3. Aerospace and Defense
- 7.3.4. Government
- 7.3.5. Other Industries
- 7.1. Market Analysis, Insights and Forecast - by Type
- 8. Europe Shipbroking Market Analysis, Insights and Forecast, 2020-2032
- 8.1. Market Analysis, Insights and Forecast - by Type
- 8.1.1. Dry Cargo Broking
- 8.1.2. Tanker Broking
- 8.1.3. Container Vessel Broking
- 8.1.4. Other Types
- 8.2. Market Analysis, Insights and Forecast - by Service
- 8.2.1. Charting
- 8.2.2. Sales and Purchases
- 8.2.3. Offshore Services
- 8.2.4. Newbuilding Services
- 8.2.5. Salvage &Towage Services
- 8.3. Market Analysis, Insights and Forecast - by Industry
- 8.3.1. Oil and Gas
- 8.3.2. Manufacturing
- 8.3.3. Aerospace and Defense
- 8.3.4. Government
- 8.3.5. Other Industries
- 8.1. Market Analysis, Insights and Forecast - by Type
- 9. Asia Pacific Shipbroking Market Analysis, Insights and Forecast, 2020-2032
- 9.1. Market Analysis, Insights and Forecast - by Type
- 9.1.1. Dry Cargo Broking
- 9.1.2. Tanker Broking
- 9.1.3. Container Vessel Broking
- 9.1.4. Other Types
- 9.2. Market Analysis, Insights and Forecast - by Service
- 9.2.1. Charting
- 9.2.2. Sales and Purchases
- 9.2.3. Offshore Services
- 9.2.4. Newbuilding Services
- 9.2.5. Salvage &Towage Services
- 9.3. Market Analysis, Insights and Forecast - by Industry
- 9.3.1. Oil and Gas
- 9.3.2. Manufacturing
- 9.3.3. Aerospace and Defense
- 9.3.4. Government
- 9.3.5. Other Industries
- 9.1. Market Analysis, Insights and Forecast - by Type
- 10. South America Shipbroking Market Analysis, Insights and Forecast, 2020-2032
- 10.1. Market Analysis, Insights and Forecast - by Type
- 10.1.1. Dry Cargo Broking
- 10.1.2. Tanker Broking
- 10.1.3. Container Vessel Broking
- 10.1.4. Other Types
- 10.2. Market Analysis, Insights and Forecast - by Service
- 10.2.1. Charting
- 10.2.2. Sales and Purchases
- 10.2.3. Offshore Services
- 10.2.4. Newbuilding Services
- 10.2.5. Salvage &Towage Services
- 10.3. Market Analysis, Insights and Forecast - by Industry
- 10.3.1. Oil and Gas
- 10.3.2. Manufacturing
- 10.3.3. Aerospace and Defense
- 10.3.4. Government
- 10.3.5. Other Industries
- 10.1. Market Analysis, Insights and Forecast - by Type
- 11. Middle East and Africa Shipbroking Market Analysis, Insights and Forecast, 2020-2032
- 11.1. Market Analysis, Insights and Forecast - by Type
- 11.1.1. Dry Cargo Broking
- 11.1.2. Tanker Broking
- 11.1.3. Container Vessel Broking
- 11.1.4. Other Types
- 11.2. Market Analysis, Insights and Forecast - by Service
- 11.2.1. Charting
- 11.2.2. Sales and Purchases
- 11.2.3. Offshore Services
- 11.2.4. Newbuilding Services
- 11.2.5. Salvage &Towage Services
- 11.3. Market Analysis, Insights and Forecast - by Industry
- 11.3.1. Oil and Gas
- 11.3.2. Manufacturing
- 11.3.3. Aerospace and Defense
- 11.3.4. Government
- 11.3.5. Other Industries
- 11.1. Market Analysis, Insights and Forecast - by Type
- 12. Competitive Analysis
- 12.1. Company Profiles
- 12.1.1 Aries Shipbroking (Asia) Pte Ltd
- 12.1.1.1. Company Overview
- 12.1.1.2. Products
- 12.1.1.3. Company Financials
- 12.1.1.4. SWOT Analysis
- 12.1.2 BRS Group
- 12.1.2.1. Company Overview
- 12.1.2.2. Products
- 12.1.2.3. Company Financials
- 12.1.2.4. SWOT Analysis
- 12.1.3 Braemar Shipping Services PLC
- 12.1.3.1. Company Overview
- 12.1.3.2. Products
- 12.1.3.3. Company Financials
- 12.1.3.4. SWOT Analysis
- 12.1.4 Clarkson PLC
- 12.1.4.1. Company Overview
- 12.1.4.2. Products
- 12.1.4.3. Company Financials
- 12.1.4.4. SWOT Analysis
- 12.1.5 Howe Robinson Partners
- 12.1.5.1. Company Overview
- 12.1.5.2. Products
- 12.1.5.3. Company Financials
- 12.1.5.4. SWOT Analysis
- 12.1.6 Simpson Spense Young
- 12.1.6.1. Company Overview
- 12.1.6.2. Products
- 12.1.6.3. Company Financials
- 12.1.6.4. SWOT Analysis
- 12.1.7 Fearnleys A/S
- 12.1.7.1. Company Overview
- 12.1.7.2. Products
- 12.1.7.3. Company Financials
- 12.1.7.4. SWOT Analysis
- 12.1.8 ACM Shipping Group PLC
- 12.1.8.1. Company Overview
- 12.1.8.2. Products
- 12.1.8.3. Company Financials
- 12.1.8.4. SWOT Analysis
- 12.1.9 Chowgule Brothers Pvt Ltd
- 12.1.9.1. Company Overview
- 12.1.9.2. Products
- 12.1.9.3. Company Financials
- 12.1.9.4. SWOT Analysis
- 12.1.10 Affinity (Shipping) LLP**List Not Exhaustive
- 12.1.10.1. Company Overview
- 12.1.10.2. Products
- 12.1.10.3. Company Financials
- 12.1.10.4. SWOT Analysis
- 12.1.1 Aries Shipbroking (Asia) Pte Ltd
- 12.2. Market Entropy
- 12.2.1 Company's Key Areas Served
- 12.2.2 Recent Developments
- 12.3. Company Market Share Analysis 2025
- 12.3.1 Top 5 Companies Market Share Analysis
- 12.3.2 Top 3 Companies Market Share Analysis
- 12.4. List of Potential Customers
- 13. Research Methodology
List of Figures
- Figure 1: Global Shipbroking Market Revenue Breakdown (Million, %) by Region 2025 & 2033
- Figure 2: Global Shipbroking Market Volume Breakdown (Billion, %) by Region 2025 & 2033
- Figure 3: North America Shipbroking Market Revenue (Million), by Type 2025 & 2033
- Figure 4: North America Shipbroking Market Volume (Billion), by Type 2025 & 2033
- Figure 5: North America Shipbroking Market Revenue Share (%), by Type 2025 & 2033
- Figure 6: North America Shipbroking Market Volume Share (%), by Type 2025 & 2033
- Figure 7: North America Shipbroking Market Revenue (Million), by Service 2025 & 2033
- Figure 8: North America Shipbroking Market Volume (Billion), by Service 2025 & 2033
- Figure 9: North America Shipbroking Market Revenue Share (%), by Service 2025 & 2033
- Figure 10: North America Shipbroking Market Volume Share (%), by Service 2025 & 2033
- Figure 11: North America Shipbroking Market Revenue (Million), by Industry 2025 & 2033
- Figure 12: North America Shipbroking Market Volume (Billion), by Industry 2025 & 2033
- Figure 13: North America Shipbroking Market Revenue Share (%), by Industry 2025 & 2033
- Figure 14: North America Shipbroking Market Volume Share (%), by Industry 2025 & 2033
- Figure 15: North America Shipbroking Market Revenue (Million), by Country 2025 & 2033
- Figure 16: North America Shipbroking Market Volume (Billion), by Country 2025 & 2033
- Figure 17: North America Shipbroking Market Revenue Share (%), by Country 2025 & 2033
- Figure 18: North America Shipbroking Market Volume Share (%), by Country 2025 & 2033
- Figure 19: Europe Shipbroking Market Revenue (Million), by Type 2025 & 2033
- Figure 20: Europe Shipbroking Market Volume (Billion), by Type 2025 & 2033
- Figure 21: Europe Shipbroking Market Revenue Share (%), by Type 2025 & 2033
- Figure 22: Europe Shipbroking Market Volume Share (%), by Type 2025 & 2033
- Figure 23: Europe Shipbroking Market Revenue (Million), by Service 2025 & 2033
- Figure 24: Europe Shipbroking Market Volume (Billion), by Service 2025 & 2033
- Figure 25: Europe Shipbroking Market Revenue Share (%), by Service 2025 & 2033
- Figure 26: Europe Shipbroking Market Volume Share (%), by Service 2025 & 2033
- Figure 27: Europe Shipbroking Market Revenue (Million), by Industry 2025 & 2033
- Figure 28: Europe Shipbroking Market Volume (Billion), by Industry 2025 & 2033
- Figure 29: Europe Shipbroking Market Revenue Share (%), by Industry 2025 & 2033
- Figure 30: Europe Shipbroking Market Volume Share (%), by Industry 2025 & 2033
- Figure 31: Europe Shipbroking Market Revenue (Million), by Country 2025 & 2033
- Figure 32: Europe Shipbroking Market Volume (Billion), by Country 2025 & 2033
- Figure 33: Europe Shipbroking Market Revenue Share (%), by Country 2025 & 2033
- Figure 34: Europe Shipbroking Market Volume Share (%), by Country 2025 & 2033
- Figure 35: Asia Pacific Shipbroking Market Revenue (Million), by Type 2025 & 2033
- Figure 36: Asia Pacific Shipbroking Market Volume (Billion), by Type 2025 & 2033
- Figure 37: Asia Pacific Shipbroking Market Revenue Share (%), by Type 2025 & 2033
- Figure 38: Asia Pacific Shipbroking Market Volume Share (%), by Type 2025 & 2033
- Figure 39: Asia Pacific Shipbroking Market Revenue (Million), by Service 2025 & 2033
- Figure 40: Asia Pacific Shipbroking Market Volume (Billion), by Service 2025 & 2033
- Figure 41: Asia Pacific Shipbroking Market Revenue Share (%), by Service 2025 & 2033
- Figure 42: Asia Pacific Shipbroking Market Volume Share (%), by Service 2025 & 2033
- Figure 43: Asia Pacific Shipbroking Market Revenue (Million), by Industry 2025 & 2033
- Figure 44: Asia Pacific Shipbroking Market Volume (Billion), by Industry 2025 & 2033
- Figure 45: Asia Pacific Shipbroking Market Revenue Share (%), by Industry 2025 & 2033
- Figure 46: Asia Pacific Shipbroking Market Volume Share (%), by Industry 2025 & 2033
- Figure 47: Asia Pacific Shipbroking Market Revenue (Million), by Country 2025 & 2033
- Figure 48: Asia Pacific Shipbroking Market Volume (Billion), by Country 2025 & 2033
- Figure 49: Asia Pacific Shipbroking Market Revenue Share (%), by Country 2025 & 2033
- Figure 50: Asia Pacific Shipbroking Market Volume Share (%), by Country 2025 & 2033
- Figure 51: South America Shipbroking Market Revenue (Million), by Type 2025 & 2033
- Figure 52: South America Shipbroking Market Volume (Billion), by Type 2025 & 2033
- Figure 53: South America Shipbroking Market Revenue Share (%), by Type 2025 & 2033
- Figure 54: South America Shipbroking Market Volume Share (%), by Type 2025 & 2033
- Figure 55: South America Shipbroking Market Revenue (Million), by Service 2025 & 2033
- Figure 56: South America Shipbroking Market Volume (Billion), by Service 2025 & 2033
- Figure 57: South America Shipbroking Market Revenue Share (%), by Service 2025 & 2033
- Figure 58: South America Shipbroking Market Volume Share (%), by Service 2025 & 2033
- Figure 59: South America Shipbroking Market Revenue (Million), by Industry 2025 & 2033
- Figure 60: South America Shipbroking Market Volume (Billion), by Industry 2025 & 2033
- Figure 61: South America Shipbroking Market Revenue Share (%), by Industry 2025 & 2033
- Figure 62: South America Shipbroking Market Volume Share (%), by Industry 2025 & 2033
- Figure 63: South America Shipbroking Market Revenue (Million), by Country 2025 & 2033
- Figure 64: South America Shipbroking Market Volume (Billion), by Country 2025 & 2033
- Figure 65: South America Shipbroking Market Revenue Share (%), by Country 2025 & 2033
- Figure 66: South America Shipbroking Market Volume Share (%), by Country 2025 & 2033
- Figure 67: Middle East and Africa Shipbroking Market Revenue (Million), by Type 2025 & 2033
- Figure 68: Middle East and Africa Shipbroking Market Volume (Billion), by Type 2025 & 2033
- Figure 69: Middle East and Africa Shipbroking Market Revenue Share (%), by Type 2025 & 2033
- Figure 70: Middle East and Africa Shipbroking Market Volume Share (%), by Type 2025 & 2033
- Figure 71: Middle East and Africa Shipbroking Market Revenue (Million), by Service 2025 & 2033
- Figure 72: Middle East and Africa Shipbroking Market Volume (Billion), by Service 2025 & 2033
- Figure 73: Middle East and Africa Shipbroking Market Revenue Share (%), by Service 2025 & 2033
- Figure 74: Middle East and Africa Shipbroking Market Volume Share (%), by Service 2025 & 2033
- Figure 75: Middle East and Africa Shipbroking Market Revenue (Million), by Industry 2025 & 2033
- Figure 76: Middle East and Africa Shipbroking Market Volume (Billion), by Industry 2025 & 2033
- Figure 77: Middle East and Africa Shipbroking Market Revenue Share (%), by Industry 2025 & 2033
- Figure 78: Middle East and Africa Shipbroking Market Volume Share (%), by Industry 2025 & 2033
- Figure 79: Middle East and Africa Shipbroking Market Revenue (Million), by Country 2025 & 2033
- Figure 80: Middle East and Africa Shipbroking Market Volume (Billion), by Country 2025 & 2033
- Figure 81: Middle East and Africa Shipbroking Market Revenue Share (%), by Country 2025 & 2033
- Figure 82: Middle East and Africa Shipbroking Market Volume Share (%), by Country 2025 & 2033
List of Tables
- Table 1: Global Shipbroking Market Revenue Million Forecast, by Type 2020 & 2033
- Table 2: Global Shipbroking Market Volume Billion Forecast, by Type 2020 & 2033
- Table 3: Global Shipbroking Market Revenue Million Forecast, by Service 2020 & 2033
- Table 4: Global Shipbroking Market Volume Billion Forecast, by Service 2020 & 2033
- Table 5: Global Shipbroking Market Revenue Million Forecast, by Industry 2020 & 2033
- Table 6: Global Shipbroking Market Volume Billion Forecast, by Industry 2020 & 2033
- Table 7: Global Shipbroking Market Revenue Million Forecast, by Region 2020 & 2033
- Table 8: Global Shipbroking Market Volume Billion Forecast, by Region 2020 & 2033
- Table 9: Global Shipbroking Market Revenue Million Forecast, by Type 2020 & 2033
- Table 10: Global Shipbroking Market Volume Billion Forecast, by Type 2020 & 2033
- Table 11: Global Shipbroking Market Revenue Million Forecast, by Service 2020 & 2033
- Table 12: Global Shipbroking Market Volume Billion Forecast, by Service 2020 & 2033
- Table 13: Global Shipbroking Market Revenue Million Forecast, by Industry 2020 & 2033
- Table 14: Global Shipbroking Market Volume Billion Forecast, by Industry 2020 & 2033
- Table 15: Global Shipbroking Market Revenue Million Forecast, by Country 2020 & 2033
- Table 16: Global Shipbroking Market Volume Billion Forecast, by Country 2020 & 2033
- Table 17: United States Shipbroking Market Revenue (Million) Forecast, by Application 2020 & 2033
- Table 18: United States Shipbroking Market Volume (Billion) Forecast, by Application 2020 & 2033
- Table 19: Canada Shipbroking Market Revenue (Million) Forecast, by Application 2020 & 2033
- Table 20: Canada Shipbroking Market Volume (Billion) Forecast, by Application 2020 & 2033
- Table 21: Rest of North America Shipbroking Market Revenue (Million) Forecast, by Application 2020 & 2033
- Table 22: Rest of North America Shipbroking Market Volume (Billion) Forecast, by Application 2020 & 2033
- Table 23: Global Shipbroking Market Revenue Million Forecast, by Type 2020 & 2033
- Table 24: Global Shipbroking Market Volume Billion Forecast, by Type 2020 & 2033
- Table 25: Global Shipbroking Market Revenue Million Forecast, by Service 2020 & 2033
- Table 26: Global Shipbroking Market Volume Billion Forecast, by Service 2020 & 2033
- Table 27: Global Shipbroking Market Revenue Million Forecast, by Industry 2020 & 2033
- Table 28: Global Shipbroking Market Volume Billion Forecast, by Industry 2020 & 2033
- Table 29: Global Shipbroking Market Revenue Million Forecast, by Country 2020 & 2033
- Table 30: Global Shipbroking Market Volume Billion Forecast, by Country 2020 & 2033
- Table 31: Germany Shipbroking Market Revenue (Million) Forecast, by Application 2020 & 2033
- Table 32: Germany Shipbroking Market Volume (Billion) Forecast, by Application 2020 & 2033
- Table 33: United Kingdom Shipbroking Market Revenue (Million) Forecast, by Application 2020 & 2033
- Table 34: United Kingdom Shipbroking Market Volume (Billion) Forecast, by Application 2020 & 2033
- Table 35: France Shipbroking Market Revenue (Million) Forecast, by Application 2020 & 2033
- Table 36: France Shipbroking Market Volume (Billion) Forecast, by Application 2020 & 2033
- Table 37: Russia Shipbroking Market Revenue (Million) Forecast, by Application 2020 & 2033
- Table 38: Russia Shipbroking Market Volume (Billion) Forecast, by Application 2020 & 2033
- Table 39: Spain Shipbroking Market Revenue (Million) Forecast, by Application 2020 & 2033
- Table 40: Spain Shipbroking Market Volume (Billion) Forecast, by Application 2020 & 2033
- Table 41: Rest of Europe Shipbroking Market Revenue (Million) Forecast, by Application 2020 & 2033
- Table 42: Rest of Europe Shipbroking Market Volume (Billion) Forecast, by Application 2020 & 2033
- Table 43: Global Shipbroking Market Revenue Million Forecast, by Type 2020 & 2033
- Table 44: Global Shipbroking Market Volume Billion Forecast, by Type 2020 & 2033
- Table 45: Global Shipbroking Market Revenue Million Forecast, by Service 2020 & 2033
- Table 46: Global Shipbroking Market Volume Billion Forecast, by Service 2020 & 2033
- Table 47: Global Shipbroking Market Revenue Million Forecast, by Industry 2020 & 2033
- Table 48: Global Shipbroking Market Volume Billion Forecast, by Industry 2020 & 2033
- Table 49: Global Shipbroking Market Revenue Million Forecast, by Country 2020 & 2033
- Table 50: Global Shipbroking Market Volume Billion Forecast, by Country 2020 & 2033
- Table 51: India Shipbroking Market Revenue (Million) Forecast, by Application 2020 & 2033
- Table 52: India Shipbroking Market Volume (Billion) Forecast, by Application 2020 & 2033
- Table 53: China Shipbroking Market Revenue (Million) Forecast, by Application 2020 & 2033
- Table 54: China Shipbroking Market Volume (Billion) Forecast, by Application 2020 & 2033
- Table 55: Japan Shipbroking Market Revenue (Million) Forecast, by Application 2020 & 2033
- Table 56: Japan Shipbroking Market Volume (Billion) Forecast, by Application 2020 & 2033
- Table 57: Rest of Asia Pacific Shipbroking Market Revenue (Million) Forecast, by Application 2020 & 2033
- Table 58: Rest of Asia Pacific Shipbroking Market Volume (Billion) Forecast, by Application 2020 & 2033
- Table 59: Global Shipbroking Market Revenue Million Forecast, by Type 2020 & 2033
- Table 60: Global Shipbroking Market Volume Billion Forecast, by Type 2020 & 2033
- Table 61: Global Shipbroking Market Revenue Million Forecast, by Service 2020 & 2033
- Table 62: Global Shipbroking Market Volume Billion Forecast, by Service 2020 & 2033
- Table 63: Global Shipbroking Market Revenue Million Forecast, by Industry 2020 & 2033
- Table 64: Global Shipbroking Market Volume Billion Forecast, by Industry 2020 & 2033
- Table 65: Global Shipbroking Market Revenue Million Forecast, by Country 2020 & 2033
- Table 66: Global Shipbroking Market Volume Billion Forecast, by Country 2020 & 2033
- Table 67: Brazil Shipbroking Market Revenue (Million) Forecast, by Application 2020 & 2033
- Table 68: Brazil Shipbroking Market Volume (Billion) Forecast, by Application 2020 & 2033
- Table 69: Argentina Shipbroking Market Revenue (Million) Forecast, by Application 2020 & 2033
- Table 70: Argentina Shipbroking Market Volume (Billion) Forecast, by Application 2020 & 2033
- Table 71: Rest of South America Shipbroking Market Revenue (Million) Forecast, by Application 2020 & 2033
- Table 72: Rest of South America Shipbroking Market Volume (Billion) Forecast, by Application 2020 & 2033
- Table 73: Global Shipbroking Market Revenue Million Forecast, by Type 2020 & 2033
- Table 74: Global Shipbroking Market Volume Billion Forecast, by Type 2020 & 2033
- Table 75: Global Shipbroking Market Revenue Million Forecast, by Service 2020 & 2033
- Table 76: Global Shipbroking Market Volume Billion Forecast, by Service 2020 & 2033
- Table 77: Global Shipbroking Market Revenue Million Forecast, by Industry 2020 & 2033
- Table 78: Global Shipbroking Market Volume Billion Forecast, by Industry 2020 & 2033
- Table 79: Global Shipbroking Market Revenue Million Forecast, by Country 2020 & 2033
- Table 80: Global Shipbroking Market Volume Billion Forecast, by Country 2020 & 2033
- Table 81: United Arab Emirates Shipbroking Market Revenue (Million) Forecast, by Application 2020 & 2033
- Table 82: United Arab Emirates Shipbroking Market Volume (Billion) Forecast, by Application 2020 & 2033
- Table 83: Saudi Arabia Shipbroking Market Revenue (Million) Forecast, by Application 2020 & 2033
- Table 84: Saudi Arabia Shipbroking Market Volume (Billion) Forecast, by Application 2020 & 2033
- Table 85: Rest of Middle East and Africa Shipbroking Market Revenue (Million) Forecast, by Application 2020 & 2033
- Table 86: Rest of Middle East and Africa Shipbroking Market Volume (Billion) Forecast, by Application 2020 & 2033
Frequently Asked Questions
1. What is the projected Compound Annual Growth Rate (CAGR) of the Shipbroking Market?
The projected CAGR is approximately 3.65%.
2. Which companies are prominent players in the Shipbroking Market?
Key companies in the market include Aries Shipbroking (Asia) Pte Ltd, BRS Group, Braemar Shipping Services PLC, Clarkson PLC, Howe Robinson Partners, Simpson Spense Young, Fearnleys A/S, ACM Shipping Group PLC, Chowgule Brothers Pvt Ltd, Affinity (Shipping) LLP**List Not Exhaustive.
3. What are the main segments of the Shipbroking Market?
The market segments include Type, Service, Industry.
4. Can you provide details about the market size?
The market size is estimated to be USD 1.49 Million as of 2022.
5. What are some drivers contributing to market growth?
Rise in Maritime Transport is Driving the Market; The Increasing Interconnectedness of Global Markets.
6. What are the notable trends driving market growth?
Rise in Oil and Gas Industry is Driving the Shipbroking Market.
7. Are there any restraints impacting market growth?
Rise in Maritime Transport is Driving the Market; The Increasing Interconnectedness of Global Markets.
8. Can you provide examples of recent developments in the market?
January 2024: The Danish shipping giant Maersk announced a significant long-term collaboration with its German counterpart, Hapag-Lloyd, consolidating hundreds of vessels under this partnership.September 2023: Global container liner shipping business ZIM Integrated Shipping Services Ltd signed a new operational collaboration agreement spanning many trades with MSC, the industry leader. This partnership is intended to improve service standards for ZIM's esteemed clientele and greatly increase operating efficiencies.
9. What pricing options are available for accessing the report?
Pricing options include single-user, multi-user, and enterprise licenses priced at USD 4750, USD 5250, and USD 8750 respectively.
10. Is the market size provided in terms of value or volume?
The market size is provided in terms of value, measured in Million and volume, measured in Billion.
11. Are there any specific market keywords associated with the report?
Yes, the market keyword associated with the report is "Shipbroking Market," which aids in identifying and referencing the specific market segment covered.
12. How do I determine which pricing option suits my needs best?
The pricing options vary based on user requirements and access needs. Individual users may opt for single-user licenses, while businesses requiring broader access may choose multi-user or enterprise licenses for cost-effective access to the report.
13. Are there any additional resources or data provided in the Shipbroking Market report?
While the report offers comprehensive insights, it's advisable to review the specific contents or supplementary materials provided to ascertain if additional resources or data are available.
14. How can I stay updated on further developments or reports in the Shipbroking Market?
To stay informed about further developments, trends, and reports in the Shipbroking Market, consider subscribing to industry newsletters, following relevant companies and organizations, or regularly checking reputable industry news sources and publications.
Methodology
Step 1 - Identification of Relevant Samples Size from Population Database


Step 2 - Approaches for Defining Global Market Size (Value, Volume* & Price*)

Note*: In applicable scenarios
Step 3 - Data Sources
Primary Research
- Web Analytics
- Survey Reports
- Research Institute
- Latest Research Reports
- Opinion Leaders
Secondary Research
- Annual Reports
- White Paper
- Latest Press Release
- Industry Association
- Paid Database
- Investor Presentations

Step 4 - Data Triangulation
Involves using different sources of information in order to increase the validity of a study
These sources are likely to be stakeholders in a program - participants, other researchers, program staff, other community members, and so on.
Then we put all data in single framework & apply various statistical tools to find out the dynamic on the market.
During the analysis stage, feedback from the stakeholder groups would be compared to determine areas of agreement as well as areas of divergence