
Key Insights
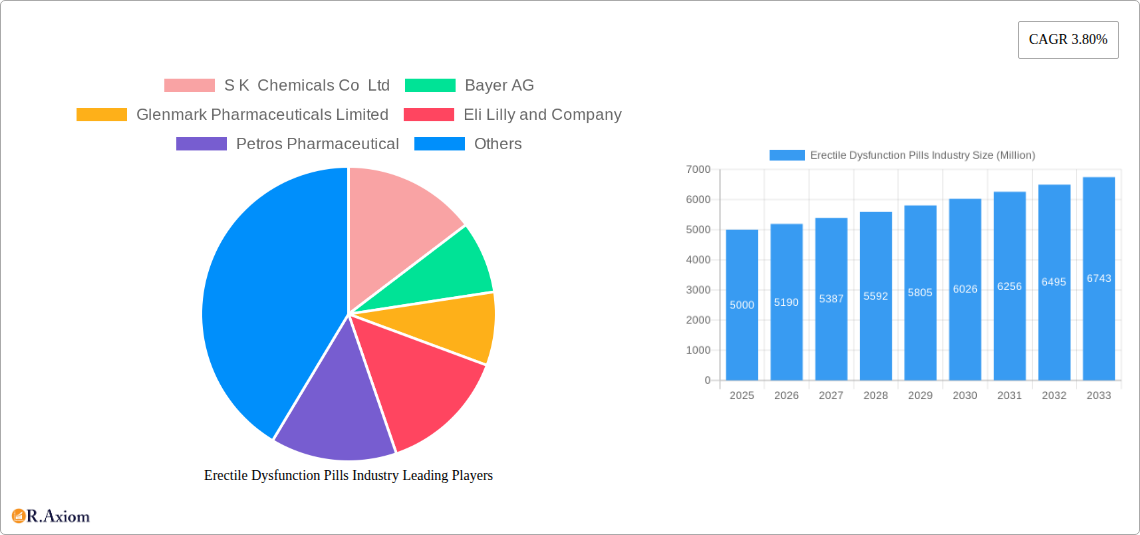
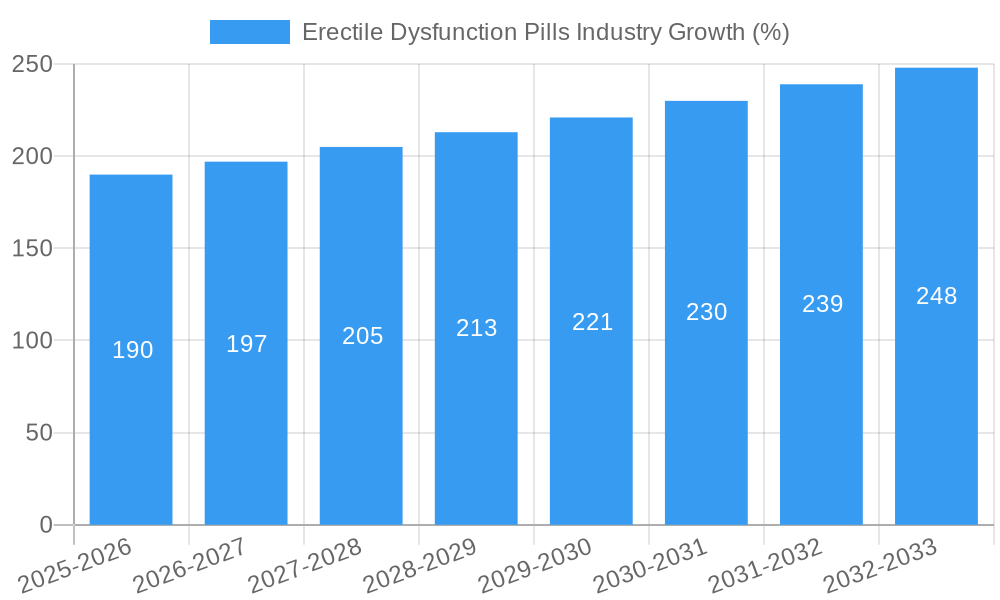
The global erectile dysfunction (ED) pills market, valued at approximately $5 billion in 2025, is projected to experience steady growth, driven by a rising prevalence of ED, particularly among aging populations worldwide. The 3.80% CAGR suggests a market size exceeding $6 billion by 2033. Several factors contribute to this growth. Increased awareness of ED and improved access to healthcare, especially in developing economies, are leading to higher diagnosis rates and treatment adoption. Furthermore, the ongoing development of new formulations, including those focusing on improved efficacy, reduced side effects, and enhanced convenience, is fueling market expansion. The market is segmented by product type, with Viagra (sildenafil citrate), Cialis (tadalafil), and Levitra/Staxyn (vardenafil) holding significant market shares due to their established brand recognition and long-standing presence. However, newer entrants like Stendra/Spedra (avanafil) are gaining traction, driven by innovative features. Distribution channels are varied, including hospital pharmacies, retail pharmacies, and the increasingly popular online pharmacies. The latter contributes to market growth through enhanced accessibility and discreet purchasing options. Competition among major pharmaceutical companies like Pfizer, Eli Lilly, and Bayer drives innovation and pricing strategies, shaping the overall market dynamics. Geographic growth is expected to be strongest in Asia-Pacific regions, fueled by increasing awareness and rising disposable incomes.
Despite the positive outlook, certain restraints exist. High drug prices, particularly in regions with limited healthcare coverage, pose a barrier to access. The potential for side effects associated with some ED medications also presents a challenge. Regulatory hurdles and the need for extensive clinical trials can impede the introduction of new products. Nevertheless, the overall market trend indicates continued expansion, particularly with ongoing innovation in drug delivery systems and the development of therapies targeting underlying causes of ED beyond symptomatic relief. The focus will likely shift towards personalized medicine, tailoring treatment based on individual patient characteristics and needs. Furthermore, ongoing research into alternative therapies, such as lifestyle modifications and non-pharmaceutical interventions, will also influence market growth and shape future opportunities.
Erectile Dysfunction Pills Industry: A Comprehensive Market Report (2019-2033)
This comprehensive report provides an in-depth analysis of the Erectile Dysfunction Pills industry, encompassing market size, growth drivers, competitive landscape, and future projections from 2019 to 2033. The study period covers the historical period (2019-2024), the base year (2025), and the forecast period (2025-2033). The report is essential for industry stakeholders, investors, and researchers seeking a thorough understanding of this dynamic market. The estimated market value in 2025 is xx Million.
Erectile Dysfunction Pills Industry Market Concentration & Innovation
This section analyzes the market concentration, innovation drivers, regulatory landscape, product substitutes, end-user trends, and mergers & acquisitions (M&A) activities within the erectile dysfunction pills market. The market exhibits a moderately concentrated structure, with a few key players holding significant market share. Pfizer Inc. and Eli Lilly and Company, with their flagship products Viagra and Cialis respectively, are currently leading the market, holding a combined market share estimated at xx%. Other major players include Bayer AG, Teva Pharmaceutical Industries Ltd, and several emerging companies focusing on innovative delivery methods or new chemical entities.
- Market Concentration: The Herfindahl-Hirschman Index (HHI) for the market is estimated at xx, indicating a moderately concentrated market.
- Innovation Drivers: The primary drivers of innovation include the development of novel drug delivery systems (e.g., sublingual formulations), the exploration of new chemical entities targeting different pathways, and the growing focus on personalized medicine approaches.
- Regulatory Framework: Stringent regulatory approvals and post-market surveillance create significant barriers to entry for new players. However, clear guidelines promote consistent product quality and patient safety.
- Product Substitutes: Alternative treatments such as penile implants, vacuum erection devices, and injections are available, although oral medications remain the dominant choice.
- End-User Trends: Increasing awareness about erectile dysfunction and improved access to healthcare are fueling market growth, particularly in emerging economies.
- M&A Activity: The last 5 years witnessed several strategic M&A deals valued at a cumulative xx Million, primarily aimed at expanding product portfolios and enhancing market presence. Examples include [mention specific M&A deals if available, otherwise, state "specific deal information is not publicly available for this report"].
Erectile Dysfunction Pills Industry Industry Trends & Insights
The global erectile dysfunction pills market is experiencing robust growth, driven by a rising prevalence of erectile dysfunction, increasing awareness of treatment options, and the expanding geriatric population. The market is projected to witness a Compound Annual Growth Rate (CAGR) of xx% during the forecast period (2025-2033). Market penetration is increasing gradually due to heightened awareness campaigns and improved access to healthcare services. Technological advancements in drug delivery systems and the emergence of novel therapeutic agents are also contributing to market expansion.
Consumer preferences are shifting towards convenient and discreet treatment options, such as online pharmacies and home delivery services. The competitive dynamics are intense, with established players investing heavily in R&D to maintain their market share and new entrants focusing on innovative product offerings and niche market segments. Generic competition has also emerged as a significant factor influencing pricing and market share. The continued emphasis on patient education and improved diagnosis techniques is expected to further propel market growth. This necessitates companies to innovate and develop personalized treatment approaches to address the specific needs of diverse patient populations.
Dominant Markets & Segments in Erectile Dysfunction Pills Industry
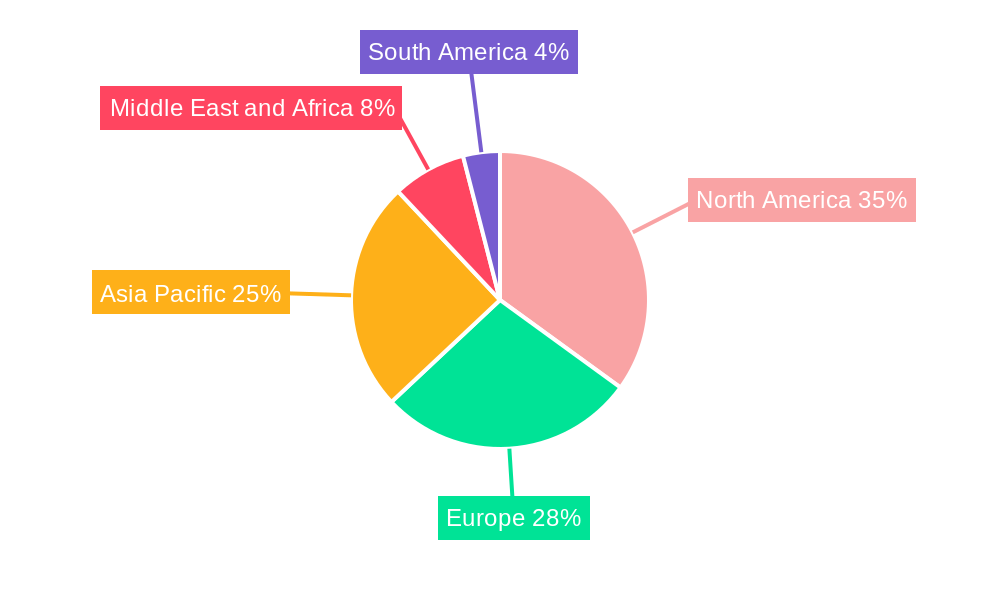
The North American market currently holds the largest share of the global erectile dysfunction pills market, driven by high healthcare expenditure, strong regulatory frameworks, and increased awareness among consumers. Within this region, the United States represents the most dominant market. Within the European market, Western European countries show higher adoption rates compared to Eastern European countries, mainly attributed to differences in healthcare access and economic factors.
- Product Segmentation: Viagra (sildenafil citrate) and Cialis (tadalafil) remain the dominant products, representing a significant portion of the market share. However, the increasing availability of generics and the emergence of new products like Stendra (avanafil) are impacting the competitive landscape. The "other products" segment, encompassing various formulations and treatments, showcases significant growth potential.
- Distribution Channel Segmentation: Retail pharmacies currently constitute the primary distribution channel, although online pharmacies are rapidly gaining traction due to convenience and privacy. Hospital pharmacies play a less significant role compared to retail and online channels.
Key Drivers of Regional Dominance:
- North America: High per capita income, favorable healthcare infrastructure, and greater awareness of ED treatment.
- Europe: Well-established healthcare systems, increasing prevalence of ED, and favorable regulatory environment.
- Asia Pacific: Rapidly growing geriatric population and increasing disposable incomes.
Erectile Dysfunction Pills Industry Product Developments
Recent product innovations have focused on enhancing efficacy, improving tolerability, and developing novel drug delivery systems. This includes the introduction of sublingual formulations for faster onset of action, and the exploration of alternative therapies targeting specific ED causes. Companies are also focusing on developing personalized treatment strategies to address individual patient needs. The market is witnessing the evolution of therapies beyond PDE5 inhibitors, reflecting the increasing sophistication in understanding and managing erectile dysfunction.
Report Scope & Segmentation Analysis
This report segments the erectile dysfunction pills market by product (Viagra, Cialis, Levitra/Staxyn, Stendra/Spedra, Zydena, Vitaros, and Other Products) and distribution channel (Hospital Pharmacies, Retail Pharmacies, and Online Pharmacies). Each segment's growth projections, market size, and competitive dynamics are analyzed to provide a comprehensive understanding of the market. Growth rates for each segment vary, with the online pharmacy segment expected to demonstrate the most significant growth over the forecast period.
Product Segment Growth: The Viagra segment is expected to experience a CAGR of xx%, while the Cialis segment is projected to show a CAGR of xx%. The "Other Products" category is anticipated to experience the highest CAGR, driven by the introduction of newer treatment modalities.
Distribution Channel Segment Growth: The online pharmacy segment is forecast to grow at a significantly higher rate compared to traditional retail and hospital pharmacies.
Key Drivers of Erectile Dysfunction Pills Industry Growth
The erectile dysfunction pills market is experiencing growth fueled by several factors: the increasing prevalence of erectile dysfunction amongst the aging population; rising awareness about available treatment options, including the increase in advertising and education campaigns; improved access to healthcare services worldwide; and continued research and development leading to newer treatment options. The expanding geriatric population, particularly in developed economies, is a significant driver of market expansion.
Challenges in the Erectile Dysfunction Pills Industry Sector
The erectile dysfunction pills market faces challenges including stringent regulatory approvals for new drug entities; potential side effects associated with existing medications; the emergence of generic competition impacting pricing and profitability; and supply chain disruptions impacting the availability of raw materials and finished products. These factors collectively impact the market's overall growth trajectory and present significant obstacles for manufacturers and distributors. The cost of R&D remains a substantial barrier to entry for new players.
Emerging Opportunities in Erectile Dysfunction Pills Industry
Emerging opportunities include the development of novel drug delivery systems; personalized medicine approaches tailored to individual patient needs; the exploration of alternative therapies targeting various ED causes; and expansion into untapped markets, particularly in emerging economies. The increasing acceptance and adoption of telemedicine also present a considerable growth opportunity.
Leading Players in the Erectile Dysfunction Pills Industry Market
- S K Chemicals Co Ltd
- Bayer AG
- Glenmark Pharmaceuticals Limited
- Eli Lilly and Company
- Petros Pharmaceutical
- Teva Pharmaceutical Industries Ltd
- Apricus Biosciences Inc
- Cipla Ltd
- Lupin Limited
- VIVUS Inc
- GlaxoSmithKline PLC
- Pfizer Inc
Key Developments in Erectile Dysfunction Pills Industry Industry
- September 2021: iX Biopharma secured an agreement with CRPCG for the licensing, supply, and distribution of Wafesil in China. This signifies a strategic expansion into a significant market.
- September 2021: Almus launched Almus Erectile Dysfunction Relief 50mg Film-Coated Tablets in the UK, expanding product availability and competition in the market.
Strategic Outlook for Erectile Dysfunction Pills Industry Market
The erectile dysfunction pills market exhibits considerable future potential, driven by continued technological advancements, growing awareness, and an expanding target population. The focus on innovative drug delivery mechanisms, personalized medicine, and expanding into emerging markets will shape the industry's trajectory. The continued growth of the aging population globally ensures sustained demand for effective and convenient treatment options. Further, the emergence of new therapeutic targets and personalized treatment modalities will create additional avenues for growth and innovation within the market.
Erectile Dysfunction Pills Industry Segmentation
-
1. Product
- 1.1. Viagra (sildenafil citrate)
- 1.2. Cialis (Tadalafil)
- 1.3. Levitra/Staxyn (vardenafil)
- 1.4. Stendra/Spedra (avanafil)
- 1.5. Zydena (udenafil)
- 1.6. Vitaros (Alprostadil Cream)
- 1.7. Other Products
-
2. Distribution Channel
- 2.1. Hospital Pharmacies
- 2.2. Retail Pharmacies
- 2.3. Online Pharmacies
Erectile Dysfunction Pills Industry Segmentation By Geography
-
1. North America
- 1.1. United States
- 1.2. Canada
- 1.3. Mexico
-
2. Europe
- 2.1. Germany
- 2.2. United Kingdom
- 2.3. France
- 2.4. Italy
- 2.5. Spain
- 2.6. Rest of Europe
-
3. Asia Pacific
- 3.1. China
- 3.2. Japan
- 3.3. India
- 3.4. Australia
- 3.5. South Korea
- 3.6. Rest of Asia Pacific
-
4. Middle East and Africa
- 4.1. GCC
- 4.2. South Africa
- 4.3. Rest of Middle East and Africa
-
5. South America
- 5.1. Brazil
- 5.2. Argentina
- 5.3. Rest of South America
Erectile Dysfunction Pills Industry REPORT HIGHLIGHTS
| Aspects | Details |
|---|---|
| Study Period | 2019-2033 |
| Base Year | 2024 |
| Estimated Year | 2025 |
| Forecast Period | 2025-2033 |
| Historical Period | 2019-2024 |
| Growth Rate | CAGR of 3.80% from 2019-2033 |
| Segmentation |
|
Table of Contents
- 1. Introduction
- 1.1. Research Scope
- 1.2. Market Segmentation
- 1.3. Research Methodology
- 1.4. Definitions and Assumptions
- 2. Executive Summary
- 2.1. Introduction
- 3. Market Dynamics
- 3.1. Introduction
- 3.2. Market Drivers
- 3.2.1. Rising Adoption of a Sedentary Lifestyle Along with the Associated Stress; Rising Geriatric Population; Comorbidity between Erectile Dysfunction and Heart Diseases and Diabetes
- 3.3. Market Restrains
- 3.3.1. Reluctance of Patients to Seek Treatment; Poor Patient Adherence to ED Drugs
- 3.4. Market Trends
- 3.4.1. The Viagra (sildenafil citrate) Segment is Expected to Dominate the Market
- 4. Market Factor Analysis
- 4.1. Porters Five Forces
- 4.2. Supply/Value Chain
- 4.3. PESTEL analysis
- 4.4. Market Entropy
- 4.5. Patent/Trademark Analysis
- 5. Global Erectile Dysfunction Pills Industry Analysis, Insights and Forecast, 2019-2031
- 5.1. Market Analysis, Insights and Forecast - by Product
- 5.1.1. Viagra (sildenafil citrate)
- 5.1.2. Cialis (Tadalafil)
- 5.1.3. Levitra/Staxyn (vardenafil)
- 5.1.4. Stendra/Spedra (avanafil)
- 5.1.5. Zydena (udenafil)
- 5.1.6. Vitaros (Alprostadil Cream)
- 5.1.7. Other Products
- 5.2. Market Analysis, Insights and Forecast - by Distribution Channel
- 5.2.1. Hospital Pharmacies
- 5.2.2. Retail Pharmacies
- 5.2.3. Online Pharmacies
- 5.3. Market Analysis, Insights and Forecast - by Region
- 5.3.1. North America
- 5.3.2. Europe
- 5.3.3. Asia Pacific
- 5.3.4. Middle East and Africa
- 5.3.5. South America
- 5.1. Market Analysis, Insights and Forecast - by Product
- 6. North America Erectile Dysfunction Pills Industry Analysis, Insights and Forecast, 2019-2031
- 6.1. Market Analysis, Insights and Forecast - by Product
- 6.1.1. Viagra (sildenafil citrate)
- 6.1.2. Cialis (Tadalafil)
- 6.1.3. Levitra/Staxyn (vardenafil)
- 6.1.4. Stendra/Spedra (avanafil)
- 6.1.5. Zydena (udenafil)
- 6.1.6. Vitaros (Alprostadil Cream)
- 6.1.7. Other Products
- 6.2. Market Analysis, Insights and Forecast - by Distribution Channel
- 6.2.1. Hospital Pharmacies
- 6.2.2. Retail Pharmacies
- 6.2.3. Online Pharmacies
- 6.1. Market Analysis, Insights and Forecast - by Product
- 7. Europe Erectile Dysfunction Pills Industry Analysis, Insights and Forecast, 2019-2031
- 7.1. Market Analysis, Insights and Forecast - by Product
- 7.1.1. Viagra (sildenafil citrate)
- 7.1.2. Cialis (Tadalafil)
- 7.1.3. Levitra/Staxyn (vardenafil)
- 7.1.4. Stendra/Spedra (avanafil)
- 7.1.5. Zydena (udenafil)
- 7.1.6. Vitaros (Alprostadil Cream)
- 7.1.7. Other Products
- 7.2. Market Analysis, Insights and Forecast - by Distribution Channel
- 7.2.1. Hospital Pharmacies
- 7.2.2. Retail Pharmacies
- 7.2.3. Online Pharmacies
- 7.1. Market Analysis, Insights and Forecast - by Product
- 8. Asia Pacific Erectile Dysfunction Pills Industry Analysis, Insights and Forecast, 2019-2031
- 8.1. Market Analysis, Insights and Forecast - by Product
- 8.1.1. Viagra (sildenafil citrate)
- 8.1.2. Cialis (Tadalafil)
- 8.1.3. Levitra/Staxyn (vardenafil)
- 8.1.4. Stendra/Spedra (avanafil)
- 8.1.5. Zydena (udenafil)
- 8.1.6. Vitaros (Alprostadil Cream)
- 8.1.7. Other Products
- 8.2. Market Analysis, Insights and Forecast - by Distribution Channel
- 8.2.1. Hospital Pharmacies
- 8.2.2. Retail Pharmacies
- 8.2.3. Online Pharmacies
- 8.1. Market Analysis, Insights and Forecast - by Product
- 9. Middle East and Africa Erectile Dysfunction Pills Industry Analysis, Insights and Forecast, 2019-2031
- 9.1. Market Analysis, Insights and Forecast - by Product
- 9.1.1. Viagra (sildenafil citrate)
- 9.1.2. Cialis (Tadalafil)
- 9.1.3. Levitra/Staxyn (vardenafil)
- 9.1.4. Stendra/Spedra (avanafil)
- 9.1.5. Zydena (udenafil)
- 9.1.6. Vitaros (Alprostadil Cream)
- 9.1.7. Other Products
- 9.2. Market Analysis, Insights and Forecast - by Distribution Channel
- 9.2.1. Hospital Pharmacies
- 9.2.2. Retail Pharmacies
- 9.2.3. Online Pharmacies
- 9.1. Market Analysis, Insights and Forecast - by Product
- 10. South America Erectile Dysfunction Pills Industry Analysis, Insights and Forecast, 2019-2031
- 10.1. Market Analysis, Insights and Forecast - by Product
- 10.1.1. Viagra (sildenafil citrate)
- 10.1.2. Cialis (Tadalafil)
- 10.1.3. Levitra/Staxyn (vardenafil)
- 10.1.4. Stendra/Spedra (avanafil)
- 10.1.5. Zydena (udenafil)
- 10.1.6. Vitaros (Alprostadil Cream)
- 10.1.7. Other Products
- 10.2. Market Analysis, Insights and Forecast - by Distribution Channel
- 10.2.1. Hospital Pharmacies
- 10.2.2. Retail Pharmacies
- 10.2.3. Online Pharmacies
- 10.1. Market Analysis, Insights and Forecast - by Product
- 11. North America Erectile Dysfunction Pills Industry Analysis, Insights and Forecast, 2019-2031
- 11.1. Market Analysis, Insights and Forecast - By Country/Sub-region
- 11.1.1 United States
- 11.1.2 Canada
- 11.1.3 Mexico
- 12. Europe Erectile Dysfunction Pills Industry Analysis, Insights and Forecast, 2019-2031
- 12.1. Market Analysis, Insights and Forecast - By Country/Sub-region
- 12.1.1 Germany
- 12.1.2 United Kingdom
- 12.1.3 France
- 12.1.4 Italy
- 12.1.5 Spain
- 12.1.6 Rest of Europe
- 13. Asia Pacific Erectile Dysfunction Pills Industry Analysis, Insights and Forecast, 2019-2031
- 13.1. Market Analysis, Insights and Forecast - By Country/Sub-region
- 13.1.1 China
- 13.1.2 Japan
- 13.1.3 India
- 13.1.4 Australia
- 13.1.5 South Korea
- 13.1.6 Rest of Asia Pacific
- 14. Middle East and Africa Erectile Dysfunction Pills Industry Analysis, Insights and Forecast, 2019-2031
- 14.1. Market Analysis, Insights and Forecast - By Country/Sub-region
- 14.1.1 GCC
- 14.1.2 South Africa
- 14.1.3 Rest of Middle East and Africa
- 15. South America Erectile Dysfunction Pills Industry Analysis, Insights and Forecast, 2019-2031
- 15.1. Market Analysis, Insights and Forecast - By Country/Sub-region
- 15.1.1 Brazil
- 15.1.2 Argentina
- 15.1.3 Rest of South America
- 16. Competitive Analysis
- 16.1. Global Market Share Analysis 2024
- 16.2. Company Profiles
- 16.2.1 S K Chemicals Co Ltd
- 16.2.1.1. Overview
- 16.2.1.2. Products
- 16.2.1.3. SWOT Analysis
- 16.2.1.4. Recent Developments
- 16.2.1.5. Financials (Based on Availability)
- 16.2.2 Bayer AG
- 16.2.2.1. Overview
- 16.2.2.2. Products
- 16.2.2.3. SWOT Analysis
- 16.2.2.4. Recent Developments
- 16.2.2.5. Financials (Based on Availability)
- 16.2.3 Glenmark Pharmaceuticals Limited
- 16.2.3.1. Overview
- 16.2.3.2. Products
- 16.2.3.3. SWOT Analysis
- 16.2.3.4. Recent Developments
- 16.2.3.5. Financials (Based on Availability)
- 16.2.4 Eli Lilly and Company
- 16.2.4.1. Overview
- 16.2.4.2. Products
- 16.2.4.3. SWOT Analysis
- 16.2.4.4. Recent Developments
- 16.2.4.5. Financials (Based on Availability)
- 16.2.5 Petros Pharmaceutical
- 16.2.5.1. Overview
- 16.2.5.2. Products
- 16.2.5.3. SWOT Analysis
- 16.2.5.4. Recent Developments
- 16.2.5.5. Financials (Based on Availability)
- 16.2.6 Teva Pharmaceutical Industries Ltd
- 16.2.6.1. Overview
- 16.2.6.2. Products
- 16.2.6.3. SWOT Analysis
- 16.2.6.4. Recent Developments
- 16.2.6.5. Financials (Based on Availability)
- 16.2.7 Apricus Biosciences Inc
- 16.2.7.1. Overview
- 16.2.7.2. Products
- 16.2.7.3. SWOT Analysis
- 16.2.7.4. Recent Developments
- 16.2.7.5. Financials (Based on Availability)
- 16.2.8 Cipla Ltd
- 16.2.8.1. Overview
- 16.2.8.2. Products
- 16.2.8.3. SWOT Analysis
- 16.2.8.4. Recent Developments
- 16.2.8.5. Financials (Based on Availability)
- 16.2.9 Lupin Limited
- 16.2.9.1. Overview
- 16.2.9.2. Products
- 16.2.9.3. SWOT Analysis
- 16.2.9.4. Recent Developments
- 16.2.9.5. Financials (Based on Availability)
- 16.2.10 VIVUS Inc
- 16.2.10.1. Overview
- 16.2.10.2. Products
- 16.2.10.3. SWOT Analysis
- 16.2.10.4. Recent Developments
- 16.2.10.5. Financials (Based on Availability)
- 16.2.11 GlaxoSmithKline PLC
- 16.2.11.1. Overview
- 16.2.11.2. Products
- 16.2.11.3. SWOT Analysis
- 16.2.11.4. Recent Developments
- 16.2.11.5. Financials (Based on Availability)
- 16.2.12 Pfizer Inc
- 16.2.12.1. Overview
- 16.2.12.2. Products
- 16.2.12.3. SWOT Analysis
- 16.2.12.4. Recent Developments
- 16.2.12.5. Financials (Based on Availability)
- 16.2.1 S K Chemicals Co Ltd
List of Figures
- Figure 1: Global Erectile Dysfunction Pills Industry Revenue Breakdown (Million, %) by Region 2024 & 2032
- Figure 2: Global Erectile Dysfunction Pills Industry Volume Breakdown (K Unit, %) by Region 2024 & 2032
- Figure 3: North America Erectile Dysfunction Pills Industry Revenue (Million), by Country 2024 & 2032
- Figure 4: North America Erectile Dysfunction Pills Industry Volume (K Unit), by Country 2024 & 2032
- Figure 5: North America Erectile Dysfunction Pills Industry Revenue Share (%), by Country 2024 & 2032
- Figure 6: North America Erectile Dysfunction Pills Industry Volume Share (%), by Country 2024 & 2032
- Figure 7: Europe Erectile Dysfunction Pills Industry Revenue (Million), by Country 2024 & 2032
- Figure 8: Europe Erectile Dysfunction Pills Industry Volume (K Unit), by Country 2024 & 2032
- Figure 9: Europe Erectile Dysfunction Pills Industry Revenue Share (%), by Country 2024 & 2032
- Figure 10: Europe Erectile Dysfunction Pills Industry Volume Share (%), by Country 2024 & 2032
- Figure 11: Asia Pacific Erectile Dysfunction Pills Industry Revenue (Million), by Country 2024 & 2032
- Figure 12: Asia Pacific Erectile Dysfunction Pills Industry Volume (K Unit), by Country 2024 & 2032
- Figure 13: Asia Pacific Erectile Dysfunction Pills Industry Revenue Share (%), by Country 2024 & 2032
- Figure 14: Asia Pacific Erectile Dysfunction Pills Industry Volume Share (%), by Country 2024 & 2032
- Figure 15: Middle East and Africa Erectile Dysfunction Pills Industry Revenue (Million), by Country 2024 & 2032
- Figure 16: Middle East and Africa Erectile Dysfunction Pills Industry Volume (K Unit), by Country 2024 & 2032
- Figure 17: Middle East and Africa Erectile Dysfunction Pills Industry Revenue Share (%), by Country 2024 & 2032
- Figure 18: Middle East and Africa Erectile Dysfunction Pills Industry Volume Share (%), by Country 2024 & 2032
- Figure 19: South America Erectile Dysfunction Pills Industry Revenue (Million), by Country 2024 & 2032
- Figure 20: South America Erectile Dysfunction Pills Industry Volume (K Unit), by Country 2024 & 2032
- Figure 21: South America Erectile Dysfunction Pills Industry Revenue Share (%), by Country 2024 & 2032
- Figure 22: South America Erectile Dysfunction Pills Industry Volume Share (%), by Country 2024 & 2032
- Figure 23: North America Erectile Dysfunction Pills Industry Revenue (Million), by Product 2024 & 2032
- Figure 24: North America Erectile Dysfunction Pills Industry Volume (K Unit), by Product 2024 & 2032
- Figure 25: North America Erectile Dysfunction Pills Industry Revenue Share (%), by Product 2024 & 2032
- Figure 26: North America Erectile Dysfunction Pills Industry Volume Share (%), by Product 2024 & 2032
- Figure 27: North America Erectile Dysfunction Pills Industry Revenue (Million), by Distribution Channel 2024 & 2032
- Figure 28: North America Erectile Dysfunction Pills Industry Volume (K Unit), by Distribution Channel 2024 & 2032
- Figure 29: North America Erectile Dysfunction Pills Industry Revenue Share (%), by Distribution Channel 2024 & 2032
- Figure 30: North America Erectile Dysfunction Pills Industry Volume Share (%), by Distribution Channel 2024 & 2032
- Figure 31: North America Erectile Dysfunction Pills Industry Revenue (Million), by Country 2024 & 2032
- Figure 32: North America Erectile Dysfunction Pills Industry Volume (K Unit), by Country 2024 & 2032
- Figure 33: North America Erectile Dysfunction Pills Industry Revenue Share (%), by Country 2024 & 2032
- Figure 34: North America Erectile Dysfunction Pills Industry Volume Share (%), by Country 2024 & 2032
- Figure 35: Europe Erectile Dysfunction Pills Industry Revenue (Million), by Product 2024 & 2032
- Figure 36: Europe Erectile Dysfunction Pills Industry Volume (K Unit), by Product 2024 & 2032
- Figure 37: Europe Erectile Dysfunction Pills Industry Revenue Share (%), by Product 2024 & 2032
- Figure 38: Europe Erectile Dysfunction Pills Industry Volume Share (%), by Product 2024 & 2032
- Figure 39: Europe Erectile Dysfunction Pills Industry Revenue (Million), by Distribution Channel 2024 & 2032
- Figure 40: Europe Erectile Dysfunction Pills Industry Volume (K Unit), by Distribution Channel 2024 & 2032
- Figure 41: Europe Erectile Dysfunction Pills Industry Revenue Share (%), by Distribution Channel 2024 & 2032
- Figure 42: Europe Erectile Dysfunction Pills Industry Volume Share (%), by Distribution Channel 2024 & 2032
- Figure 43: Europe Erectile Dysfunction Pills Industry Revenue (Million), by Country 2024 & 2032
- Figure 44: Europe Erectile Dysfunction Pills Industry Volume (K Unit), by Country 2024 & 2032
- Figure 45: Europe Erectile Dysfunction Pills Industry Revenue Share (%), by Country 2024 & 2032
- Figure 46: Europe Erectile Dysfunction Pills Industry Volume Share (%), by Country 2024 & 2032
- Figure 47: Asia Pacific Erectile Dysfunction Pills Industry Revenue (Million), by Product 2024 & 2032
- Figure 48: Asia Pacific Erectile Dysfunction Pills Industry Volume (K Unit), by Product 2024 & 2032
- Figure 49: Asia Pacific Erectile Dysfunction Pills Industry Revenue Share (%), by Product 2024 & 2032
- Figure 50: Asia Pacific Erectile Dysfunction Pills Industry Volume Share (%), by Product 2024 & 2032
- Figure 51: Asia Pacific Erectile Dysfunction Pills Industry Revenue (Million), by Distribution Channel 2024 & 2032
- Figure 52: Asia Pacific Erectile Dysfunction Pills Industry Volume (K Unit), by Distribution Channel 2024 & 2032
- Figure 53: Asia Pacific Erectile Dysfunction Pills Industry Revenue Share (%), by Distribution Channel 2024 & 2032
- Figure 54: Asia Pacific Erectile Dysfunction Pills Industry Volume Share (%), by Distribution Channel 2024 & 2032
- Figure 55: Asia Pacific Erectile Dysfunction Pills Industry Revenue (Million), by Country 2024 & 2032
- Figure 56: Asia Pacific Erectile Dysfunction Pills Industry Volume (K Unit), by Country 2024 & 2032
- Figure 57: Asia Pacific Erectile Dysfunction Pills Industry Revenue Share (%), by Country 2024 & 2032
- Figure 58: Asia Pacific Erectile Dysfunction Pills Industry Volume Share (%), by Country 2024 & 2032
- Figure 59: Middle East and Africa Erectile Dysfunction Pills Industry Revenue (Million), by Product 2024 & 2032
- Figure 60: Middle East and Africa Erectile Dysfunction Pills Industry Volume (K Unit), by Product 2024 & 2032
- Figure 61: Middle East and Africa Erectile Dysfunction Pills Industry Revenue Share (%), by Product 2024 & 2032
- Figure 62: Middle East and Africa Erectile Dysfunction Pills Industry Volume Share (%), by Product 2024 & 2032
- Figure 63: Middle East and Africa Erectile Dysfunction Pills Industry Revenue (Million), by Distribution Channel 2024 & 2032
- Figure 64: Middle East and Africa Erectile Dysfunction Pills Industry Volume (K Unit), by Distribution Channel 2024 & 2032
- Figure 65: Middle East and Africa Erectile Dysfunction Pills Industry Revenue Share (%), by Distribution Channel 2024 & 2032
- Figure 66: Middle East and Africa Erectile Dysfunction Pills Industry Volume Share (%), by Distribution Channel 2024 & 2032
- Figure 67: Middle East and Africa Erectile Dysfunction Pills Industry Revenue (Million), by Country 2024 & 2032
- Figure 68: Middle East and Africa Erectile Dysfunction Pills Industry Volume (K Unit), by Country 2024 & 2032
- Figure 69: Middle East and Africa Erectile Dysfunction Pills Industry Revenue Share (%), by Country 2024 & 2032
- Figure 70: Middle East and Africa Erectile Dysfunction Pills Industry Volume Share (%), by Country 2024 & 2032
- Figure 71: South America Erectile Dysfunction Pills Industry Revenue (Million), by Product 2024 & 2032
- Figure 72: South America Erectile Dysfunction Pills Industry Volume (K Unit), by Product 2024 & 2032
- Figure 73: South America Erectile Dysfunction Pills Industry Revenue Share (%), by Product 2024 & 2032
- Figure 74: South America Erectile Dysfunction Pills Industry Volume Share (%), by Product 2024 & 2032
- Figure 75: South America Erectile Dysfunction Pills Industry Revenue (Million), by Distribution Channel 2024 & 2032
- Figure 76: South America Erectile Dysfunction Pills Industry Volume (K Unit), by Distribution Channel 2024 & 2032
- Figure 77: South America Erectile Dysfunction Pills Industry Revenue Share (%), by Distribution Channel 2024 & 2032
- Figure 78: South America Erectile Dysfunction Pills Industry Volume Share (%), by Distribution Channel 2024 & 2032
- Figure 79: South America Erectile Dysfunction Pills Industry Revenue (Million), by Country 2024 & 2032
- Figure 80: South America Erectile Dysfunction Pills Industry Volume (K Unit), by Country 2024 & 2032
- Figure 81: South America Erectile Dysfunction Pills Industry Revenue Share (%), by Country 2024 & 2032
- Figure 82: South America Erectile Dysfunction Pills Industry Volume Share (%), by Country 2024 & 2032
List of Tables
- Table 1: Global Erectile Dysfunction Pills Industry Revenue Million Forecast, by Region 2019 & 2032
- Table 2: Global Erectile Dysfunction Pills Industry Volume K Unit Forecast, by Region 2019 & 2032
- Table 3: Global Erectile Dysfunction Pills Industry Revenue Million Forecast, by Product 2019 & 2032
- Table 4: Global Erectile Dysfunction Pills Industry Volume K Unit Forecast, by Product 2019 & 2032
- Table 5: Global Erectile Dysfunction Pills Industry Revenue Million Forecast, by Distribution Channel 2019 & 2032
- Table 6: Global Erectile Dysfunction Pills Industry Volume K Unit Forecast, by Distribution Channel 2019 & 2032
- Table 7: Global Erectile Dysfunction Pills Industry Revenue Million Forecast, by Region 2019 & 2032
- Table 8: Global Erectile Dysfunction Pills Industry Volume K Unit Forecast, by Region 2019 & 2032
- Table 9: Global Erectile Dysfunction Pills Industry Revenue Million Forecast, by Country 2019 & 2032
- Table 10: Global Erectile Dysfunction Pills Industry Volume K Unit Forecast, by Country 2019 & 2032
- Table 11: United States Erectile Dysfunction Pills Industry Revenue (Million) Forecast, by Application 2019 & 2032
- Table 12: United States Erectile Dysfunction Pills Industry Volume (K Unit) Forecast, by Application 2019 & 2032
- Table 13: Canada Erectile Dysfunction Pills Industry Revenue (Million) Forecast, by Application 2019 & 2032
- Table 14: Canada Erectile Dysfunction Pills Industry Volume (K Unit) Forecast, by Application 2019 & 2032
- Table 15: Mexico Erectile Dysfunction Pills Industry Revenue (Million) Forecast, by Application 2019 & 2032
- Table 16: Mexico Erectile Dysfunction Pills Industry Volume (K Unit) Forecast, by Application 2019 & 2032
- Table 17: Global Erectile Dysfunction Pills Industry Revenue Million Forecast, by Country 2019 & 2032
- Table 18: Global Erectile Dysfunction Pills Industry Volume K Unit Forecast, by Country 2019 & 2032
- Table 19: Germany Erectile Dysfunction Pills Industry Revenue (Million) Forecast, by Application 2019 & 2032
- Table 20: Germany Erectile Dysfunction Pills Industry Volume (K Unit) Forecast, by Application 2019 & 2032
- Table 21: United Kingdom Erectile Dysfunction Pills Industry Revenue (Million) Forecast, by Application 2019 & 2032
- Table 22: United Kingdom Erectile Dysfunction Pills Industry Volume (K Unit) Forecast, by Application 2019 & 2032
- Table 23: France Erectile Dysfunction Pills Industry Revenue (Million) Forecast, by Application 2019 & 2032
- Table 24: France Erectile Dysfunction Pills Industry Volume (K Unit) Forecast, by Application 2019 & 2032
- Table 25: Italy Erectile Dysfunction Pills Industry Revenue (Million) Forecast, by Application 2019 & 2032
- Table 26: Italy Erectile Dysfunction Pills Industry Volume (K Unit) Forecast, by Application 2019 & 2032
- Table 27: Spain Erectile Dysfunction Pills Industry Revenue (Million) Forecast, by Application 2019 & 2032
- Table 28: Spain Erectile Dysfunction Pills Industry Volume (K Unit) Forecast, by Application 2019 & 2032
- Table 29: Rest of Europe Erectile Dysfunction Pills Industry Revenue (Million) Forecast, by Application 2019 & 2032
- Table 30: Rest of Europe Erectile Dysfunction Pills Industry Volume (K Unit) Forecast, by Application 2019 & 2032
- Table 31: Global Erectile Dysfunction Pills Industry Revenue Million Forecast, by Country 2019 & 2032
- Table 32: Global Erectile Dysfunction Pills Industry Volume K Unit Forecast, by Country 2019 & 2032
- Table 33: China Erectile Dysfunction Pills Industry Revenue (Million) Forecast, by Application 2019 & 2032
- Table 34: China Erectile Dysfunction Pills Industry Volume (K Unit) Forecast, by Application 2019 & 2032
- Table 35: Japan Erectile Dysfunction Pills Industry Revenue (Million) Forecast, by Application 2019 & 2032
- Table 36: Japan Erectile Dysfunction Pills Industry Volume (K Unit) Forecast, by Application 2019 & 2032
- Table 37: India Erectile Dysfunction Pills Industry Revenue (Million) Forecast, by Application 2019 & 2032
- Table 38: India Erectile Dysfunction Pills Industry Volume (K Unit) Forecast, by Application 2019 & 2032
- Table 39: Australia Erectile Dysfunction Pills Industry Revenue (Million) Forecast, by Application 2019 & 2032
- Table 40: Australia Erectile Dysfunction Pills Industry Volume (K Unit) Forecast, by Application 2019 & 2032
- Table 41: South Korea Erectile Dysfunction Pills Industry Revenue (Million) Forecast, by Application 2019 & 2032
- Table 42: South Korea Erectile Dysfunction Pills Industry Volume (K Unit) Forecast, by Application 2019 & 2032
- Table 43: Rest of Asia Pacific Erectile Dysfunction Pills Industry Revenue (Million) Forecast, by Application 2019 & 2032
- Table 44: Rest of Asia Pacific Erectile Dysfunction Pills Industry Volume (K Unit) Forecast, by Application 2019 & 2032
- Table 45: Global Erectile Dysfunction Pills Industry Revenue Million Forecast, by Country 2019 & 2032
- Table 46: Global Erectile Dysfunction Pills Industry Volume K Unit Forecast, by Country 2019 & 2032
- Table 47: GCC Erectile Dysfunction Pills Industry Revenue (Million) Forecast, by Application 2019 & 2032
- Table 48: GCC Erectile Dysfunction Pills Industry Volume (K Unit) Forecast, by Application 2019 & 2032
- Table 49: South Africa Erectile Dysfunction Pills Industry Revenue (Million) Forecast, by Application 2019 & 2032
- Table 50: South Africa Erectile Dysfunction Pills Industry Volume (K Unit) Forecast, by Application 2019 & 2032
- Table 51: Rest of Middle East and Africa Erectile Dysfunction Pills Industry Revenue (Million) Forecast, by Application 2019 & 2032
- Table 52: Rest of Middle East and Africa Erectile Dysfunction Pills Industry Volume (K Unit) Forecast, by Application 2019 & 2032
- Table 53: Global Erectile Dysfunction Pills Industry Revenue Million Forecast, by Country 2019 & 2032
- Table 54: Global Erectile Dysfunction Pills Industry Volume K Unit Forecast, by Country 2019 & 2032
- Table 55: Brazil Erectile Dysfunction Pills Industry Revenue (Million) Forecast, by Application 2019 & 2032
- Table 56: Brazil Erectile Dysfunction Pills Industry Volume (K Unit) Forecast, by Application 2019 & 2032
- Table 57: Argentina Erectile Dysfunction Pills Industry Revenue (Million) Forecast, by Application 2019 & 2032
- Table 58: Argentina Erectile Dysfunction Pills Industry Volume (K Unit) Forecast, by Application 2019 & 2032
- Table 59: Rest of South America Erectile Dysfunction Pills Industry Revenue (Million) Forecast, by Application 2019 & 2032
- Table 60: Rest of South America Erectile Dysfunction Pills Industry Volume (K Unit) Forecast, by Application 2019 & 2032
- Table 61: Global Erectile Dysfunction Pills Industry Revenue Million Forecast, by Product 2019 & 2032
- Table 62: Global Erectile Dysfunction Pills Industry Volume K Unit Forecast, by Product 2019 & 2032
- Table 63: Global Erectile Dysfunction Pills Industry Revenue Million Forecast, by Distribution Channel 2019 & 2032
- Table 64: Global Erectile Dysfunction Pills Industry Volume K Unit Forecast, by Distribution Channel 2019 & 2032
- Table 65: Global Erectile Dysfunction Pills Industry Revenue Million Forecast, by Country 2019 & 2032
- Table 66: Global Erectile Dysfunction Pills Industry Volume K Unit Forecast, by Country 2019 & 2032
- Table 67: United States Erectile Dysfunction Pills Industry Revenue (Million) Forecast, by Application 2019 & 2032
- Table 68: United States Erectile Dysfunction Pills Industry Volume (K Unit) Forecast, by Application 2019 & 2032
- Table 69: Canada Erectile Dysfunction Pills Industry Revenue (Million) Forecast, by Application 2019 & 2032
- Table 70: Canada Erectile Dysfunction Pills Industry Volume (K Unit) Forecast, by Application 2019 & 2032
- Table 71: Mexico Erectile Dysfunction Pills Industry Revenue (Million) Forecast, by Application 2019 & 2032
- Table 72: Mexico Erectile Dysfunction Pills Industry Volume (K Unit) Forecast, by Application 2019 & 2032
- Table 73: Global Erectile Dysfunction Pills Industry Revenue Million Forecast, by Product 2019 & 2032
- Table 74: Global Erectile Dysfunction Pills Industry Volume K Unit Forecast, by Product 2019 & 2032
- Table 75: Global Erectile Dysfunction Pills Industry Revenue Million Forecast, by Distribution Channel 2019 & 2032
- Table 76: Global Erectile Dysfunction Pills Industry Volume K Unit Forecast, by Distribution Channel 2019 & 2032
- Table 77: Global Erectile Dysfunction Pills Industry Revenue Million Forecast, by Country 2019 & 2032
- Table 78: Global Erectile Dysfunction Pills Industry Volume K Unit Forecast, by Country 2019 & 2032
- Table 79: Germany Erectile Dysfunction Pills Industry Revenue (Million) Forecast, by Application 2019 & 2032
- Table 80: Germany Erectile Dysfunction Pills Industry Volume (K Unit) Forecast, by Application 2019 & 2032
- Table 81: United Kingdom Erectile Dysfunction Pills Industry Revenue (Million) Forecast, by Application 2019 & 2032
- Table 82: United Kingdom Erectile Dysfunction Pills Industry Volume (K Unit) Forecast, by Application 2019 & 2032
- Table 83: France Erectile Dysfunction Pills Industry Revenue (Million) Forecast, by Application 2019 & 2032
- Table 84: France Erectile Dysfunction Pills Industry Volume (K Unit) Forecast, by Application 2019 & 2032
- Table 85: Italy Erectile Dysfunction Pills Industry Revenue (Million) Forecast, by Application 2019 & 2032
- Table 86: Italy Erectile Dysfunction Pills Industry Volume (K Unit) Forecast, by Application 2019 & 2032
- Table 87: Spain Erectile Dysfunction Pills Industry Revenue (Million) Forecast, by Application 2019 & 2032
- Table 88: Spain Erectile Dysfunction Pills Industry Volume (K Unit) Forecast, by Application 2019 & 2032
- Table 89: Rest of Europe Erectile Dysfunction Pills Industry Revenue (Million) Forecast, by Application 2019 & 2032
- Table 90: Rest of Europe Erectile Dysfunction Pills Industry Volume (K Unit) Forecast, by Application 2019 & 2032
- Table 91: Global Erectile Dysfunction Pills Industry Revenue Million Forecast, by Product 2019 & 2032
- Table 92: Global Erectile Dysfunction Pills Industry Volume K Unit Forecast, by Product 2019 & 2032
- Table 93: Global Erectile Dysfunction Pills Industry Revenue Million Forecast, by Distribution Channel 2019 & 2032
- Table 94: Global Erectile Dysfunction Pills Industry Volume K Unit Forecast, by Distribution Channel 2019 & 2032
- Table 95: Global Erectile Dysfunction Pills Industry Revenue Million Forecast, by Country 2019 & 2032
- Table 96: Global Erectile Dysfunction Pills Industry Volume K Unit Forecast, by Country 2019 & 2032
- Table 97: China Erectile Dysfunction Pills Industry Revenue (Million) Forecast, by Application 2019 & 2032
- Table 98: China Erectile Dysfunction Pills Industry Volume (K Unit) Forecast, by Application 2019 & 2032
- Table 99: Japan Erectile Dysfunction Pills Industry Revenue (Million) Forecast, by Application 2019 & 2032
- Table 100: Japan Erectile Dysfunction Pills Industry Volume (K Unit) Forecast, by Application 2019 & 2032
- Table 101: India Erectile Dysfunction Pills Industry Revenue (Million) Forecast, by Application 2019 & 2032
- Table 102: India Erectile Dysfunction Pills Industry Volume (K Unit) Forecast, by Application 2019 & 2032
- Table 103: Australia Erectile Dysfunction Pills Industry Revenue (Million) Forecast, by Application 2019 & 2032
- Table 104: Australia Erectile Dysfunction Pills Industry Volume (K Unit) Forecast, by Application 2019 & 2032
- Table 105: South Korea Erectile Dysfunction Pills Industry Revenue (Million) Forecast, by Application 2019 & 2032
- Table 106: South Korea Erectile Dysfunction Pills Industry Volume (K Unit) Forecast, by Application 2019 & 2032
- Table 107: Rest of Asia Pacific Erectile Dysfunction Pills Industry Revenue (Million) Forecast, by Application 2019 & 2032
- Table 108: Rest of Asia Pacific Erectile Dysfunction Pills Industry Volume (K Unit) Forecast, by Application 2019 & 2032
- Table 109: Global Erectile Dysfunction Pills Industry Revenue Million Forecast, by Product 2019 & 2032
- Table 110: Global Erectile Dysfunction Pills Industry Volume K Unit Forecast, by Product 2019 & 2032
- Table 111: Global Erectile Dysfunction Pills Industry Revenue Million Forecast, by Distribution Channel 2019 & 2032
- Table 112: Global Erectile Dysfunction Pills Industry Volume K Unit Forecast, by Distribution Channel 2019 & 2032
- Table 113: Global Erectile Dysfunction Pills Industry Revenue Million Forecast, by Country 2019 & 2032
- Table 114: Global Erectile Dysfunction Pills Industry Volume K Unit Forecast, by Country 2019 & 2032
- Table 115: GCC Erectile Dysfunction Pills Industry Revenue (Million) Forecast, by Application 2019 & 2032
- Table 116: GCC Erectile Dysfunction Pills Industry Volume (K Unit) Forecast, by Application 2019 & 2032
- Table 117: South Africa Erectile Dysfunction Pills Industry Revenue (Million) Forecast, by Application 2019 & 2032
- Table 118: South Africa Erectile Dysfunction Pills Industry Volume (K Unit) Forecast, by Application 2019 & 2032
- Table 119: Rest of Middle East and Africa Erectile Dysfunction Pills Industry Revenue (Million) Forecast, by Application 2019 & 2032
- Table 120: Rest of Middle East and Africa Erectile Dysfunction Pills Industry Volume (K Unit) Forecast, by Application 2019 & 2032
- Table 121: Global Erectile Dysfunction Pills Industry Revenue Million Forecast, by Product 2019 & 2032
- Table 122: Global Erectile Dysfunction Pills Industry Volume K Unit Forecast, by Product 2019 & 2032
- Table 123: Global Erectile Dysfunction Pills Industry Revenue Million Forecast, by Distribution Channel 2019 & 2032
- Table 124: Global Erectile Dysfunction Pills Industry Volume K Unit Forecast, by Distribution Channel 2019 & 2032
- Table 125: Global Erectile Dysfunction Pills Industry Revenue Million Forecast, by Country 2019 & 2032
- Table 126: Global Erectile Dysfunction Pills Industry Volume K Unit Forecast, by Country 2019 & 2032
- Table 127: Brazil Erectile Dysfunction Pills Industry Revenue (Million) Forecast, by Application 2019 & 2032
- Table 128: Brazil Erectile Dysfunction Pills Industry Volume (K Unit) Forecast, by Application 2019 & 2032
- Table 129: Argentina Erectile Dysfunction Pills Industry Revenue (Million) Forecast, by Application 2019 & 2032
- Table 130: Argentina Erectile Dysfunction Pills Industry Volume (K Unit) Forecast, by Application 2019 & 2032
- Table 131: Rest of South America Erectile Dysfunction Pills Industry Revenue (Million) Forecast, by Application 2019 & 2032
- Table 132: Rest of South America Erectile Dysfunction Pills Industry Volume (K Unit) Forecast, by Application 2019 & 2032
Frequently Asked Questions
1. What is the projected Compound Annual Growth Rate (CAGR) of the Erectile Dysfunction Pills Industry?
The projected CAGR is approximately 3.80%.
2. Which companies are prominent players in the Erectile Dysfunction Pills Industry?
Key companies in the market include S K Chemicals Co Ltd, Bayer AG, Glenmark Pharmaceuticals Limited, Eli Lilly and Company, Petros Pharmaceutical, Teva Pharmaceutical Industries Ltd, Apricus Biosciences Inc, Cipla Ltd, Lupin Limited, VIVUS Inc, GlaxoSmithKline PLC, Pfizer Inc.
3. What are the main segments of the Erectile Dysfunction Pills Industry?
The market segments include Product, Distribution Channel.
4. Can you provide details about the market size?
The market size is estimated to be USD XX Million as of 2022.
5. What are some drivers contributing to market growth?
Rising Adoption of a Sedentary Lifestyle Along with the Associated Stress; Rising Geriatric Population; Comorbidity between Erectile Dysfunction and Heart Diseases and Diabetes.
6. What are the notable trends driving market growth?
The Viagra (sildenafil citrate) Segment is Expected to Dominate the Market.
7. Are there any restraints impacting market growth?
Reluctance of Patients to Seek Treatment; Poor Patient Adherence to ED Drugs.
8. Can you provide examples of recent developments in the market?
In September 2021, iX Biopharma, through its wholly-owned subsidiary, signed an agreement with CRPCG for the licensing, supply, and distribution of Wafesil, a sublingual sildenafil wafer for the treatment of male erectile dysfunction, in China.
9. What pricing options are available for accessing the report?
Pricing options include single-user, multi-user, and enterprise licenses priced at USD 4750, USD 5250, and USD 8750 respectively.
10. Is the market size provided in terms of value or volume?
The market size is provided in terms of value, measured in Million and volume, measured in K Unit.
11. Are there any specific market keywords associated with the report?
Yes, the market keyword associated with the report is "Erectile Dysfunction Pills Industry," which aids in identifying and referencing the specific market segment covered.
12. How do I determine which pricing option suits my needs best?
The pricing options vary based on user requirements and access needs. Individual users may opt for single-user licenses, while businesses requiring broader access may choose multi-user or enterprise licenses for cost-effective access to the report.
13. Are there any additional resources or data provided in the Erectile Dysfunction Pills Industry report?
While the report offers comprehensive insights, it's advisable to review the specific contents or supplementary materials provided to ascertain if additional resources or data are available.
14. How can I stay updated on further developments or reports in the Erectile Dysfunction Pills Industry?
To stay informed about further developments, trends, and reports in the Erectile Dysfunction Pills Industry, consider subscribing to industry newsletters, following relevant companies and organizations, or regularly checking reputable industry news sources and publications.
Methodology
Step 1 - Identification of Relevant Samples Size from Population Database


Step 2 - Approaches for Defining Global Market Size (Value, Volume* & Price*)

Note*: In applicable scenarios
Step 3 - Data Sources
Primary Research
- Web Analytics
- Survey Reports
- Research Institute
- Latest Research Reports
- Opinion Leaders
Secondary Research
- Annual Reports
- White Paper
- Latest Press Release
- Industry Association
- Paid Database
- Investor Presentations

Step 4 - Data Triangulation
Involves using different sources of information in order to increase the validity of a study
These sources are likely to be stakeholders in a program - participants, other researchers, program staff, other community members, and so on.
Then we put all data in single framework & apply various statistical tools to find out the dynamic on the market.
During the analysis stage, feedback from the stakeholder groups would be compared to determine areas of agreement as well as areas of divergence


