
Key Insights
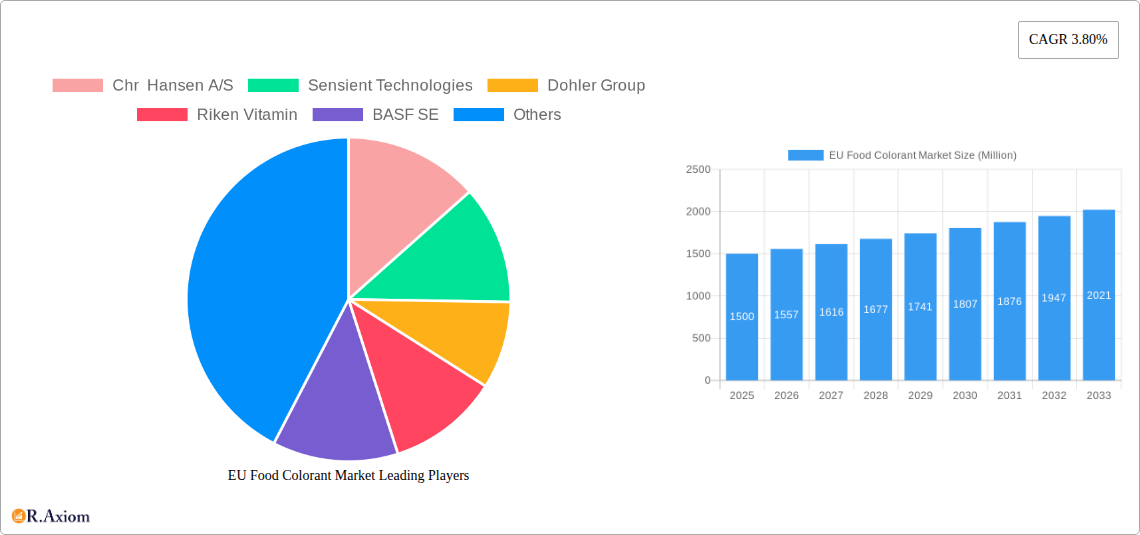
The EU food colorant market, exhibiting a CAGR of 3.80%, presents a dynamic landscape shaped by several key factors. The market's growth is driven by increasing demand for processed foods, particularly within the confectionery, beverage, and dairy sectors. Consumer preference for visually appealing products fuels this demand, leading manufacturers to incorporate natural and synthetic food colorants to enhance the aesthetic appeal of their offerings. Furthermore, the rising popularity of convenient and ready-to-eat meals, coupled with the expanding food service industry, contributes significantly to market expansion. However, growing consumer awareness of the potential health implications of certain artificial food colorants is a significant restraint. This increasing awareness is driving a shift towards natural colorants, which are perceived as healthier alternatives. The market is segmented by product type (natural and synthetic) and application (beverage, dairy & frozen products, bakery, meat, poultry & seafood, confectionery, and others). Natural colorants are witnessing robust growth due to health concerns, while synthetic colorants maintain a substantial market share due to cost-effectiveness and wider color range. Within the application segments, the confectionery and beverage industries are the largest consumers of food colorants, demonstrating substantial growth potential in the coming years. The competitive landscape includes major players like Chr. Hansen, Sensient Technologies, and Döhler Group, amongst others, actively engaged in research and development to introduce innovative and sustainable colorant solutions.
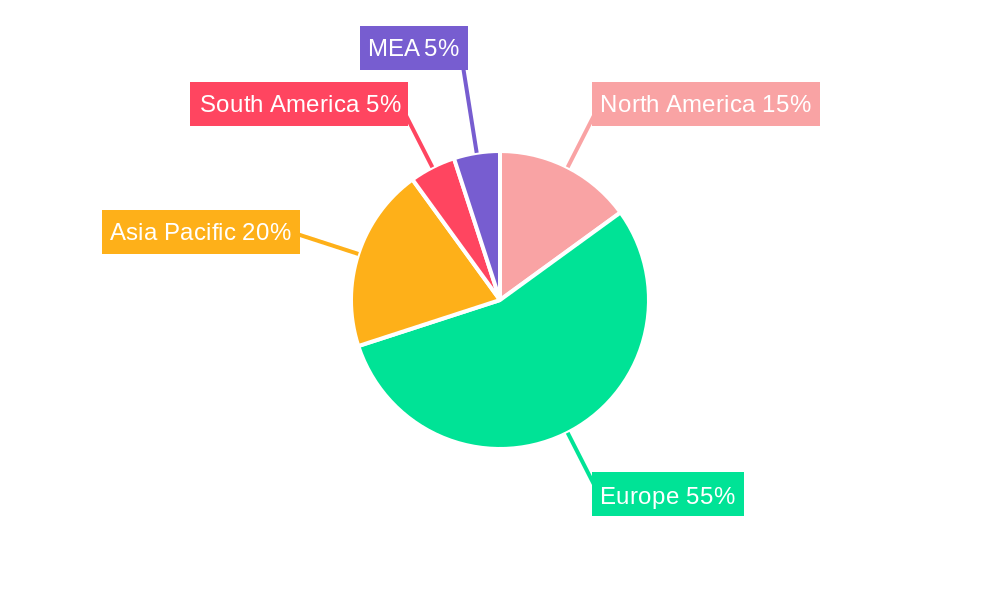
Geographical analysis reveals that Western European nations like Germany, the UK, and France are major contributors to the overall market size due to well-established food processing industries and high per capita consumption. Eastern European countries present emerging opportunities due to the growing middle class and increased demand for processed foods. Regulatory changes related to food safety and labeling also influence market trends, particularly concerning the approval and usage of specific colorants. The market's future trajectory will likely be defined by the increasing demand for clean-label products, the continued development of natural colorants, and a greater focus on sustainable sourcing practices. The EU's stringent regulations on food additives will continue to shape the market, favoring companies that prioritize compliance and transparency. The anticipated market expansion necessitates proactive strategies for companies to capitalize on the growing demand for both natural and synthetic colorants while adhering to evolving regulatory standards.
EU Food Colorant Market: A Comprehensive Report (2019-2033)
This in-depth report provides a comprehensive analysis of the EU Food Colorant Market, offering actionable insights for industry stakeholders. Covering the period 2019-2033, with a focus on 2025, this report meticulously examines market dynamics, competitive landscapes, and future growth potential. The report leverages extensive primary and secondary research, delivering precise data and insightful forecasts.
EU Food Colorant Market Concentration & Innovation
The EU food colorant market exhibits a moderately concentrated structure, with key players like Chr. Hansen A/S, Sensient Technologies, Dohler Group, Riken Vitamin, BASF SE, Koninklijke DSM N.V., D&D Williamson & Co, and Givaudan (Naturex) holding significant market share. However, the presence of numerous smaller players creates a competitive landscape. The market share of the top five players is estimated at xx%, indicating room for both organic growth and consolidation through mergers and acquisitions (M&A). M&A activity in the past five years has involved deals valued at approximately xx Million, primarily driven by the desire to expand product portfolios and geographic reach.
- Market Concentration: Top 5 players hold approximately xx% market share (Estimated 2025).
- Innovation Drivers: Growing demand for natural colors, stricter regulations on synthetic colors, and technological advancements in color extraction and stabilization.
- Regulatory Frameworks: EU regulations (e.g., Regulation (EC) No 1333/2008) significantly influence market dynamics, driving innovation in natural colorants and impacting the usage of synthetic alternatives.
- Product Substitutes: Natural alternatives are increasingly replacing synthetic colorants, driven by consumer preferences for clean-label products.
- End-User Trends: The rising demand for convenience foods and processed products fuels the consumption of food colorants, across various application segments.
- M&A Activity: Recent years have witnessed significant M&A activity, with xx Million in deal values (2019-2024). These deals focus on acquiring companies with specialized technologies or strong regional presence.
EU Food Colorant Market Industry Trends & Insights
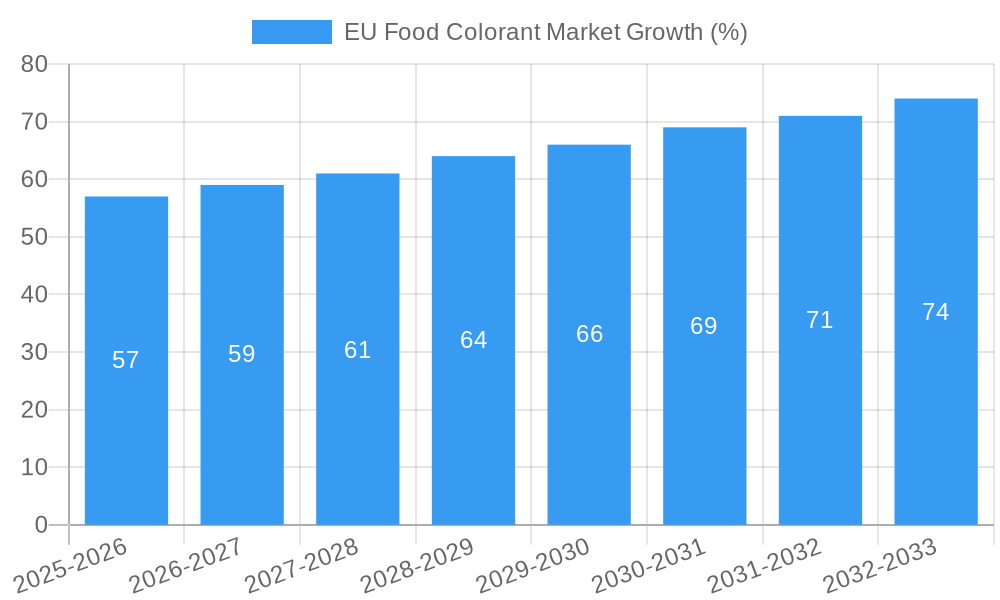
The EU food colorant market is witnessing robust growth, driven by increasing demand for processed foods, changing consumer preferences toward natural colors, and technological innovations in color extraction and synthesis. The market is projected to witness a CAGR of xx% during the forecast period (2025-2033), reaching a value of xx Million by 2033. Technological disruptions, particularly in the area of natural color production, are impacting the market significantly. Consumer preference for clean labels and natural ingredients is accelerating the shift toward natural food colorants. The market exhibits strong competitive dynamics with both established players and smaller, specialized companies vying for market share. Market penetration of natural colors is gradually increasing, with an estimated xx% market share in 2025.
Dominant Markets & Segments in EU Food Colorant Market
The largest segment by product type is synthetic colorants, accounting for approximately xx% of the market in 2025. However, the natural color segment is experiencing faster growth due to increasing consumer demand and health consciousness. Among applications, the beverage industry constitutes the largest segment, holding approximately xx% market share. This is primarily driven by the extensive use of food colorants in soft drinks, juices, and other beverages. Germany and France are the leading markets within the EU, benefiting from a strong processed food industry and a large consumer base.
- Key Drivers for Synthetic Color Segment: Cost-effectiveness, consistent color, and established supply chains.
- Key Drivers for Natural Color Segment: Growing consumer preference for natural ingredients and clean-label products.
- Key Drivers for Beverage Application: Wide usage of colorants in soft drinks, juices, and alcoholic beverages.
- Key Drivers for Germany & France: Large consumer base, strong processed food industry, and robust economic growth.
Dominance Analysis: The synthetic color segment dominates due to its cost-effectiveness and established infrastructure. However, the natural color segment shows stronger growth potential, driven by consumer preferences and health concerns, making it a vital area for future investment. The beverage segment maintains its lead due to extensive use in ready-to-drink products. Germany and France's dominant positions are supported by their large populations and developed food processing sectors.
EU Food Colorant Market Product Developments
Recent product innovations focus on developing natural colorants with improved stability, intensity, and cost-effectiveness. Technological advances in extraction and processing techniques are resulting in more diverse and sophisticated natural color options. Companies are focusing on creating colorants that meet stringent EU regulations while maintaining consumer appeal. These innovations are shaping market preferences, enhancing product shelf life and improving the overall quality of food products.
Report Scope & Segmentation Analysis
The report segments the EU food colorant market by product type (Natural Color, Synthetic Color) and application (Beverage, Dairy & Frozen Product, Bakery, Meat, Poultry & Seafood, Confectionery, Others). Each segment provides detailed growth projections, market sizes (in Million), and competitive dynamics. The natural color segment is expected to exhibit higher growth than the synthetic color segment due to increasing consumer demand for natural products. The beverage application segment currently holds the largest market share, followed by confectionery and dairy.
Key Drivers of EU Food Colorant Market Growth
The EU food colorant market's growth is driven by several factors: the rising demand for processed foods, consumer preference for visually appealing products, technological advancements resulting in improved colorants, and the evolving regulatory landscape that encourages the use of natural colors. Economic growth and increasing disposable incomes also contribute to greater food consumption, supporting market expansion.
Challenges in the EU Food Colorant Market Sector
The EU food colorant market faces several challenges: stringent EU regulations on color additives necessitate continuous product development and compliance; fluctuating raw material prices and supply chain disruptions impact profitability; intense competition among established players and new entrants requires companies to innovate constantly to maintain market share. These factors are estimated to restrain market growth by approximately xx% annually during the forecast period.
Emerging Opportunities in EU Food Colorant Market
Emerging opportunities exist in the development of novel natural colorants derived from sustainable sources, catering to growing consumer demands for eco-friendly and ethically sourced products. Innovations in color stabilization and delivery systems further enhance market prospects. Expanding into niche markets like functional foods and personalized nutrition could also generate new growth opportunities.
Leading Players in the EU Food Colorant Market Market
- Chr. Hansen A/S
- Sensient Technologies
- Dohler Group
- Riken Vitamin
- BASF SE
- Koninklijke DSM N.V.
- D&D Williamson & Co
- Givaudan (Naturex) *List Not Exhaustive
Key Developments in EU Food Colorant Market Industry
- 2022 Q3: Sensient Technologies launched a new range of natural colorants extracted from fruit and vegetable sources.
- 2023 Q1: Chr. Hansen A/S acquired a smaller competitor specializing in natural color extracts, expanding its product portfolio.
- 2024 Q2: New EU regulations regarding the labeling of synthetic food colorants were implemented. (Further developments to be added as they occur).
Strategic Outlook for EU Food Colorant Market Market
The EU food colorant market is poised for continued growth, driven by evolving consumer preferences and ongoing innovation. The increasing demand for natural colorants presents significant opportunities for companies that can effectively develop, manufacture, and market sustainable and high-quality products. Strategic partnerships and acquisitions will play a key role in shaping the market's future landscape. The market will likely see consolidation among players to optimize production efficiency, gain economies of scale, and expand into new markets.
EU Food Colorant Market Segmentation
-
1. Product Type
- 1.1. Natural Color
- 1.2. Synthetic Color
-
2. Application
- 2.1. Beverage
- 2.2. Dairy & Frozen Product
- 2.3. Bakery
- 2.4. Meat, Poultry & Seafood
- 2.5. Confectionery
- 2.6. Others
EU Food Colorant Market Segmentation By Geography
- 1. Spain
- 2. United Kingdom
- 3. Germany
- 4. France
- 5. Italy
- 6. Russia
- 7. Rest of Europe
EU Food Colorant Market REPORT HIGHLIGHTS
| Aspects | Details |
|---|---|
| Study Period | 2019-2033 |
| Base Year | 2024 |
| Estimated Year | 2025 |
| Forecast Period | 2025-2033 |
| Historical Period | 2019-2024 |
| Growth Rate | CAGR of 3.80% from 2019-2033 |
| Segmentation |
|
Table of Contents
- 1. Introduction
- 1.1. Research Scope
- 1.2. Market Segmentation
- 1.3. Research Methodology
- 1.4. Definitions and Assumptions
- 2. Executive Summary
- 2.1. Introduction
- 3. Market Dynamics
- 3.1. Introduction
- 3.2. Market Drivers
- 3.2.1. The Rising Awareness of the Health Benefits Associated with Collagen Consumption; Rising Sport and Fitness Trends Drives the Market Growth
- 3.3. Market Restrains
- 3.3.1. Concerns over the Source and Animal Welfare in Collagen Extraction Limit the Market Growth
- 3.4. Market Trends
- 3.4.1. United Kingdom Held the Largest Market Share
- 4. Market Factor Analysis
- 4.1. Porters Five Forces
- 4.2. Supply/Value Chain
- 4.3. PESTEL analysis
- 4.4. Market Entropy
- 4.5. Patent/Trademark Analysis
- 5. Global EU Food Colorant Market Analysis, Insights and Forecast, 2019-2031
- 5.1. Market Analysis, Insights and Forecast - by Product Type
- 5.1.1. Natural Color
- 5.1.2. Synthetic Color
- 5.2. Market Analysis, Insights and Forecast - by Application
- 5.2.1. Beverage
- 5.2.2. Dairy & Frozen Product
- 5.2.3. Bakery
- 5.2.4. Meat, Poultry & Seafood
- 5.2.5. Confectionery
- 5.2.6. Others
- 5.3. Market Analysis, Insights and Forecast - by Region
- 5.3.1. Spain
- 5.3.2. United Kingdom
- 5.3.3. Germany
- 5.3.4. France
- 5.3.5. Italy
- 5.3.6. Russia
- 5.3.7. Rest of Europe
- 5.1. Market Analysis, Insights and Forecast - by Product Type
- 6. Spain EU Food Colorant Market Analysis, Insights and Forecast, 2019-2031
- 6.1. Market Analysis, Insights and Forecast - by Product Type
- 6.1.1. Natural Color
- 6.1.2. Synthetic Color
- 6.2. Market Analysis, Insights and Forecast - by Application
- 6.2.1. Beverage
- 6.2.2. Dairy & Frozen Product
- 6.2.3. Bakery
- 6.2.4. Meat, Poultry & Seafood
- 6.2.5. Confectionery
- 6.2.6. Others
- 6.1. Market Analysis, Insights and Forecast - by Product Type
- 7. United Kingdom EU Food Colorant Market Analysis, Insights and Forecast, 2019-2031
- 7.1. Market Analysis, Insights and Forecast - by Product Type
- 7.1.1. Natural Color
- 7.1.2. Synthetic Color
- 7.2. Market Analysis, Insights and Forecast - by Application
- 7.2.1. Beverage
- 7.2.2. Dairy & Frozen Product
- 7.2.3. Bakery
- 7.2.4. Meat, Poultry & Seafood
- 7.2.5. Confectionery
- 7.2.6. Others
- 7.1. Market Analysis, Insights and Forecast - by Product Type
- 8. Germany EU Food Colorant Market Analysis, Insights and Forecast, 2019-2031
- 8.1. Market Analysis, Insights and Forecast - by Product Type
- 8.1.1. Natural Color
- 8.1.2. Synthetic Color
- 8.2. Market Analysis, Insights and Forecast - by Application
- 8.2.1. Beverage
- 8.2.2. Dairy & Frozen Product
- 8.2.3. Bakery
- 8.2.4. Meat, Poultry & Seafood
- 8.2.5. Confectionery
- 8.2.6. Others
- 8.1. Market Analysis, Insights and Forecast - by Product Type
- 9. France EU Food Colorant Market Analysis, Insights and Forecast, 2019-2031
- 9.1. Market Analysis, Insights and Forecast - by Product Type
- 9.1.1. Natural Color
- 9.1.2. Synthetic Color
- 9.2. Market Analysis, Insights and Forecast - by Application
- 9.2.1. Beverage
- 9.2.2. Dairy & Frozen Product
- 9.2.3. Bakery
- 9.2.4. Meat, Poultry & Seafood
- 9.2.5. Confectionery
- 9.2.6. Others
- 9.1. Market Analysis, Insights and Forecast - by Product Type
- 10. Italy EU Food Colorant Market Analysis, Insights and Forecast, 2019-2031
- 10.1. Market Analysis, Insights and Forecast - by Product Type
- 10.1.1. Natural Color
- 10.1.2. Synthetic Color
- 10.2. Market Analysis, Insights and Forecast - by Application
- 10.2.1. Beverage
- 10.2.2. Dairy & Frozen Product
- 10.2.3. Bakery
- 10.2.4. Meat, Poultry & Seafood
- 10.2.5. Confectionery
- 10.2.6. Others
- 10.1. Market Analysis, Insights and Forecast - by Product Type
- 11. Russia EU Food Colorant Market Analysis, Insights and Forecast, 2019-2031
- 11.1. Market Analysis, Insights and Forecast - by Product Type
- 11.1.1. Natural Color
- 11.1.2. Synthetic Color
- 11.2. Market Analysis, Insights and Forecast - by Application
- 11.2.1. Beverage
- 11.2.2. Dairy & Frozen Product
- 11.2.3. Bakery
- 11.2.4. Meat, Poultry & Seafood
- 11.2.5. Confectionery
- 11.2.6. Others
- 11.1. Market Analysis, Insights and Forecast - by Product Type
- 12. Rest of Europe EU Food Colorant Market Analysis, Insights and Forecast, 2019-2031
- 12.1. Market Analysis, Insights and Forecast - by Product Type
- 12.1.1. Natural Color
- 12.1.2. Synthetic Color
- 12.2. Market Analysis, Insights and Forecast - by Application
- 12.2.1. Beverage
- 12.2.2. Dairy & Frozen Product
- 12.2.3. Bakery
- 12.2.4. Meat, Poultry & Seafood
- 12.2.5. Confectionery
- 12.2.6. Others
- 12.1. Market Analysis, Insights and Forecast - by Product Type
- 13. North America EU Food Colorant Market Analysis, Insights and Forecast, 2019-2031
- 13.1. Market Analysis, Insights and Forecast - By Country/Sub-region
- 13.1.1 United States
- 13.1.2 Canada
- 13.1.3 Mexico
- 14. Europe EU Food Colorant Market Analysis, Insights and Forecast, 2019-2031
- 14.1. Market Analysis, Insights and Forecast - By Country/Sub-region
- 14.1.1 Germany
- 14.1.2 United Kingdom
- 14.1.3 France
- 14.1.4 Spain
- 14.1.5 Italy
- 14.1.6 Spain
- 14.1.7 Belgium
- 14.1.8 Netherland
- 14.1.9 Nordics
- 14.1.10 Rest of Europe
- 15. Asia Pacific EU Food Colorant Market Analysis, Insights and Forecast, 2019-2031
- 15.1. Market Analysis, Insights and Forecast - By Country/Sub-region
- 15.1.1 China
- 15.1.2 Japan
- 15.1.3 India
- 15.1.4 South Korea
- 15.1.5 Southeast Asia
- 15.1.6 Australia
- 15.1.7 Indonesia
- 15.1.8 Phillipes
- 15.1.9 Singapore
- 15.1.10 Thailandc
- 15.1.11 Rest of Asia Pacific
- 16. South America EU Food Colorant Market Analysis, Insights and Forecast, 2019-2031
- 16.1. Market Analysis, Insights and Forecast - By Country/Sub-region
- 16.1.1 Brazil
- 16.1.2 Argentina
- 16.1.3 Peru
- 16.1.4 Chile
- 16.1.5 Colombia
- 16.1.6 Ecuador
- 16.1.7 Venezuela
- 16.1.8 Rest of South America
- 17. North America EU Food Colorant Market Analysis, Insights and Forecast, 2019-2031
- 17.1. Market Analysis, Insights and Forecast - By Country/Sub-region
- 17.1.1 United States
- 17.1.2 Canada
- 17.1.3 Mexico
- 18. MEA EU Food Colorant Market Analysis, Insights and Forecast, 2019-2031
- 18.1. Market Analysis, Insights and Forecast - By Country/Sub-region
- 18.1.1 United Arab Emirates
- 18.1.2 Saudi Arabia
- 18.1.3 South Africa
- 18.1.4 Rest of Middle East and Africa
- 19. Competitive Analysis
- 19.1. Global Market Share Analysis 2024
- 19.2. Company Profiles
- 19.2.1 Chr Hansen A/S
- 19.2.1.1. Overview
- 19.2.1.2. Products
- 19.2.1.3. SWOT Analysis
- 19.2.1.4. Recent Developments
- 19.2.1.5. Financials (Based on Availability)
- 19.2.2 Sensient Technologies
- 19.2.2.1. Overview
- 19.2.2.2. Products
- 19.2.2.3. SWOT Analysis
- 19.2.2.4. Recent Developments
- 19.2.2.5. Financials (Based on Availability)
- 19.2.3 Dohler Group
- 19.2.3.1. Overview
- 19.2.3.2. Products
- 19.2.3.3. SWOT Analysis
- 19.2.3.4. Recent Developments
- 19.2.3.5. Financials (Based on Availability)
- 19.2.4 Riken Vitamin
- 19.2.4.1. Overview
- 19.2.4.2. Products
- 19.2.4.3. SWOT Analysis
- 19.2.4.4. Recent Developments
- 19.2.4.5. Financials (Based on Availability)
- 19.2.5 BASF SE
- 19.2.5.1. Overview
- 19.2.5.2. Products
- 19.2.5.3. SWOT Analysis
- 19.2.5.4. Recent Developments
- 19.2.5.5. Financials (Based on Availability)
- 19.2.6 Koninklijke DSM N V
- 19.2.6.1. Overview
- 19.2.6.2. Products
- 19.2.6.3. SWOT Analysis
- 19.2.6.4. Recent Developments
- 19.2.6.5. Financials (Based on Availability)
- 19.2.7 D D Williamson & Co
- 19.2.7.1. Overview
- 19.2.7.2. Products
- 19.2.7.3. SWOT Analysis
- 19.2.7.4. Recent Developments
- 19.2.7.5. Financials (Based on Availability)
- 19.2.8 Givaudan (Naturex)*List Not Exhaustive
- 19.2.8.1. Overview
- 19.2.8.2. Products
- 19.2.8.3. SWOT Analysis
- 19.2.8.4. Recent Developments
- 19.2.8.5. Financials (Based on Availability)
- 19.2.1 Chr Hansen A/S
List of Figures
- Figure 1: Global EU Food Colorant Market Revenue Breakdown (Million, %) by Region 2024 & 2032
- Figure 2: North America EU Food Colorant Market Revenue (Million), by Country 2024 & 2032
- Figure 3: North America EU Food Colorant Market Revenue Share (%), by Country 2024 & 2032
- Figure 4: Europe EU Food Colorant Market Revenue (Million), by Country 2024 & 2032
- Figure 5: Europe EU Food Colorant Market Revenue Share (%), by Country 2024 & 2032
- Figure 6: Asia Pacific EU Food Colorant Market Revenue (Million), by Country 2024 & 2032
- Figure 7: Asia Pacific EU Food Colorant Market Revenue Share (%), by Country 2024 & 2032
- Figure 8: South America EU Food Colorant Market Revenue (Million), by Country 2024 & 2032
- Figure 9: South America EU Food Colorant Market Revenue Share (%), by Country 2024 & 2032
- Figure 10: North America EU Food Colorant Market Revenue (Million), by Country 2024 & 2032
- Figure 11: North America EU Food Colorant Market Revenue Share (%), by Country 2024 & 2032
- Figure 12: MEA EU Food Colorant Market Revenue (Million), by Country 2024 & 2032
- Figure 13: MEA EU Food Colorant Market Revenue Share (%), by Country 2024 & 2032
- Figure 14: Spain EU Food Colorant Market Revenue (Million), by Product Type 2024 & 2032
- Figure 15: Spain EU Food Colorant Market Revenue Share (%), by Product Type 2024 & 2032
- Figure 16: Spain EU Food Colorant Market Revenue (Million), by Application 2024 & 2032
- Figure 17: Spain EU Food Colorant Market Revenue Share (%), by Application 2024 & 2032
- Figure 18: Spain EU Food Colorant Market Revenue (Million), by Country 2024 & 2032
- Figure 19: Spain EU Food Colorant Market Revenue Share (%), by Country 2024 & 2032
- Figure 20: United Kingdom EU Food Colorant Market Revenue (Million), by Product Type 2024 & 2032
- Figure 21: United Kingdom EU Food Colorant Market Revenue Share (%), by Product Type 2024 & 2032
- Figure 22: United Kingdom EU Food Colorant Market Revenue (Million), by Application 2024 & 2032
- Figure 23: United Kingdom EU Food Colorant Market Revenue Share (%), by Application 2024 & 2032
- Figure 24: United Kingdom EU Food Colorant Market Revenue (Million), by Country 2024 & 2032
- Figure 25: United Kingdom EU Food Colorant Market Revenue Share (%), by Country 2024 & 2032
- Figure 26: Germany EU Food Colorant Market Revenue (Million), by Product Type 2024 & 2032
- Figure 27: Germany EU Food Colorant Market Revenue Share (%), by Product Type 2024 & 2032
- Figure 28: Germany EU Food Colorant Market Revenue (Million), by Application 2024 & 2032
- Figure 29: Germany EU Food Colorant Market Revenue Share (%), by Application 2024 & 2032
- Figure 30: Germany EU Food Colorant Market Revenue (Million), by Country 2024 & 2032
- Figure 31: Germany EU Food Colorant Market Revenue Share (%), by Country 2024 & 2032
- Figure 32: France EU Food Colorant Market Revenue (Million), by Product Type 2024 & 2032
- Figure 33: France EU Food Colorant Market Revenue Share (%), by Product Type 2024 & 2032
- Figure 34: France EU Food Colorant Market Revenue (Million), by Application 2024 & 2032
- Figure 35: France EU Food Colorant Market Revenue Share (%), by Application 2024 & 2032
- Figure 36: France EU Food Colorant Market Revenue (Million), by Country 2024 & 2032
- Figure 37: France EU Food Colorant Market Revenue Share (%), by Country 2024 & 2032
- Figure 38: Italy EU Food Colorant Market Revenue (Million), by Product Type 2024 & 2032
- Figure 39: Italy EU Food Colorant Market Revenue Share (%), by Product Type 2024 & 2032
- Figure 40: Italy EU Food Colorant Market Revenue (Million), by Application 2024 & 2032
- Figure 41: Italy EU Food Colorant Market Revenue Share (%), by Application 2024 & 2032
- Figure 42: Italy EU Food Colorant Market Revenue (Million), by Country 2024 & 2032
- Figure 43: Italy EU Food Colorant Market Revenue Share (%), by Country 2024 & 2032
- Figure 44: Russia EU Food Colorant Market Revenue (Million), by Product Type 2024 & 2032
- Figure 45: Russia EU Food Colorant Market Revenue Share (%), by Product Type 2024 & 2032
- Figure 46: Russia EU Food Colorant Market Revenue (Million), by Application 2024 & 2032
- Figure 47: Russia EU Food Colorant Market Revenue Share (%), by Application 2024 & 2032
- Figure 48: Russia EU Food Colorant Market Revenue (Million), by Country 2024 & 2032
- Figure 49: Russia EU Food Colorant Market Revenue Share (%), by Country 2024 & 2032
- Figure 50: Rest of Europe EU Food Colorant Market Revenue (Million), by Product Type 2024 & 2032
- Figure 51: Rest of Europe EU Food Colorant Market Revenue Share (%), by Product Type 2024 & 2032
- Figure 52: Rest of Europe EU Food Colorant Market Revenue (Million), by Application 2024 & 2032
- Figure 53: Rest of Europe EU Food Colorant Market Revenue Share (%), by Application 2024 & 2032
- Figure 54: Rest of Europe EU Food Colorant Market Revenue (Million), by Country 2024 & 2032
- Figure 55: Rest of Europe EU Food Colorant Market Revenue Share (%), by Country 2024 & 2032
List of Tables
- Table 1: Global EU Food Colorant Market Revenue Million Forecast, by Region 2019 & 2032
- Table 2: Global EU Food Colorant Market Revenue Million Forecast, by Product Type 2019 & 2032
- Table 3: Global EU Food Colorant Market Revenue Million Forecast, by Application 2019 & 2032
- Table 4: Global EU Food Colorant Market Revenue Million Forecast, by Region 2019 & 2032
- Table 5: Global EU Food Colorant Market Revenue Million Forecast, by Country 2019 & 2032
- Table 6: United States EU Food Colorant Market Revenue (Million) Forecast, by Application 2019 & 2032
- Table 7: Canada EU Food Colorant Market Revenue (Million) Forecast, by Application 2019 & 2032
- Table 8: Mexico EU Food Colorant Market Revenue (Million) Forecast, by Application 2019 & 2032
- Table 9: Global EU Food Colorant Market Revenue Million Forecast, by Country 2019 & 2032
- Table 10: Germany EU Food Colorant Market Revenue (Million) Forecast, by Application 2019 & 2032
- Table 11: United Kingdom EU Food Colorant Market Revenue (Million) Forecast, by Application 2019 & 2032
- Table 12: France EU Food Colorant Market Revenue (Million) Forecast, by Application 2019 & 2032
- Table 13: Spain EU Food Colorant Market Revenue (Million) Forecast, by Application 2019 & 2032
- Table 14: Italy EU Food Colorant Market Revenue (Million) Forecast, by Application 2019 & 2032
- Table 15: Spain EU Food Colorant Market Revenue (Million) Forecast, by Application 2019 & 2032
- Table 16: Belgium EU Food Colorant Market Revenue (Million) Forecast, by Application 2019 & 2032
- Table 17: Netherland EU Food Colorant Market Revenue (Million) Forecast, by Application 2019 & 2032
- Table 18: Nordics EU Food Colorant Market Revenue (Million) Forecast, by Application 2019 & 2032
- Table 19: Rest of Europe EU Food Colorant Market Revenue (Million) Forecast, by Application 2019 & 2032
- Table 20: Global EU Food Colorant Market Revenue Million Forecast, by Country 2019 & 2032
- Table 21: China EU Food Colorant Market Revenue (Million) Forecast, by Application 2019 & 2032
- Table 22: Japan EU Food Colorant Market Revenue (Million) Forecast, by Application 2019 & 2032
- Table 23: India EU Food Colorant Market Revenue (Million) Forecast, by Application 2019 & 2032
- Table 24: South Korea EU Food Colorant Market Revenue (Million) Forecast, by Application 2019 & 2032
- Table 25: Southeast Asia EU Food Colorant Market Revenue (Million) Forecast, by Application 2019 & 2032
- Table 26: Australia EU Food Colorant Market Revenue (Million) Forecast, by Application 2019 & 2032
- Table 27: Indonesia EU Food Colorant Market Revenue (Million) Forecast, by Application 2019 & 2032
- Table 28: Phillipes EU Food Colorant Market Revenue (Million) Forecast, by Application 2019 & 2032
- Table 29: Singapore EU Food Colorant Market Revenue (Million) Forecast, by Application 2019 & 2032
- Table 30: Thailandc EU Food Colorant Market Revenue (Million) Forecast, by Application 2019 & 2032
- Table 31: Rest of Asia Pacific EU Food Colorant Market Revenue (Million) Forecast, by Application 2019 & 2032
- Table 32: Global EU Food Colorant Market Revenue Million Forecast, by Country 2019 & 2032
- Table 33: Brazil EU Food Colorant Market Revenue (Million) Forecast, by Application 2019 & 2032
- Table 34: Argentina EU Food Colorant Market Revenue (Million) Forecast, by Application 2019 & 2032
- Table 35: Peru EU Food Colorant Market Revenue (Million) Forecast, by Application 2019 & 2032
- Table 36: Chile EU Food Colorant Market Revenue (Million) Forecast, by Application 2019 & 2032
- Table 37: Colombia EU Food Colorant Market Revenue (Million) Forecast, by Application 2019 & 2032
- Table 38: Ecuador EU Food Colorant Market Revenue (Million) Forecast, by Application 2019 & 2032
- Table 39: Venezuela EU Food Colorant Market Revenue (Million) Forecast, by Application 2019 & 2032
- Table 40: Rest of South America EU Food Colorant Market Revenue (Million) Forecast, by Application 2019 & 2032
- Table 41: Global EU Food Colorant Market Revenue Million Forecast, by Country 2019 & 2032
- Table 42: United States EU Food Colorant Market Revenue (Million) Forecast, by Application 2019 & 2032
- Table 43: Canada EU Food Colorant Market Revenue (Million) Forecast, by Application 2019 & 2032
- Table 44: Mexico EU Food Colorant Market Revenue (Million) Forecast, by Application 2019 & 2032
- Table 45: Global EU Food Colorant Market Revenue Million Forecast, by Country 2019 & 2032
- Table 46: United Arab Emirates EU Food Colorant Market Revenue (Million) Forecast, by Application 2019 & 2032
- Table 47: Saudi Arabia EU Food Colorant Market Revenue (Million) Forecast, by Application 2019 & 2032
- Table 48: South Africa EU Food Colorant Market Revenue (Million) Forecast, by Application 2019 & 2032
- Table 49: Rest of Middle East and Africa EU Food Colorant Market Revenue (Million) Forecast, by Application 2019 & 2032
- Table 50: Global EU Food Colorant Market Revenue Million Forecast, by Product Type 2019 & 2032
- Table 51: Global EU Food Colorant Market Revenue Million Forecast, by Application 2019 & 2032
- Table 52: Global EU Food Colorant Market Revenue Million Forecast, by Country 2019 & 2032
- Table 53: Global EU Food Colorant Market Revenue Million Forecast, by Product Type 2019 & 2032
- Table 54: Global EU Food Colorant Market Revenue Million Forecast, by Application 2019 & 2032
- Table 55: Global EU Food Colorant Market Revenue Million Forecast, by Country 2019 & 2032
- Table 56: Global EU Food Colorant Market Revenue Million Forecast, by Product Type 2019 & 2032
- Table 57: Global EU Food Colorant Market Revenue Million Forecast, by Application 2019 & 2032
- Table 58: Global EU Food Colorant Market Revenue Million Forecast, by Country 2019 & 2032
- Table 59: Global EU Food Colorant Market Revenue Million Forecast, by Product Type 2019 & 2032
- Table 60: Global EU Food Colorant Market Revenue Million Forecast, by Application 2019 & 2032
- Table 61: Global EU Food Colorant Market Revenue Million Forecast, by Country 2019 & 2032
- Table 62: Global EU Food Colorant Market Revenue Million Forecast, by Product Type 2019 & 2032
- Table 63: Global EU Food Colorant Market Revenue Million Forecast, by Application 2019 & 2032
- Table 64: Global EU Food Colorant Market Revenue Million Forecast, by Country 2019 & 2032
- Table 65: Global EU Food Colorant Market Revenue Million Forecast, by Product Type 2019 & 2032
- Table 66: Global EU Food Colorant Market Revenue Million Forecast, by Application 2019 & 2032
- Table 67: Global EU Food Colorant Market Revenue Million Forecast, by Country 2019 & 2032
- Table 68: Global EU Food Colorant Market Revenue Million Forecast, by Product Type 2019 & 2032
- Table 69: Global EU Food Colorant Market Revenue Million Forecast, by Application 2019 & 2032
- Table 70: Global EU Food Colorant Market Revenue Million Forecast, by Country 2019 & 2032
Frequently Asked Questions
1. What is the projected Compound Annual Growth Rate (CAGR) of the EU Food Colorant Market?
The projected CAGR is approximately 3.80%.
2. Which companies are prominent players in the EU Food Colorant Market?
Key companies in the market include Chr Hansen A/S, Sensient Technologies, Dohler Group, Riken Vitamin, BASF SE, Koninklijke DSM N V, D D Williamson & Co, Givaudan (Naturex)*List Not Exhaustive.
3. What are the main segments of the EU Food Colorant Market?
The market segments include Product Type, Application.
4. Can you provide details about the market size?
The market size is estimated to be USD XX Million as of 2022.
5. What are some drivers contributing to market growth?
The Rising Awareness of the Health Benefits Associated with Collagen Consumption; Rising Sport and Fitness Trends Drives the Market Growth.
6. What are the notable trends driving market growth?
United Kingdom Held the Largest Market Share.
7. Are there any restraints impacting market growth?
Concerns over the Source and Animal Welfare in Collagen Extraction Limit the Market Growth.
8. Can you provide examples of recent developments in the market?
N/A
9. What pricing options are available for accessing the report?
Pricing options include single-user, multi-user, and enterprise licenses priced at USD 4750, USD 5250, and USD 8750 respectively.
10. Is the market size provided in terms of value or volume?
The market size is provided in terms of value, measured in Million.
11. Are there any specific market keywords associated with the report?
Yes, the market keyword associated with the report is "EU Food Colorant Market," which aids in identifying and referencing the specific market segment covered.
12. How do I determine which pricing option suits my needs best?
The pricing options vary based on user requirements and access needs. Individual users may opt for single-user licenses, while businesses requiring broader access may choose multi-user or enterprise licenses for cost-effective access to the report.
13. Are there any additional resources or data provided in the EU Food Colorant Market report?
While the report offers comprehensive insights, it's advisable to review the specific contents or supplementary materials provided to ascertain if additional resources or data are available.
14. How can I stay updated on further developments or reports in the EU Food Colorant Market?
To stay informed about further developments, trends, and reports in the EU Food Colorant Market, consider subscribing to industry newsletters, following relevant companies and organizations, or regularly checking reputable industry news sources and publications.
Methodology
Step 1 - Identification of Relevant Samples Size from Population Database


Step 2 - Approaches for Defining Global Market Size (Value, Volume* & Price*)

Note*: In applicable scenarios
Step 3 - Data Sources
Primary Research
- Web Analytics
- Survey Reports
- Research Institute
- Latest Research Reports
- Opinion Leaders
Secondary Research
- Annual Reports
- White Paper
- Latest Press Release
- Industry Association
- Paid Database
- Investor Presentations

Step 4 - Data Triangulation
Involves using different sources of information in order to increase the validity of a study
These sources are likely to be stakeholders in a program - participants, other researchers, program staff, other community members, and so on.
Then we put all data in single framework & apply various statistical tools to find out the dynamic on the market.
During the analysis stage, feedback from the stakeholder groups would be compared to determine areas of agreement as well as areas of divergence


