
Key Insights
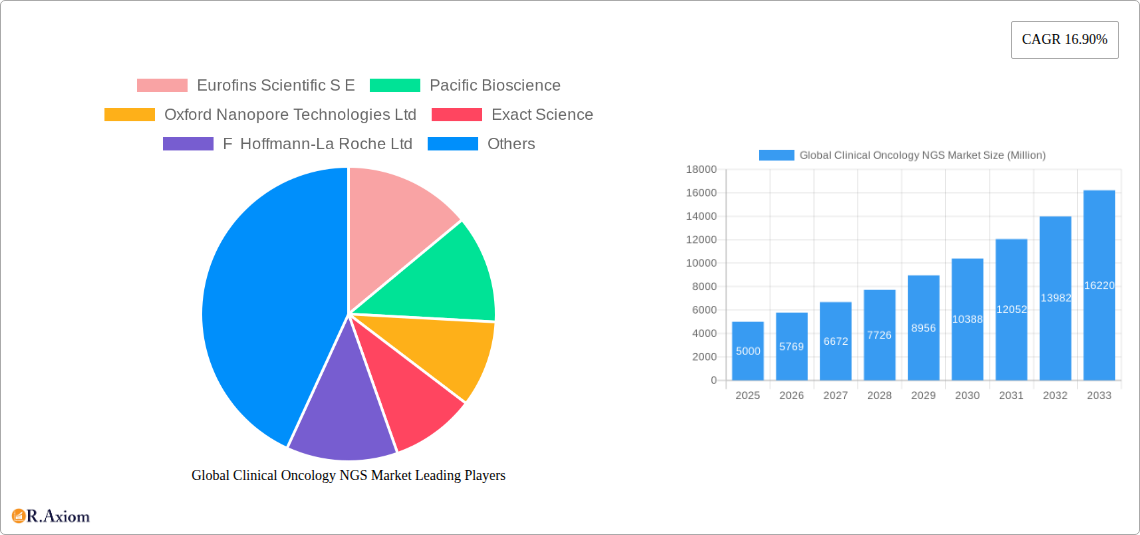
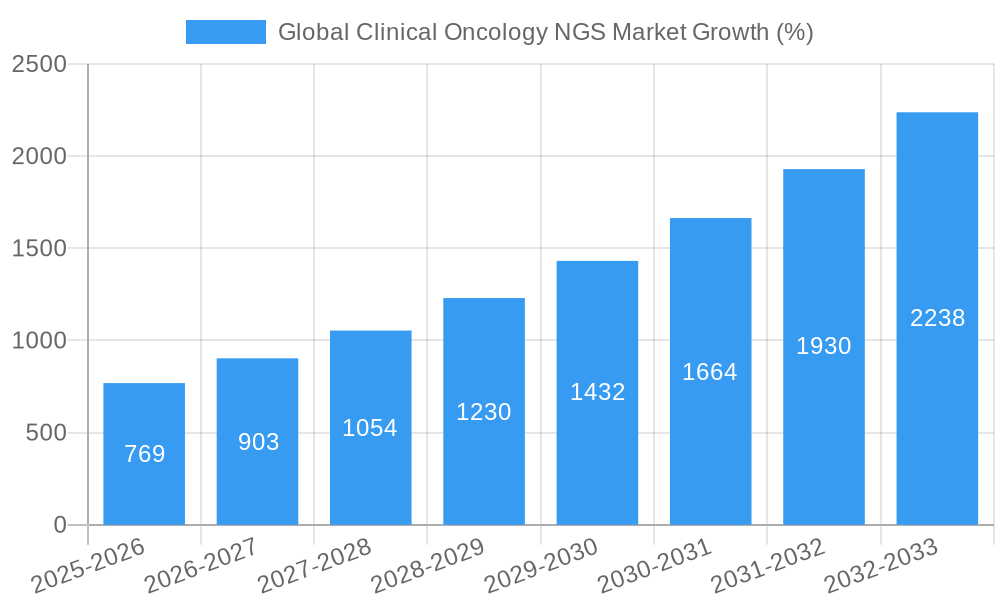
The global clinical oncology next-generation sequencing (NGS) market is experiencing robust growth, driven by the increasing prevalence of cancer, advancements in NGS technologies, and the rising demand for personalized medicine. The market's 16.90% CAGR indicates a significant expansion, projected to reach substantial value by 2033. Key technological drivers include whole-genome sequencing (WGS), whole-exome sequencing (WES), and targeted sequencing, each offering unique advantages for cancer diagnosis and treatment. Workflow advancements, encompassing pre-sequencing sample preparation, efficient sequencing technologies, and sophisticated data analysis pipelines, contribute to faster and more accurate results. The application landscape is diverse, ranging from cancer screening and inherited cancer diagnostics to companion diagnostics for targeted therapies. Hospitals, clinics, and specialized laboratories constitute the primary end-users, demanding reliable and high-throughput NGS solutions. While the market faces certain restraints, including high costs associated with NGS technologies and the need for skilled professionals in data interpretation, the overall market trajectory remains positive, fuelled by continuous innovation and expanding clinical applications. Leading companies, including Illumina, Thermo Fisher Scientific, Roche, and others, are actively investing in R&D and strategic partnerships to strengthen their market position. The regional distribution shows a strong presence in North America and Europe, with Asia Pacific emerging as a rapidly growing market.
The growth is further fueled by the increasing adoption of companion diagnostics, which allows for personalized treatment strategies based on a patient's genomic profile. The integration of NGS into routine clinical oncology workflows is streamlining the diagnostic process and enabling earlier intervention. Moreover, ongoing research and development efforts are leading to more sensitive and cost-effective NGS technologies, making them increasingly accessible to a wider patient population. The competitive landscape is characterized by both established players and emerging companies vying for market share. The continuous innovation in technology, coupled with the growing need for precision oncology solutions, makes the global clinical oncology NGS market a highly attractive and dynamic sector for investment and growth over the next decade.
Global Clinical Oncology NGS Market: A Comprehensive Report (2019-2033)
This detailed report provides a comprehensive analysis of the global clinical oncology next-generation sequencing (NGS) market, offering actionable insights for industry stakeholders. The study period covers 2019-2033, with 2025 as the base and estimated year, and a forecast period of 2025-2033. The report segments the market by technology (Whole Genome Sequencing, Whole Exome Sequencing, Targeted Sequencing & Resequencing), workflow (Pre-Sequencing, Sequencing, Data Analysis), application (Screening, Inherited Cancer, Companion Diagnostics, Other Diagnostics), and end-use (Hospitals, Clinics, Laboratories). Leading players such as Illumina Inc, Thermo Fisher Scientific, Roche, and Qiagen are analyzed, providing a complete market overview. The report's value exceeds xx Million and is expected to reach xx Million by 2033.
Global Clinical Oncology NGS Market Concentration & Innovation
This section analyzes the market concentration, innovation drivers, regulatory landscape, and competitive dynamics within the global clinical oncology NGS market. The market is moderately concentrated, with a few major players holding significant market share. Illumina, for example, holds an estimated xx% market share in 2025, while Thermo Fisher Scientific holds approximately xx%. However, the market is also characterized by a significant number of smaller players and emerging companies introducing innovative solutions.
Market Concentration Metrics:
- Herfindahl-Hirschman Index (HHI): xx (indicating moderate concentration)
- Top 5 players' combined market share: xx%
Innovation Drivers:
- Advancements in sequencing technologies, leading to increased throughput, accuracy, and cost-effectiveness.
- Development of novel bioinformatics tools for data analysis and interpretation.
- Growing adoption of liquid biopsies and minimal invasive techniques.
Regulatory Frameworks & Product Substitutes:
- Stringent regulatory approvals for NGS tests are a key factor influencing market growth. Changes in regulatory frameworks in different regions can significantly impact market dynamics.
- The emergence of alternative diagnostic methods poses a competitive challenge to NGS.
M&A Activities:
- The clinical oncology NGS market has witnessed several significant mergers and acquisitions in recent years, primarily driven by the need to expand product portfolios and geographic reach. Total M&A deal value in the past 5 years is estimated at xx Million.
Global Clinical Oncology NGS Market Industry Trends & Insights
The global clinical oncology NGS market is experiencing robust growth, driven by several key factors. The market registered a CAGR of xx% during the historical period (2019-2024) and is projected to maintain a healthy CAGR of xx% during the forecast period (2025-2033). This growth is fueled by the increasing prevalence of cancer globally, rising demand for personalized medicine, and technological advancements in NGS technology. Market penetration of NGS in oncology is increasing steadily, with an estimated xx% of cancer patients undergoing NGS testing in 2025.
Technological disruptions are transforming the landscape, with improvements in sequencing accuracy, speed, and affordability driving wider adoption. Consumer preferences are shifting towards non-invasive diagnostic methods and faster turnaround times. The competitive dynamics are characterized by intense rivalry among established players and emerging companies vying for market share through product innovation and strategic partnerships.
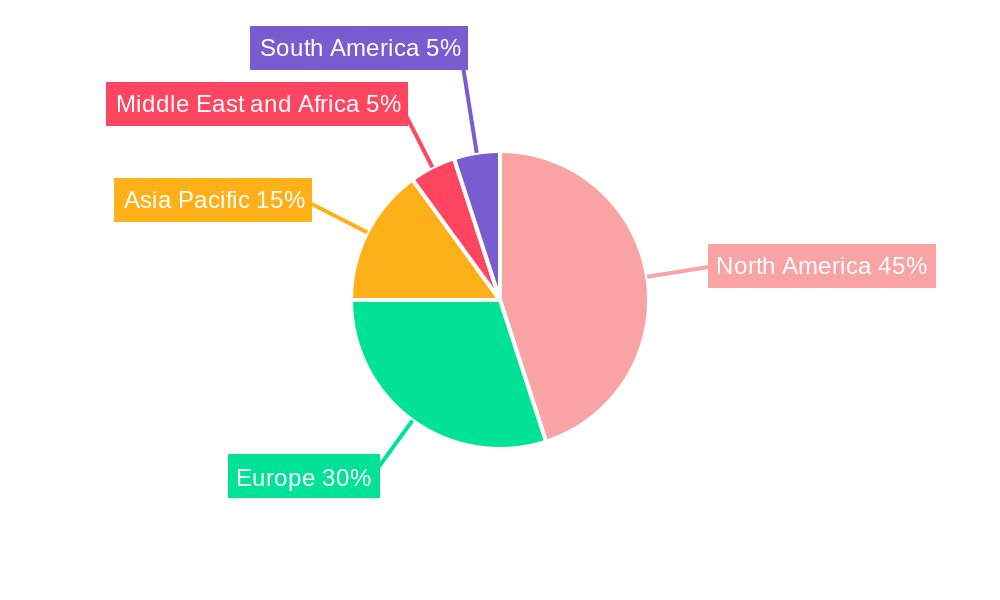
Dominant Markets & Segments in Global Clinical Oncology NGS Market
The North American region currently dominates the global clinical oncology NGS market, followed by Europe and Asia Pacific. Within North America, the United States holds the largest market share, driven by factors such as robust healthcare infrastructure, high per capita healthcare spending, and a large patient pool.
Key Drivers of Regional Dominance:
- North America: Advanced healthcare infrastructure, high per capita healthcare expenditure, early adoption of new technologies, favorable regulatory environment.
- Europe: Increasing government funding for cancer research, growing awareness of personalized medicine.
- Asia Pacific: Rising cancer incidence, increasing healthcare expenditure, growing adoption of NGS technologies in emerging economies.
Dominant Segments:
- Technology: Targeted Sequencing & Resequencing holds the largest market share due to its cost-effectiveness and suitability for specific clinical applications.
- Workflow: Sequencing is the largest segment due to the technological complexity and high cost associated with this stage of the workflow.
- Application: Companion diagnostics represent a rapidly growing segment, driven by the increasing need for personalized cancer treatment.
- End-use: Hospitals and specialized laboratories dominate the market due to their technological capabilities and expertise.
Global Clinical Oncology NGS Market Product Developments
Recent product developments in the clinical oncology NGS market have focused on improving sequencing speed, accuracy, and affordability. Innovations include the development of new sequencing chemistries, improved bioinformatics software, and the integration of NGS platforms with other diagnostic tools. These advancements have enhanced the clinical utility of NGS, making it a more accessible and cost-effective diagnostic tool for broader application in oncology. Companies are focusing on developing user-friendly platforms, improving data analysis capabilities, and streamlining workflows to enhance market penetration.
Report Scope & Segmentation Analysis
This report comprehensively analyzes the global clinical oncology NGS market, segmented by technology, workflow, application, and end-use. Each segment's growth projections, market size, and competitive dynamics are thoroughly examined. For example, the targeted sequencing segment is expected to show significant growth due to its cost-effectiveness and adaptability. The sequencing workflow segment is characterized by high capital expenditure requirements and a dependence on specialized personnel. The companion diagnostics application segment is showing high growth as personalized medicine gains momentum. Finally, hospitals and large reference laboratories dominate the end-user segment.
Key Drivers of Global Clinical Oncology NGS Market Growth
Several factors are driving the growth of the global clinical oncology NGS market. These include:
- Technological advancements: Continuous improvements in sequencing technology, including increased throughput, accuracy, and affordability.
- Rising cancer prevalence: The increasing incidence of cancer globally is driving demand for accurate and efficient diagnostic tools.
- Growth of personalized medicine: The increasing adoption of personalized medicine approaches is boosting the demand for NGS-based diagnostics.
- Favorable regulatory environment: Regulatory approvals for new NGS tests are further accelerating market expansion.
Challenges in the Global Clinical Oncology NGS Market Sector
Despite its growth potential, the clinical oncology NGS market faces several challenges:
- High cost of NGS testing: The high cost of NGS testing can limit access for many patients.
- Complex data analysis: The large amount of data generated by NGS requires sophisticated bioinformatics expertise for analysis and interpretation.
- Regulatory hurdles: Navigating the complex regulatory landscape for NGS tests can be challenging.
- Competition from alternative technologies: The emergence of other diagnostic technologies poses a competitive challenge to NGS.
Emerging Opportunities in Global Clinical Oncology NGS Market
Several emerging opportunities exist within the clinical oncology NGS market:
- Liquid biopsies: The growing use of liquid biopsies as a minimally invasive method for cancer detection is opening up new avenues for NGS application.
- Early cancer detection: NGS-based screening tests for early cancer detection are anticipated to fuel significant growth.
- Expansion into emerging markets: The increasing healthcare expenditure in developing countries presents opportunities for market expansion.
- Development of integrated NGS platforms: Developing combined solutions incorporating NGS with other diagnostics can enhance market penetration.
Leading Players in the Global Clinical Oncology NGS Market Market
- Eurofins Scientific S.E.
- Pacific Biosciences
- Oxford Nanopore Technologies Ltd
- Exact Sciences
- F. Hoffmann-La Roche Ltd
- Qiagen N.V.
- Foundation Medicine
- Myriad Genetics
- Illumina Inc
- Caris Life Sciences
- Thermo Fisher Scientific
- Agilent Technologies
- PerkinElmer
- Beijing Genomics Institute (BGI)
Key Developments in Global Clinical Oncology NGS Market Industry
- January 2023: Illumina launched a new NGS platform with improved throughput and accuracy.
- March 2024: Thermo Fisher Scientific acquired a smaller NGS company specializing in liquid biopsies.
- June 2024: Roche received FDA approval for a new companion diagnostic based on NGS. (Further key developments would be listed here)
Strategic Outlook for Global Clinical Oncology NGS Market Market
The future of the global clinical oncology NGS market looks bright, with continued growth driven by technological advancements, increasing cancer prevalence, and the growing adoption of personalized medicine. The market is expected to experience significant expansion in the coming years, driven by innovations in liquid biopsies, early cancer detection, and the integration of NGS with other diagnostic modalities. Strategic partnerships and collaborations will play a crucial role in shaping the future of the market.
Global Clinical Oncology NGS Market Segmentation
-
1. Technology
- 1.1. Whole Genome Sequencing
- 1.2. Whole Exome Sequencing
- 1.3. Targeted Sequencing & Resequencing Centrifuges
-
2. Workflow
- 2.1. Pre-Sequencing
- 2.2. Data Analysis
-
3. Application
-
3.1. Screening
- 3.1.1. Sporadic Cancer
- 3.1.2. Inherited Cancer
- 3.2. Companion Diagnostics
- 3.3. Other Diagnostics
-
3.1. Screening
-
4. End-use
- 4.1. Hospitals
- 4.2. Clinics
- 4.3. Laboratories
Global Clinical Oncology NGS Market Segmentation By Geography
-
1. North America
- 1.1. United States
- 1.2. Canada
- 1.3. Mexico
-
2. Europe
- 2.1. Germany
- 2.2. United Kingdom
- 2.3. France
- 2.4. Italy
- 2.5. Spain
- 2.6. Rest of Europe
-
3. Asia Pacific
- 3.1. China
- 3.2. Japan
- 3.3. India
- 3.4. Australia
- 3.5. South Korea
- 3.6. Rest of Asia Pacific
-
4. Middle East and Africa
- 4.1. GCC
- 4.2. South Africa
- 4.3. Rest of Middle East and Africa
-
5. South America
- 5.1. Brazil
- 5.2. Argentina
- 5.3. Rest of South America
Global Clinical Oncology NGS Market REPORT HIGHLIGHTS
| Aspects | Details |
|---|---|
| Study Period | 2019-2033 |
| Base Year | 2024 |
| Estimated Year | 2025 |
| Forecast Period | 2025-2033 |
| Historical Period | 2019-2024 |
| Growth Rate | CAGR of 16.90% from 2019-2033 |
| Segmentation |
|
Table of Contents
- 1. Introduction
- 1.1. Research Scope
- 1.2. Market Segmentation
- 1.3. Research Methodology
- 1.4. Definitions and Assumptions
- 2. Executive Summary
- 2.1. Introduction
- 3. Market Dynamics
- 3.1. Introduction
- 3.2. Market Drivers
- 3.2.1. Advancements in the Field of Personalized Medicine; Rising Burden of Cancer; Decrease in Costs for Genetic Sequencing
- 3.3. Market Restrains
- 3.3.1. Lack of computational efficiency for data management; Inadequate Reimbursement Policy
- 3.4. Market Trends
- 3.4.1. Whole Genome Sequencing is Expected to Projected Significant Growth Over the Forecast Period.
- 4. Market Factor Analysis
- 4.1. Porters Five Forces
- 4.2. Supply/Value Chain
- 4.3. PESTEL analysis
- 4.4. Market Entropy
- 4.5. Patent/Trademark Analysis
- 5. Global Clinical Oncology NGS Market Analysis, Insights and Forecast, 2019-2031
- 5.1. Market Analysis, Insights and Forecast - by Technology
- 5.1.1. Whole Genome Sequencing
- 5.1.2. Whole Exome Sequencing
- 5.1.3. Targeted Sequencing & Resequencing Centrifuges
- 5.2. Market Analysis, Insights and Forecast - by Workflow
- 5.2.1. Pre-Sequencing
- 5.2.2. Data Analysis
- 5.3. Market Analysis, Insights and Forecast - by Application
- 5.3.1. Screening
- 5.3.1.1. Sporadic Cancer
- 5.3.1.2. Inherited Cancer
- 5.3.2. Companion Diagnostics
- 5.3.3. Other Diagnostics
- 5.3.1. Screening
- 5.4. Market Analysis, Insights and Forecast - by End-use
- 5.4.1. Hospitals
- 5.4.2. Clinics
- 5.4.3. Laboratories
- 5.5. Market Analysis, Insights and Forecast - by Region
- 5.5.1. North America
- 5.5.2. Europe
- 5.5.3. Asia Pacific
- 5.5.4. Middle East and Africa
- 5.5.5. South America
- 5.1. Market Analysis, Insights and Forecast - by Technology
- 6. North America Global Clinical Oncology NGS Market Analysis, Insights and Forecast, 2019-2031
- 6.1. Market Analysis, Insights and Forecast - by Technology
- 6.1.1. Whole Genome Sequencing
- 6.1.2. Whole Exome Sequencing
- 6.1.3. Targeted Sequencing & Resequencing Centrifuges
- 6.2. Market Analysis, Insights and Forecast - by Workflow
- 6.2.1. Pre-Sequencing
- 6.2.2. Data Analysis
- 6.3. Market Analysis, Insights and Forecast - by Application
- 6.3.1. Screening
- 6.3.1.1. Sporadic Cancer
- 6.3.1.2. Inherited Cancer
- 6.3.2. Companion Diagnostics
- 6.3.3. Other Diagnostics
- 6.3.1. Screening
- 6.4. Market Analysis, Insights and Forecast - by End-use
- 6.4.1. Hospitals
- 6.4.2. Clinics
- 6.4.3. Laboratories
- 6.1. Market Analysis, Insights and Forecast - by Technology
- 7. Europe Global Clinical Oncology NGS Market Analysis, Insights and Forecast, 2019-2031
- 7.1. Market Analysis, Insights and Forecast - by Technology
- 7.1.1. Whole Genome Sequencing
- 7.1.2. Whole Exome Sequencing
- 7.1.3. Targeted Sequencing & Resequencing Centrifuges
- 7.2. Market Analysis, Insights and Forecast - by Workflow
- 7.2.1. Pre-Sequencing
- 7.2.2. Data Analysis
- 7.3. Market Analysis, Insights and Forecast - by Application
- 7.3.1. Screening
- 7.3.1.1. Sporadic Cancer
- 7.3.1.2. Inherited Cancer
- 7.3.2. Companion Diagnostics
- 7.3.3. Other Diagnostics
- 7.3.1. Screening
- 7.4. Market Analysis, Insights and Forecast - by End-use
- 7.4.1. Hospitals
- 7.4.2. Clinics
- 7.4.3. Laboratories
- 7.1. Market Analysis, Insights and Forecast - by Technology
- 8. Asia Pacific Global Clinical Oncology NGS Market Analysis, Insights and Forecast, 2019-2031
- 8.1. Market Analysis, Insights and Forecast - by Technology
- 8.1.1. Whole Genome Sequencing
- 8.1.2. Whole Exome Sequencing
- 8.1.3. Targeted Sequencing & Resequencing Centrifuges
- 8.2. Market Analysis, Insights and Forecast - by Workflow
- 8.2.1. Pre-Sequencing
- 8.2.2. Data Analysis
- 8.3. Market Analysis, Insights and Forecast - by Application
- 8.3.1. Screening
- 8.3.1.1. Sporadic Cancer
- 8.3.1.2. Inherited Cancer
- 8.3.2. Companion Diagnostics
- 8.3.3. Other Diagnostics
- 8.3.1. Screening
- 8.4. Market Analysis, Insights and Forecast - by End-use
- 8.4.1. Hospitals
- 8.4.2. Clinics
- 8.4.3. Laboratories
- 8.1. Market Analysis, Insights and Forecast - by Technology
- 9. Middle East and Africa Global Clinical Oncology NGS Market Analysis, Insights and Forecast, 2019-2031
- 9.1. Market Analysis, Insights and Forecast - by Technology
- 9.1.1. Whole Genome Sequencing
- 9.1.2. Whole Exome Sequencing
- 9.1.3. Targeted Sequencing & Resequencing Centrifuges
- 9.2. Market Analysis, Insights and Forecast - by Workflow
- 9.2.1. Pre-Sequencing
- 9.2.2. Data Analysis
- 9.3. Market Analysis, Insights and Forecast - by Application
- 9.3.1. Screening
- 9.3.1.1. Sporadic Cancer
- 9.3.1.2. Inherited Cancer
- 9.3.2. Companion Diagnostics
- 9.3.3. Other Diagnostics
- 9.3.1. Screening
- 9.4. Market Analysis, Insights and Forecast - by End-use
- 9.4.1. Hospitals
- 9.4.2. Clinics
- 9.4.3. Laboratories
- 9.1. Market Analysis, Insights and Forecast - by Technology
- 10. South America Global Clinical Oncology NGS Market Analysis, Insights and Forecast, 2019-2031
- 10.1. Market Analysis, Insights and Forecast - by Technology
- 10.1.1. Whole Genome Sequencing
- 10.1.2. Whole Exome Sequencing
- 10.1.3. Targeted Sequencing & Resequencing Centrifuges
- 10.2. Market Analysis, Insights and Forecast - by Workflow
- 10.2.1. Pre-Sequencing
- 10.2.2. Data Analysis
- 10.3. Market Analysis, Insights and Forecast - by Application
- 10.3.1. Screening
- 10.3.1.1. Sporadic Cancer
- 10.3.1.2. Inherited Cancer
- 10.3.2. Companion Diagnostics
- 10.3.3. Other Diagnostics
- 10.3.1. Screening
- 10.4. Market Analysis, Insights and Forecast - by End-use
- 10.4.1. Hospitals
- 10.4.2. Clinics
- 10.4.3. Laboratories
- 10.1. Market Analysis, Insights and Forecast - by Technology
- 11. North America Global Clinical Oncology NGS Market Analysis, Insights and Forecast, 2019-2031
- 11.1. Market Analysis, Insights and Forecast - By Country/Sub-region
- 11.1.1 United States
- 11.1.2 Canada
- 11.1.3 Mexico
- 12. Europe Global Clinical Oncology NGS Market Analysis, Insights and Forecast, 2019-2031
- 12.1. Market Analysis, Insights and Forecast - By Country/Sub-region
- 12.1.1 Germany
- 12.1.2 United Kingdom
- 12.1.3 France
- 12.1.4 Italy
- 12.1.5 Spain
- 12.1.6 Rest of Europe
- 13. Asia Pacific Global Clinical Oncology NGS Market Analysis, Insights and Forecast, 2019-2031
- 13.1. Market Analysis, Insights and Forecast - By Country/Sub-region
- 13.1.1 China
- 13.1.2 Japan
- 13.1.3 India
- 13.1.4 Australia
- 13.1.5 South Korea
- 13.1.6 Rest of Asia Pacific
- 14. Middle East and Africa Global Clinical Oncology NGS Market Analysis, Insights and Forecast, 2019-2031
- 14.1. Market Analysis, Insights and Forecast - By Country/Sub-region
- 14.1.1 GCC
- 14.1.2 South Africa
- 14.1.3 Rest of Middle East and Africa
- 15. South America Global Clinical Oncology NGS Market Analysis, Insights and Forecast, 2019-2031
- 15.1. Market Analysis, Insights and Forecast - By Country/Sub-region
- 15.1.1 Brazil
- 15.1.2 Argentina
- 15.1.3 Rest of South America
- 16. Competitive Analysis
- 16.1. Market Share Analysis 2024
- 16.2. Company Profiles
- 16.2.1 Eurofins Scientific S E
- 16.2.1.1. Overview
- 16.2.1.2. Products
- 16.2.1.3. SWOT Analysis
- 16.2.1.4. Recent Developments
- 16.2.1.5. Financials (Based on Availability)
- 16.2.2 Pacific Bioscience
- 16.2.2.1. Overview
- 16.2.2.2. Products
- 16.2.2.3. SWOT Analysis
- 16.2.2.4. Recent Developments
- 16.2.2.5. Financials (Based on Availability)
- 16.2.3 Oxford Nanopore Technologies Ltd
- 16.2.3.1. Overview
- 16.2.3.2. Products
- 16.2.3.3. SWOT Analysis
- 16.2.3.4. Recent Developments
- 16.2.3.5. Financials (Based on Availability)
- 16.2.4 Exact Science
- 16.2.4.1. Overview
- 16.2.4.2. Products
- 16.2.4.3. SWOT Analysis
- 16.2.4.4. Recent Developments
- 16.2.4.5. Financials (Based on Availability)
- 16.2.5 F Hoffmann-La Roche Ltd
- 16.2.5.1. Overview
- 16.2.5.2. Products
- 16.2.5.3. SWOT Analysis
- 16.2.5.4. Recent Developments
- 16.2.5.5. Financials (Based on Availability)
- 16.2.6 Partek Inc
- 16.2.6.1. Overview
- 16.2.6.2. Products
- 16.2.6.3. SWOT Analysis
- 16.2.6.4. Recent Developments
- 16.2.6.5. Financials (Based on Availability)
- 16.2.7 Qiagen N V *List Not Exhaustive
- 16.2.7.1. Overview
- 16.2.7.2. Products
- 16.2.7.3. SWOT Analysis
- 16.2.7.4. Recent Developments
- 16.2.7.5. Financials (Based on Availability)
- 16.2.8 Foundation Medicine
- 16.2.8.1. Overview
- 16.2.8.2. Products
- 16.2.8.3. SWOT Analysis
- 16.2.8.4. Recent Developments
- 16.2.8.5. Financials (Based on Availability)
- 16.2.9 Myriad Genetics
- 16.2.9.1. Overview
- 16.2.9.2. Products
- 16.2.9.3. SWOT Analysis
- 16.2.9.4. Recent Developments
- 16.2.9.5. Financials (Based on Availability)
- 16.2.10 Illumina Inc
- 16.2.10.1. Overview
- 16.2.10.2. Products
- 16.2.10.3. SWOT Analysis
- 16.2.10.4. Recent Developments
- 16.2.10.5. Financials (Based on Availability)
- 16.2.11 Caris Life Sciences
- 16.2.11.1. Overview
- 16.2.11.2. Products
- 16.2.11.3. SWOT Analysis
- 16.2.11.4. Recent Developments
- 16.2.11.5. Financials (Based on Availability)
- 16.2.12 Thermo Fisher Scientific
- 16.2.12.1. Overview
- 16.2.12.2. Products
- 16.2.12.3. SWOT Analysis
- 16.2.12.4. Recent Developments
- 16.2.12.5. Financials (Based on Availability)
- 16.2.13 Agilent Technologies
- 16.2.13.1. Overview
- 16.2.13.2. Products
- 16.2.13.3. SWOT Analysis
- 16.2.13.4. Recent Developments
- 16.2.13.5. Financials (Based on Availability)
- 16.2.14 Perkin Elmer
- 16.2.14.1. Overview
- 16.2.14.2. Products
- 16.2.14.3. SWOT Analysis
- 16.2.14.4. Recent Developments
- 16.2.14.5. Financials (Based on Availability)
- 16.2.15 Beijing Genomics Institute (BGI)
- 16.2.15.1. Overview
- 16.2.15.2. Products
- 16.2.15.3. SWOT Analysis
- 16.2.15.4. Recent Developments
- 16.2.15.5. Financials (Based on Availability)
- 16.2.1 Eurofins Scientific S E
List of Figures
- Figure 1: Global Global Clinical Oncology NGS Market Revenue Breakdown (Million, %) by Region 2024 & 2032
- Figure 2: North America Global Clinical Oncology NGS Market Revenue (Million), by Country 2024 & 2032
- Figure 3: North America Global Clinical Oncology NGS Market Revenue Share (%), by Country 2024 & 2032
- Figure 4: Europe Global Clinical Oncology NGS Market Revenue (Million), by Country 2024 & 2032
- Figure 5: Europe Global Clinical Oncology NGS Market Revenue Share (%), by Country 2024 & 2032
- Figure 6: Asia Pacific Global Clinical Oncology NGS Market Revenue (Million), by Country 2024 & 2032
- Figure 7: Asia Pacific Global Clinical Oncology NGS Market Revenue Share (%), by Country 2024 & 2032
- Figure 8: Middle East and Africa Global Clinical Oncology NGS Market Revenue (Million), by Country 2024 & 2032
- Figure 9: Middle East and Africa Global Clinical Oncology NGS Market Revenue Share (%), by Country 2024 & 2032
- Figure 10: South America Global Clinical Oncology NGS Market Revenue (Million), by Country 2024 & 2032
- Figure 11: South America Global Clinical Oncology NGS Market Revenue Share (%), by Country 2024 & 2032
- Figure 12: North America Global Clinical Oncology NGS Market Revenue (Million), by Technology 2024 & 2032
- Figure 13: North America Global Clinical Oncology NGS Market Revenue Share (%), by Technology 2024 & 2032
- Figure 14: North America Global Clinical Oncology NGS Market Revenue (Million), by Workflow 2024 & 2032
- Figure 15: North America Global Clinical Oncology NGS Market Revenue Share (%), by Workflow 2024 & 2032
- Figure 16: North America Global Clinical Oncology NGS Market Revenue (Million), by Application 2024 & 2032
- Figure 17: North America Global Clinical Oncology NGS Market Revenue Share (%), by Application 2024 & 2032
- Figure 18: North America Global Clinical Oncology NGS Market Revenue (Million), by End-use 2024 & 2032
- Figure 19: North America Global Clinical Oncology NGS Market Revenue Share (%), by End-use 2024 & 2032
- Figure 20: North America Global Clinical Oncology NGS Market Revenue (Million), by Country 2024 & 2032
- Figure 21: North America Global Clinical Oncology NGS Market Revenue Share (%), by Country 2024 & 2032
- Figure 22: Europe Global Clinical Oncology NGS Market Revenue (Million), by Technology 2024 & 2032
- Figure 23: Europe Global Clinical Oncology NGS Market Revenue Share (%), by Technology 2024 & 2032
- Figure 24: Europe Global Clinical Oncology NGS Market Revenue (Million), by Workflow 2024 & 2032
- Figure 25: Europe Global Clinical Oncology NGS Market Revenue Share (%), by Workflow 2024 & 2032
- Figure 26: Europe Global Clinical Oncology NGS Market Revenue (Million), by Application 2024 & 2032
- Figure 27: Europe Global Clinical Oncology NGS Market Revenue Share (%), by Application 2024 & 2032
- Figure 28: Europe Global Clinical Oncology NGS Market Revenue (Million), by End-use 2024 & 2032
- Figure 29: Europe Global Clinical Oncology NGS Market Revenue Share (%), by End-use 2024 & 2032
- Figure 30: Europe Global Clinical Oncology NGS Market Revenue (Million), by Country 2024 & 2032
- Figure 31: Europe Global Clinical Oncology NGS Market Revenue Share (%), by Country 2024 & 2032
- Figure 32: Asia Pacific Global Clinical Oncology NGS Market Revenue (Million), by Technology 2024 & 2032
- Figure 33: Asia Pacific Global Clinical Oncology NGS Market Revenue Share (%), by Technology 2024 & 2032
- Figure 34: Asia Pacific Global Clinical Oncology NGS Market Revenue (Million), by Workflow 2024 & 2032
- Figure 35: Asia Pacific Global Clinical Oncology NGS Market Revenue Share (%), by Workflow 2024 & 2032
- Figure 36: Asia Pacific Global Clinical Oncology NGS Market Revenue (Million), by Application 2024 & 2032
- Figure 37: Asia Pacific Global Clinical Oncology NGS Market Revenue Share (%), by Application 2024 & 2032
- Figure 38: Asia Pacific Global Clinical Oncology NGS Market Revenue (Million), by End-use 2024 & 2032
- Figure 39: Asia Pacific Global Clinical Oncology NGS Market Revenue Share (%), by End-use 2024 & 2032
- Figure 40: Asia Pacific Global Clinical Oncology NGS Market Revenue (Million), by Country 2024 & 2032
- Figure 41: Asia Pacific Global Clinical Oncology NGS Market Revenue Share (%), by Country 2024 & 2032
- Figure 42: Middle East and Africa Global Clinical Oncology NGS Market Revenue (Million), by Technology 2024 & 2032
- Figure 43: Middle East and Africa Global Clinical Oncology NGS Market Revenue Share (%), by Technology 2024 & 2032
- Figure 44: Middle East and Africa Global Clinical Oncology NGS Market Revenue (Million), by Workflow 2024 & 2032
- Figure 45: Middle East and Africa Global Clinical Oncology NGS Market Revenue Share (%), by Workflow 2024 & 2032
- Figure 46: Middle East and Africa Global Clinical Oncology NGS Market Revenue (Million), by Application 2024 & 2032
- Figure 47: Middle East and Africa Global Clinical Oncology NGS Market Revenue Share (%), by Application 2024 & 2032
- Figure 48: Middle East and Africa Global Clinical Oncology NGS Market Revenue (Million), by End-use 2024 & 2032
- Figure 49: Middle East and Africa Global Clinical Oncology NGS Market Revenue Share (%), by End-use 2024 & 2032
- Figure 50: Middle East and Africa Global Clinical Oncology NGS Market Revenue (Million), by Country 2024 & 2032
- Figure 51: Middle East and Africa Global Clinical Oncology NGS Market Revenue Share (%), by Country 2024 & 2032
- Figure 52: South America Global Clinical Oncology NGS Market Revenue (Million), by Technology 2024 & 2032
- Figure 53: South America Global Clinical Oncology NGS Market Revenue Share (%), by Technology 2024 & 2032
- Figure 54: South America Global Clinical Oncology NGS Market Revenue (Million), by Workflow 2024 & 2032
- Figure 55: South America Global Clinical Oncology NGS Market Revenue Share (%), by Workflow 2024 & 2032
- Figure 56: South America Global Clinical Oncology NGS Market Revenue (Million), by Application 2024 & 2032
- Figure 57: South America Global Clinical Oncology NGS Market Revenue Share (%), by Application 2024 & 2032
- Figure 58: South America Global Clinical Oncology NGS Market Revenue (Million), by End-use 2024 & 2032
- Figure 59: South America Global Clinical Oncology NGS Market Revenue Share (%), by End-use 2024 & 2032
- Figure 60: South America Global Clinical Oncology NGS Market Revenue (Million), by Country 2024 & 2032
- Figure 61: South America Global Clinical Oncology NGS Market Revenue Share (%), by Country 2024 & 2032
List of Tables
- Table 1: Global Clinical Oncology NGS Market Revenue Million Forecast, by Region 2019 & 2032
- Table 2: Global Clinical Oncology NGS Market Revenue Million Forecast, by Technology 2019 & 2032
- Table 3: Global Clinical Oncology NGS Market Revenue Million Forecast, by Workflow 2019 & 2032
- Table 4: Global Clinical Oncology NGS Market Revenue Million Forecast, by Application 2019 & 2032
- Table 5: Global Clinical Oncology NGS Market Revenue Million Forecast, by End-use 2019 & 2032
- Table 6: Global Clinical Oncology NGS Market Revenue Million Forecast, by Region 2019 & 2032
- Table 7: Global Clinical Oncology NGS Market Revenue Million Forecast, by Country 2019 & 2032
- Table 8: United States Global Clinical Oncology NGS Market Revenue (Million) Forecast, by Application 2019 & 2032
- Table 9: Canada Global Clinical Oncology NGS Market Revenue (Million) Forecast, by Application 2019 & 2032
- Table 10: Mexico Global Clinical Oncology NGS Market Revenue (Million) Forecast, by Application 2019 & 2032
- Table 11: Global Clinical Oncology NGS Market Revenue Million Forecast, by Country 2019 & 2032
- Table 12: Germany Global Clinical Oncology NGS Market Revenue (Million) Forecast, by Application 2019 & 2032
- Table 13: United Kingdom Global Clinical Oncology NGS Market Revenue (Million) Forecast, by Application 2019 & 2032
- Table 14: France Global Clinical Oncology NGS Market Revenue (Million) Forecast, by Application 2019 & 2032
- Table 15: Italy Global Clinical Oncology NGS Market Revenue (Million) Forecast, by Application 2019 & 2032
- Table 16: Spain Global Clinical Oncology NGS Market Revenue (Million) Forecast, by Application 2019 & 2032
- Table 17: Rest of Europe Global Clinical Oncology NGS Market Revenue (Million) Forecast, by Application 2019 & 2032
- Table 18: Global Clinical Oncology NGS Market Revenue Million Forecast, by Country 2019 & 2032
- Table 19: China Global Clinical Oncology NGS Market Revenue (Million) Forecast, by Application 2019 & 2032
- Table 20: Japan Global Clinical Oncology NGS Market Revenue (Million) Forecast, by Application 2019 & 2032
- Table 21: India Global Clinical Oncology NGS Market Revenue (Million) Forecast, by Application 2019 & 2032
- Table 22: Australia Global Clinical Oncology NGS Market Revenue (Million) Forecast, by Application 2019 & 2032
- Table 23: South Korea Global Clinical Oncology NGS Market Revenue (Million) Forecast, by Application 2019 & 2032
- Table 24: Rest of Asia Pacific Global Clinical Oncology NGS Market Revenue (Million) Forecast, by Application 2019 & 2032
- Table 25: Global Clinical Oncology NGS Market Revenue Million Forecast, by Country 2019 & 2032
- Table 26: GCC Global Clinical Oncology NGS Market Revenue (Million) Forecast, by Application 2019 & 2032
- Table 27: South Africa Global Clinical Oncology NGS Market Revenue (Million) Forecast, by Application 2019 & 2032
- Table 28: Rest of Middle East and Africa Global Clinical Oncology NGS Market Revenue (Million) Forecast, by Application 2019 & 2032
- Table 29: Global Clinical Oncology NGS Market Revenue Million Forecast, by Country 2019 & 2032
- Table 30: Brazil Global Clinical Oncology NGS Market Revenue (Million) Forecast, by Application 2019 & 2032
- Table 31: Argentina Global Clinical Oncology NGS Market Revenue (Million) Forecast, by Application 2019 & 2032
- Table 32: Rest of South America Global Clinical Oncology NGS Market Revenue (Million) Forecast, by Application 2019 & 2032
- Table 33: Global Clinical Oncology NGS Market Revenue Million Forecast, by Technology 2019 & 2032
- Table 34: Global Clinical Oncology NGS Market Revenue Million Forecast, by Workflow 2019 & 2032
- Table 35: Global Clinical Oncology NGS Market Revenue Million Forecast, by Application 2019 & 2032
- Table 36: Global Clinical Oncology NGS Market Revenue Million Forecast, by End-use 2019 & 2032
- Table 37: Global Clinical Oncology NGS Market Revenue Million Forecast, by Country 2019 & 2032
- Table 38: United States Global Clinical Oncology NGS Market Revenue (Million) Forecast, by Application 2019 & 2032
- Table 39: Canada Global Clinical Oncology NGS Market Revenue (Million) Forecast, by Application 2019 & 2032
- Table 40: Mexico Global Clinical Oncology NGS Market Revenue (Million) Forecast, by Application 2019 & 2032
- Table 41: Global Clinical Oncology NGS Market Revenue Million Forecast, by Technology 2019 & 2032
- Table 42: Global Clinical Oncology NGS Market Revenue Million Forecast, by Workflow 2019 & 2032
- Table 43: Global Clinical Oncology NGS Market Revenue Million Forecast, by Application 2019 & 2032
- Table 44: Global Clinical Oncology NGS Market Revenue Million Forecast, by End-use 2019 & 2032
- Table 45: Global Clinical Oncology NGS Market Revenue Million Forecast, by Country 2019 & 2032
- Table 46: Germany Global Clinical Oncology NGS Market Revenue (Million) Forecast, by Application 2019 & 2032
- Table 47: United Kingdom Global Clinical Oncology NGS Market Revenue (Million) Forecast, by Application 2019 & 2032
- Table 48: France Global Clinical Oncology NGS Market Revenue (Million) Forecast, by Application 2019 & 2032
- Table 49: Italy Global Clinical Oncology NGS Market Revenue (Million) Forecast, by Application 2019 & 2032
- Table 50: Spain Global Clinical Oncology NGS Market Revenue (Million) Forecast, by Application 2019 & 2032
- Table 51: Rest of Europe Global Clinical Oncology NGS Market Revenue (Million) Forecast, by Application 2019 & 2032
- Table 52: Global Clinical Oncology NGS Market Revenue Million Forecast, by Technology 2019 & 2032
- Table 53: Global Clinical Oncology NGS Market Revenue Million Forecast, by Workflow 2019 & 2032
- Table 54: Global Clinical Oncology NGS Market Revenue Million Forecast, by Application 2019 & 2032
- Table 55: Global Clinical Oncology NGS Market Revenue Million Forecast, by End-use 2019 & 2032
- Table 56: Global Clinical Oncology NGS Market Revenue Million Forecast, by Country 2019 & 2032
- Table 57: China Global Clinical Oncology NGS Market Revenue (Million) Forecast, by Application 2019 & 2032
- Table 58: Japan Global Clinical Oncology NGS Market Revenue (Million) Forecast, by Application 2019 & 2032
- Table 59: India Global Clinical Oncology NGS Market Revenue (Million) Forecast, by Application 2019 & 2032
- Table 60: Australia Global Clinical Oncology NGS Market Revenue (Million) Forecast, by Application 2019 & 2032
- Table 61: South Korea Global Clinical Oncology NGS Market Revenue (Million) Forecast, by Application 2019 & 2032
- Table 62: Rest of Asia Pacific Global Clinical Oncology NGS Market Revenue (Million) Forecast, by Application 2019 & 2032
- Table 63: Global Clinical Oncology NGS Market Revenue Million Forecast, by Technology 2019 & 2032
- Table 64: Global Clinical Oncology NGS Market Revenue Million Forecast, by Workflow 2019 & 2032
- Table 65: Global Clinical Oncology NGS Market Revenue Million Forecast, by Application 2019 & 2032
- Table 66: Global Clinical Oncology NGS Market Revenue Million Forecast, by End-use 2019 & 2032
- Table 67: Global Clinical Oncology NGS Market Revenue Million Forecast, by Country 2019 & 2032
- Table 68: GCC Global Clinical Oncology NGS Market Revenue (Million) Forecast, by Application 2019 & 2032
- Table 69: South Africa Global Clinical Oncology NGS Market Revenue (Million) Forecast, by Application 2019 & 2032
- Table 70: Rest of Middle East and Africa Global Clinical Oncology NGS Market Revenue (Million) Forecast, by Application 2019 & 2032
- Table 71: Global Clinical Oncology NGS Market Revenue Million Forecast, by Technology 2019 & 2032
- Table 72: Global Clinical Oncology NGS Market Revenue Million Forecast, by Workflow 2019 & 2032
- Table 73: Global Clinical Oncology NGS Market Revenue Million Forecast, by Application 2019 & 2032
- Table 74: Global Clinical Oncology NGS Market Revenue Million Forecast, by End-use 2019 & 2032
- Table 75: Global Clinical Oncology NGS Market Revenue Million Forecast, by Country 2019 & 2032
- Table 76: Brazil Global Clinical Oncology NGS Market Revenue (Million) Forecast, by Application 2019 & 2032
- Table 77: Argentina Global Clinical Oncology NGS Market Revenue (Million) Forecast, by Application 2019 & 2032
- Table 78: Rest of South America Global Clinical Oncology NGS Market Revenue (Million) Forecast, by Application 2019 & 2032
Frequently Asked Questions
1. What is the projected Compound Annual Growth Rate (CAGR) of the Global Clinical Oncology NGS Market?
The projected CAGR is approximately 16.90%.
2. Which companies are prominent players in the Global Clinical Oncology NGS Market?
Key companies in the market include Eurofins Scientific S E, Pacific Bioscience, Oxford Nanopore Technologies Ltd, Exact Science, F Hoffmann-La Roche Ltd, Partek Inc, Qiagen N V *List Not Exhaustive, Foundation Medicine, Myriad Genetics, Illumina Inc, Caris Life Sciences, Thermo Fisher Scientific, Agilent Technologies, Perkin Elmer, Beijing Genomics Institute (BGI).
3. What are the main segments of the Global Clinical Oncology NGS Market?
The market segments include Technology, Workflow, Application, End-use.
4. Can you provide details about the market size?
The market size is estimated to be USD XX Million as of 2022.
5. What are some drivers contributing to market growth?
Advancements in the Field of Personalized Medicine; Rising Burden of Cancer; Decrease in Costs for Genetic Sequencing.
6. What are the notable trends driving market growth?
Whole Genome Sequencing is Expected to Projected Significant Growth Over the Forecast Period..
7. Are there any restraints impacting market growth?
Lack of computational efficiency for data management; Inadequate Reimbursement Policy.
8. Can you provide examples of recent developments in the market?
N/A
9. What pricing options are available for accessing the report?
Pricing options include single-user, multi-user, and enterprise licenses priced at USD 4750, USD 5250, and USD 8750 respectively.
10. Is the market size provided in terms of value or volume?
The market size is provided in terms of value, measured in Million.
11. Are there any specific market keywords associated with the report?
Yes, the market keyword associated with the report is "Global Clinical Oncology NGS Market," which aids in identifying and referencing the specific market segment covered.
12. How do I determine which pricing option suits my needs best?
The pricing options vary based on user requirements and access needs. Individual users may opt for single-user licenses, while businesses requiring broader access may choose multi-user or enterprise licenses for cost-effective access to the report.
13. Are there any additional resources or data provided in the Global Clinical Oncology NGS Market report?
While the report offers comprehensive insights, it's advisable to review the specific contents or supplementary materials provided to ascertain if additional resources or data are available.
14. How can I stay updated on further developments or reports in the Global Clinical Oncology NGS Market?
To stay informed about further developments, trends, and reports in the Global Clinical Oncology NGS Market, consider subscribing to industry newsletters, following relevant companies and organizations, or regularly checking reputable industry news sources and publications.
Methodology
Step 1 - Identification of Relevant Samples Size from Population Database


Step 2 - Approaches for Defining Global Market Size (Value, Volume* & Price*)

Note*: In applicable scenarios
Step 3 - Data Sources
Primary Research
- Web Analytics
- Survey Reports
- Research Institute
- Latest Research Reports
- Opinion Leaders
Secondary Research
- Annual Reports
- White Paper
- Latest Press Release
- Industry Association
- Paid Database
- Investor Presentations

Step 4 - Data Triangulation
Involves using different sources of information in order to increase the validity of a study
These sources are likely to be stakeholders in a program - participants, other researchers, program staff, other community members, and so on.
Then we put all data in single framework & apply various statistical tools to find out the dynamic on the market.
During the analysis stage, feedback from the stakeholder groups would be compared to determine areas of agreement as well as areas of divergence


