
Key Insights
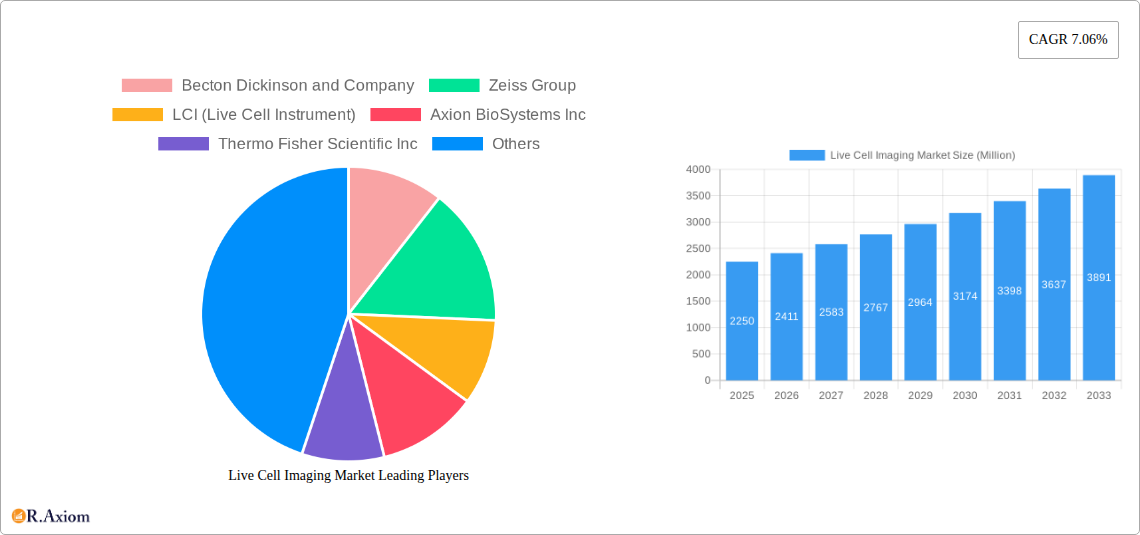
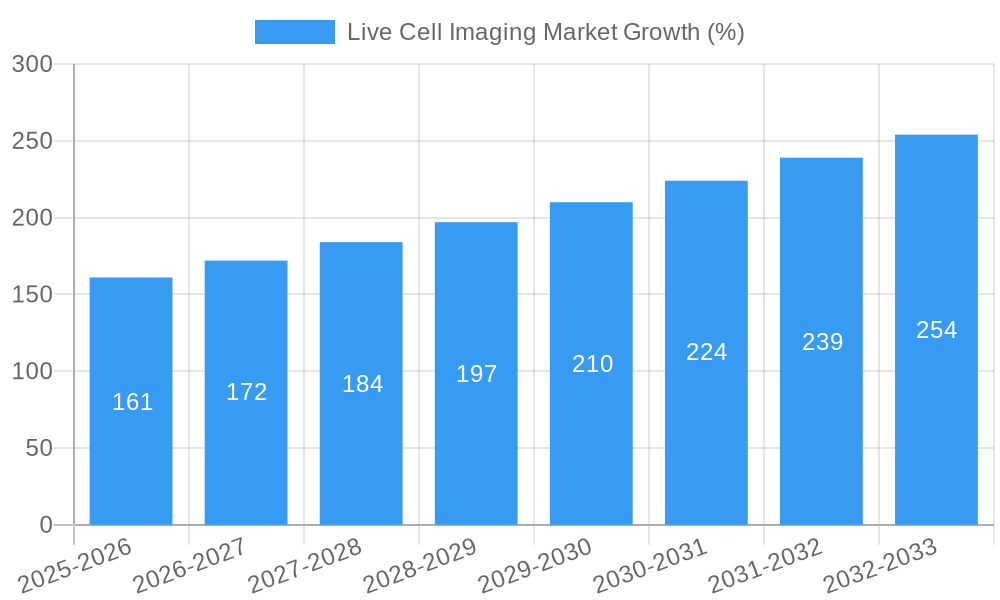
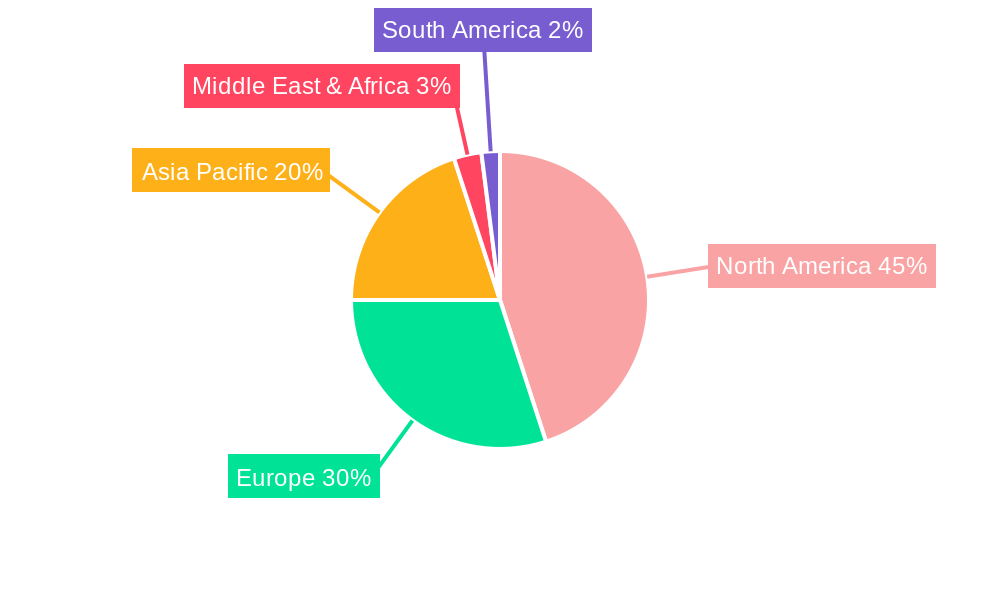
The live cell imaging market, valued at $2.25 billion in 2025, is projected to experience robust growth, driven by a Compound Annual Growth Rate (CAGR) of 7.06% from 2025 to 2033. This expansion is fueled by several key factors. Advancements in imaging technologies, such as super-resolution microscopy and automated imaging systems, are enabling researchers to capture higher-quality images with greater detail and efficiency. The increasing prevalence of chronic diseases like cancer and cardiovascular disease is driving demand for drug discovery and development, significantly boosting the adoption of live cell imaging for preclinical research. Furthermore, the growing adoption of personalized medicine necessitates a deeper understanding of cellular mechanisms, further fueling market growth. The market is segmented by product (equipment, consumables, software & services), application (cell biology, developmental biology, stem cell biology, drug discovery, other applications), and capturing devices. The high cost of advanced equipment and the need for specialized expertise might act as restraints, although the overall market trajectory remains positive. North America currently holds a significant market share due to robust research funding and technological advancements, but the Asia-Pacific region is expected to exhibit the fastest growth rate, driven by increasing healthcare spending and a growing number of research institutions.
The competitive landscape is characterized by several key players, including Becton Dickinson, Zeiss, Thermo Fisher Scientific, Danaher, and others. These companies are actively engaged in research and development to enhance the capabilities of live cell imaging systems and expand their product portfolios. Strategic partnerships and acquisitions are also contributing to market consolidation and innovation. The future of the live cell imaging market looks promising, with opportunities for growth across various segments and geographies. Continued technological innovation, increasing research funding, and the growing need for advanced research tools will drive the market towards substantial expansion in the coming years, potentially reaching a market size exceeding $4 billion by 2033 based on extrapolated CAGR projections. However, it is important to note that market realities can impact these projections.
Live Cell Imaging Market: A Comprehensive Report (2019-2033)
This detailed report provides a comprehensive analysis of the Live Cell Imaging market, covering market size, segmentation, growth drivers, challenges, and key players. The study period spans from 2019 to 2033, with 2025 as the base and estimated year. The report offers actionable insights for stakeholders involved in research, development, and commercialization within this dynamic sector.
Live Cell Imaging Market Market Concentration & Innovation
The Live Cell Imaging market exhibits a moderately concentrated landscape, with several major players holding significant market share. However, the presence of numerous smaller, specialized companies fosters innovation and competition. The market share of the top five players is estimated at xx%, indicating a competitive yet consolidated structure. Innovation is driven by advancements in microscopy techniques, image analysis software, and automation. Regulatory frameworks, particularly those concerning medical device approvals and data privacy, influence market growth. Product substitutes, such as traditional histological techniques, exert limited pressure due to the unique advantages of live cell imaging in visualizing dynamic cellular processes. End-user trends, particularly in research and drug discovery, are pushing demand for higher-resolution, faster, and more automated systems. Mergers and acquisitions (M&A) activity has been moderate in recent years, with deal values averaging xx Million. Key M&A activities include (examples only, specific details would be included in the full report):
- Acquisition of Company A by Company B in 2022 for xx Million, strengthening Company B's position in the software segment.
- Strategic partnership between Company C and Company D in 2023 to jointly develop a novel live cell imaging platform.
Live Cell Imaging Market Industry Trends & Insights
The Live Cell Imaging market is experiencing robust growth, driven by several factors. The compound annual growth rate (CAGR) during the forecast period (2025-2033) is projected to be xx%, reaching a market value of xx Million by 2033. This expansion is fueled by the increasing adoption of live cell imaging in various applications, including drug discovery and developmental biology. Technological disruptions, such as the development of advanced microscopy techniques (e.g., light-sheet microscopy, super-resolution microscopy), are enabling higher-resolution imaging and deeper insights into cellular processes. Consumer preferences are shifting towards integrated systems offering advanced features, automation, and user-friendly software. The competitive dynamics are marked by continuous innovation, strategic partnerships, and the introduction of new products with improved capabilities. Market penetration remains relatively high in developed regions but significant growth potential exists in emerging economies. The penetration rate in developed regions is estimated at xx%, while in emerging regions it is around xx%.
Dominant Markets & Segments in Live Cell Imaging Market
The North American region currently dominates the Live Cell Imaging market, accounting for xx% of the global market share in 2025. This dominance is attributed to:
- High research funding and a strong presence of key players.
- Well-established healthcare infrastructure and a large number of research institutions.
- Favorable regulatory environment and supportive government initiatives.
However, the Asia-Pacific region is expected to witness the highest growth rate in the forecast period due to:
- Growing investments in biotechnology and pharmaceutical research.
- Increasing awareness about the benefits of live cell imaging.
- Expanding healthcare infrastructure and rising disposable incomes.
Segment Dominance:
- By Product: The equipment segment holds the largest market share, due to the high initial investment required for acquiring advanced imaging systems.
- By Application: Drug discovery is the leading application segment, driven by the need to develop new and more effective drugs.
- By Image Capturing Devices: The consumables segment is expected to grow at a faster pace than other segments due to the high consumption rate of consumables in live-cell imaging experiments.
- By Other Consumables: The software and services segment is witnessing strong growth driven by the demand for advanced image analysis tools and data management solutions.
Live Cell Imaging Market Product Developments
Recent product innovations have focused on enhancing image resolution, speed, and automation. The integration of artificial intelligence (AI) and machine learning (ML) is enabling automated image analysis and data interpretation, streamlining workflows and improving efficiency. This trend is exemplified by Nanolive's 3D Cell Explorer 96focus, which incorporates AI-powered digital assays for label-free live cell imaging. The market is seeing a move towards more user-friendly, integrated systems designed to simplify complex imaging experiments. The focus is on developing technologies that minimize phototoxicity and improve the quality and quantity of data generated, increasing the market fit for a wider range of applications.
Report Scope & Segmentation Analysis
This report segments the Live Cell Imaging market based on:
By Product: Equipment (Microscopes, Incubators, etc.) and Consumables (reagents, slides). The equipment segment is expected to grow at a CAGR of xx% during the forecast period.
By Image Capturing Devices: Consumables (e.g., dyes, stains, media) and Other Consumables (e.g., filters, slides). The consumables segment is anticipated to grow at a CAGR of xx%.
By Application: Cell Biology, Developmental Biology, Stem Cell Biology, Drug Discovery, and Other Applications (e.g., toxicology, environmental research). The drug discovery segment is anticipated to grow at a CAGR of xx%.
Key Drivers of Live Cell Imaging Market Growth
Several key factors contribute to the market's growth:
- The increasing prevalence of chronic diseases is driving demand for novel therapeutics. Live cell imaging plays a crucial role in the drug discovery process.
- Advancements in microscopy techniques, enabling higher resolution and faster imaging, are boosting market adoption.
- Growing research funding in life sciences is fueling investment in advanced imaging technologies.
Challenges in the Live Cell Imaging Market Sector
The market faces several challenges:
- The high cost of equipment and consumables can limit accessibility for some researchers.
- The complexity of operating advanced imaging systems may require specialized training.
- Competition from established players and emerging technologies presents a dynamic market landscape.
Emerging Opportunities in Live Cell Imaging Market
The market presents significant opportunities:
- Expanding applications into new areas, such as personalized medicine and regenerative therapies.
- Development of more user-friendly software and AI-powered image analysis tools.
- Growth in emerging markets like Asia-Pacific offers substantial untapped potential.
Leading Players in the Live Cell Imaging Market Market
- Becton Dickinson and Company
- Zeiss Group
- LCI (Live Cell Instrument)
- Axion BioSystems Inc
- Thermo Fisher Scientific Inc
- Danaher (Leica Microsystems)
- Agilent Technologies Inc
- Sartorius AG
- Nikon Corporation Inc
- Olympus Corporation (EVIDENT)
- Merck KGaA (Sigma- Aldrich Corporation)
- PerkinElmer Inc
Key Developments in Live Cell Imaging Market Industry
- June 2023: Nanolive launched the 3D Cell Explorer 96focus, an innovative platform for label-free live cell imaging with AI-powered analysis. This development significantly improves efficiency and reduces costs associated with conventional live cell imaging methods.
- February 2023: Nikon Corporation introduced the Nikon Spatial Array Confocal (NSPARC) detector, enabling high-resolution live tissue imaging with minimal phototoxicity. This enhances the quality and applicability of live cell imaging in various research fields.
Strategic Outlook for Live Cell Imaging Market Market
The Live Cell Imaging market is poised for continued growth driven by technological advancements, expanding applications, and increased research funding. The integration of AI and automation will play a critical role in shaping future market dynamics. New applications in personalized medicine and regenerative therapies, along with the penetration of this technology into emerging markets, present significant opportunities for growth and innovation in the coming decade. The market will continue to witness a high level of competition, with players focused on developing innovative solutions and expanding their market reach.
Live Cell Imaging Market Segmentation
-
1. Product
-
1.1. Equipment
- 1.1.1. Standalone Systems
- 1.1.2. Microscopes
- 1.1.3. Cell Analyzers
- 1.1.4. Image Capturing Devices
-
1.2. Consumables
- 1.2.1. Reagents and Kits
- 1.2.2. Other Consumables
- 1.3. Software and Services
-
1.1. Equipment
-
2. Application
- 2.1. Cell Biology
- 2.2. Developmental Biology
- 2.3. Stem Cell Biology
- 2.4. Drug Discovery
- 2.5. Other Applications
Live Cell Imaging Market Segmentation By Geography
-
1. North America
- 1.1. United States
- 1.2. Canada
- 1.3. Mexico
-
2. Europe
- 2.1. Germany
- 2.2. United Kingdom
- 2.3. France
- 2.4. Italy
- 2.5. Spain
- 2.6. Rest of Europe
-
3. Asia Pacific
- 3.1. China
- 3.2. Japan
- 3.3. India
- 3.4. Australia
- 3.5. South Korea
- 3.6. Rest of Asia Pacific
-
4. Middle East and Africa
- 4.1. GCC
- 4.2. South Africa
- 4.3. Rest of Middle East and Africa
-
5. South America
- 5.1. Brazil
- 5.2. Argentina
- 5.3. Rest of South America
Live Cell Imaging Market REPORT HIGHLIGHTS
| Aspects | Details |
|---|---|
| Study Period | 2019-2033 |
| Base Year | 2024 |
| Estimated Year | 2025 |
| Forecast Period | 2025-2033 |
| Historical Period | 2019-2024 |
| Growth Rate | CAGR of 7.06% from 2019-2033 |
| Segmentation |
|
Table of Contents
- 1. Introduction
- 1.1. Research Scope
- 1.2. Market Segmentation
- 1.3. Research Methodology
- 1.4. Definitions and Assumptions
- 2. Executive Summary
- 2.1. Introduction
- 3. Market Dynamics
- 3.1. Introduction
- 3.2. Market Drivers
- 3.2.1. Adoption of High-content Screening Techniques in Drug Discovery; Rising Prevalence of Chronic Disease Demanding Higher and Quicker Diagnostic Facilities; Government Funding for Cell-based Research
- 3.3. Market Restrains
- 3.3.1. High Cost of High-content Screening Systems; Shortage of Skilled Professionals
- 3.4. Market Trends
- 3.4.1. Standalone Systems Segment is Expected to Hold a Significant Market Share Over the Forecast Period
- 4. Market Factor Analysis
- 4.1. Porters Five Forces
- 4.2. Supply/Value Chain
- 4.3. PESTEL analysis
- 4.4. Market Entropy
- 4.5. Patent/Trademark Analysis
- 5. Global Live Cell Imaging Market Analysis, Insights and Forecast, 2019-2031
- 5.1. Market Analysis, Insights and Forecast - by Product
- 5.1.1. Equipment
- 5.1.1.1. Standalone Systems
- 5.1.1.2. Microscopes
- 5.1.1.3. Cell Analyzers
- 5.1.1.4. Image Capturing Devices
- 5.1.2. Consumables
- 5.1.2.1. Reagents and Kits
- 5.1.2.2. Other Consumables
- 5.1.3. Software and Services
- 5.1.1. Equipment
- 5.2. Market Analysis, Insights and Forecast - by Application
- 5.2.1. Cell Biology
- 5.2.2. Developmental Biology
- 5.2.3. Stem Cell Biology
- 5.2.4. Drug Discovery
- 5.2.5. Other Applications
- 5.3. Market Analysis, Insights and Forecast - by Region
- 5.3.1. North America
- 5.3.2. Europe
- 5.3.3. Asia Pacific
- 5.3.4. Middle East and Africa
- 5.3.5. South America
- 5.1. Market Analysis, Insights and Forecast - by Product
- 6. North America Live Cell Imaging Market Analysis, Insights and Forecast, 2019-2031
- 6.1. Market Analysis, Insights and Forecast - by Product
- 6.1.1. Equipment
- 6.1.1.1. Standalone Systems
- 6.1.1.2. Microscopes
- 6.1.1.3. Cell Analyzers
- 6.1.1.4. Image Capturing Devices
- 6.1.2. Consumables
- 6.1.2.1. Reagents and Kits
- 6.1.2.2. Other Consumables
- 6.1.3. Software and Services
- 6.1.1. Equipment
- 6.2. Market Analysis, Insights and Forecast - by Application
- 6.2.1. Cell Biology
- 6.2.2. Developmental Biology
- 6.2.3. Stem Cell Biology
- 6.2.4. Drug Discovery
- 6.2.5. Other Applications
- 6.1. Market Analysis, Insights and Forecast - by Product
- 7. Europe Live Cell Imaging Market Analysis, Insights and Forecast, 2019-2031
- 7.1. Market Analysis, Insights and Forecast - by Product
- 7.1.1. Equipment
- 7.1.1.1. Standalone Systems
- 7.1.1.2. Microscopes
- 7.1.1.3. Cell Analyzers
- 7.1.1.4. Image Capturing Devices
- 7.1.2. Consumables
- 7.1.2.1. Reagents and Kits
- 7.1.2.2. Other Consumables
- 7.1.3. Software and Services
- 7.1.1. Equipment
- 7.2. Market Analysis, Insights and Forecast - by Application
- 7.2.1. Cell Biology
- 7.2.2. Developmental Biology
- 7.2.3. Stem Cell Biology
- 7.2.4. Drug Discovery
- 7.2.5. Other Applications
- 7.1. Market Analysis, Insights and Forecast - by Product
- 8. Asia Pacific Live Cell Imaging Market Analysis, Insights and Forecast, 2019-2031
- 8.1. Market Analysis, Insights and Forecast - by Product
- 8.1.1. Equipment
- 8.1.1.1. Standalone Systems
- 8.1.1.2. Microscopes
- 8.1.1.3. Cell Analyzers
- 8.1.1.4. Image Capturing Devices
- 8.1.2. Consumables
- 8.1.2.1. Reagents and Kits
- 8.1.2.2. Other Consumables
- 8.1.3. Software and Services
- 8.1.1. Equipment
- 8.2. Market Analysis, Insights and Forecast - by Application
- 8.2.1. Cell Biology
- 8.2.2. Developmental Biology
- 8.2.3. Stem Cell Biology
- 8.2.4. Drug Discovery
- 8.2.5. Other Applications
- 8.1. Market Analysis, Insights and Forecast - by Product
- 9. Middle East and Africa Live Cell Imaging Market Analysis, Insights and Forecast, 2019-2031
- 9.1. Market Analysis, Insights and Forecast - by Product
- 9.1.1. Equipment
- 9.1.1.1. Standalone Systems
- 9.1.1.2. Microscopes
- 9.1.1.3. Cell Analyzers
- 9.1.1.4. Image Capturing Devices
- 9.1.2. Consumables
- 9.1.2.1. Reagents and Kits
- 9.1.2.2. Other Consumables
- 9.1.3. Software and Services
- 9.1.1. Equipment
- 9.2. Market Analysis, Insights and Forecast - by Application
- 9.2.1. Cell Biology
- 9.2.2. Developmental Biology
- 9.2.3. Stem Cell Biology
- 9.2.4. Drug Discovery
- 9.2.5. Other Applications
- 9.1. Market Analysis, Insights and Forecast - by Product
- 10. South America Live Cell Imaging Market Analysis, Insights and Forecast, 2019-2031
- 10.1. Market Analysis, Insights and Forecast - by Product
- 10.1.1. Equipment
- 10.1.1.1. Standalone Systems
- 10.1.1.2. Microscopes
- 10.1.1.3. Cell Analyzers
- 10.1.1.4. Image Capturing Devices
- 10.1.2. Consumables
- 10.1.2.1. Reagents and Kits
- 10.1.2.2. Other Consumables
- 10.1.3. Software and Services
- 10.1.1. Equipment
- 10.2. Market Analysis, Insights and Forecast - by Application
- 10.2.1. Cell Biology
- 10.2.2. Developmental Biology
- 10.2.3. Stem Cell Biology
- 10.2.4. Drug Discovery
- 10.2.5. Other Applications
- 10.1. Market Analysis, Insights and Forecast - by Product
- 11. North America Live Cell Imaging Market Analysis, Insights and Forecast, 2019-2031
- 11.1. Market Analysis, Insights and Forecast - By Country/Sub-region
- 11.1.1 United States
- 11.1.2 Canada
- 11.1.3 Mexico
- 12. Europe Live Cell Imaging Market Analysis, Insights and Forecast, 2019-2031
- 12.1. Market Analysis, Insights and Forecast - By Country/Sub-region
- 12.1.1 Germany
- 12.1.2 United Kingdom
- 12.1.3 France
- 12.1.4 Italy
- 12.1.5 Spain
- 12.1.6 Rest of Europe
- 13. Asia Pacific Live Cell Imaging Market Analysis, Insights and Forecast, 2019-2031
- 13.1. Market Analysis, Insights and Forecast - By Country/Sub-region
- 13.1.1 China
- 13.1.2 Japan
- 13.1.3 India
- 13.1.4 Australia
- 13.1.5 South Korea
- 13.1.6 Rest of Asia Pacific
- 14. Middle East and Africa Live Cell Imaging Market Analysis, Insights and Forecast, 2019-2031
- 14.1. Market Analysis, Insights and Forecast - By Country/Sub-region
- 14.1.1 GCC
- 14.1.2 South Africa
- 14.1.3 Rest of Middle East and Africa
- 15. South America Live Cell Imaging Market Analysis, Insights and Forecast, 2019-2031
- 15.1. Market Analysis, Insights and Forecast - By Country/Sub-region
- 15.1.1 Brazil
- 15.1.2 Argentina
- 15.1.3 Rest of South America
- 16. Competitive Analysis
- 16.1. Global Market Share Analysis 2024
- 16.2. Company Profiles
- 16.2.1 Becton Dickinson and Company
- 16.2.1.1. Overview
- 16.2.1.2. Products
- 16.2.1.3. SWOT Analysis
- 16.2.1.4. Recent Developments
- 16.2.1.5. Financials (Based on Availability)
- 16.2.2 Zeiss Group
- 16.2.2.1. Overview
- 16.2.2.2. Products
- 16.2.2.3. SWOT Analysis
- 16.2.2.4. Recent Developments
- 16.2.2.5. Financials (Based on Availability)
- 16.2.3 LCI (Live Cell Instrument)
- 16.2.3.1. Overview
- 16.2.3.2. Products
- 16.2.3.3. SWOT Analysis
- 16.2.3.4. Recent Developments
- 16.2.3.5. Financials (Based on Availability)
- 16.2.4 Axion BioSystems Inc
- 16.2.4.1. Overview
- 16.2.4.2. Products
- 16.2.4.3. SWOT Analysis
- 16.2.4.4. Recent Developments
- 16.2.4.5. Financials (Based on Availability)
- 16.2.5 Thermo Fisher Scientific Inc
- 16.2.5.1. Overview
- 16.2.5.2. Products
- 16.2.5.3. SWOT Analysis
- 16.2.5.4. Recent Developments
- 16.2.5.5. Financials (Based on Availability)
- 16.2.6 Danaher (Leica Microsystems)
- 16.2.6.1. Overview
- 16.2.6.2. Products
- 16.2.6.3. SWOT Analysis
- 16.2.6.4. Recent Developments
- 16.2.6.5. Financials (Based on Availability)
- 16.2.7 Agilent Technologies Inc
- 16.2.7.1. Overview
- 16.2.7.2. Products
- 16.2.7.3. SWOT Analysis
- 16.2.7.4. Recent Developments
- 16.2.7.5. Financials (Based on Availability)
- 16.2.8 Sartorius AG*List Not Exhaustive
- 16.2.8.1. Overview
- 16.2.8.2. Products
- 16.2.8.3. SWOT Analysis
- 16.2.8.4. Recent Developments
- 16.2.8.5. Financials (Based on Availability)
- 16.2.9 Nikon Corporation Inc
- 16.2.9.1. Overview
- 16.2.9.2. Products
- 16.2.9.3. SWOT Analysis
- 16.2.9.4. Recent Developments
- 16.2.9.5. Financials (Based on Availability)
- 16.2.10 Olympus Corporation (EVIDENT)
- 16.2.10.1. Overview
- 16.2.10.2. Products
- 16.2.10.3. SWOT Analysis
- 16.2.10.4. Recent Developments
- 16.2.10.5. Financials (Based on Availability)
- 16.2.11 Merck KGaA (Sigma- Aldrich Corporation)
- 16.2.11.1. Overview
- 16.2.11.2. Products
- 16.2.11.3. SWOT Analysis
- 16.2.11.4. Recent Developments
- 16.2.11.5. Financials (Based on Availability)
- 16.2.12 PerkinElmer Inc
- 16.2.12.1. Overview
- 16.2.12.2. Products
- 16.2.12.3. SWOT Analysis
- 16.2.12.4. Recent Developments
- 16.2.12.5. Financials (Based on Availability)
- 16.2.1 Becton Dickinson and Company
List of Figures
- Figure 1: Global Live Cell Imaging Market Revenue Breakdown (Million, %) by Region 2024 & 2032
- Figure 2: North America Live Cell Imaging Market Revenue (Million), by Country 2024 & 2032
- Figure 3: North America Live Cell Imaging Market Revenue Share (%), by Country 2024 & 2032
- Figure 4: Europe Live Cell Imaging Market Revenue (Million), by Country 2024 & 2032
- Figure 5: Europe Live Cell Imaging Market Revenue Share (%), by Country 2024 & 2032
- Figure 6: Asia Pacific Live Cell Imaging Market Revenue (Million), by Country 2024 & 2032
- Figure 7: Asia Pacific Live Cell Imaging Market Revenue Share (%), by Country 2024 & 2032
- Figure 8: Middle East and Africa Live Cell Imaging Market Revenue (Million), by Country 2024 & 2032
- Figure 9: Middle East and Africa Live Cell Imaging Market Revenue Share (%), by Country 2024 & 2032
- Figure 10: South America Live Cell Imaging Market Revenue (Million), by Country 2024 & 2032
- Figure 11: South America Live Cell Imaging Market Revenue Share (%), by Country 2024 & 2032
- Figure 12: North America Live Cell Imaging Market Revenue (Million), by Product 2024 & 2032
- Figure 13: North America Live Cell Imaging Market Revenue Share (%), by Product 2024 & 2032
- Figure 14: North America Live Cell Imaging Market Revenue (Million), by Application 2024 & 2032
- Figure 15: North America Live Cell Imaging Market Revenue Share (%), by Application 2024 & 2032
- Figure 16: North America Live Cell Imaging Market Revenue (Million), by Country 2024 & 2032
- Figure 17: North America Live Cell Imaging Market Revenue Share (%), by Country 2024 & 2032
- Figure 18: Europe Live Cell Imaging Market Revenue (Million), by Product 2024 & 2032
- Figure 19: Europe Live Cell Imaging Market Revenue Share (%), by Product 2024 & 2032
- Figure 20: Europe Live Cell Imaging Market Revenue (Million), by Application 2024 & 2032
- Figure 21: Europe Live Cell Imaging Market Revenue Share (%), by Application 2024 & 2032
- Figure 22: Europe Live Cell Imaging Market Revenue (Million), by Country 2024 & 2032
- Figure 23: Europe Live Cell Imaging Market Revenue Share (%), by Country 2024 & 2032
- Figure 24: Asia Pacific Live Cell Imaging Market Revenue (Million), by Product 2024 & 2032
- Figure 25: Asia Pacific Live Cell Imaging Market Revenue Share (%), by Product 2024 & 2032
- Figure 26: Asia Pacific Live Cell Imaging Market Revenue (Million), by Application 2024 & 2032
- Figure 27: Asia Pacific Live Cell Imaging Market Revenue Share (%), by Application 2024 & 2032
- Figure 28: Asia Pacific Live Cell Imaging Market Revenue (Million), by Country 2024 & 2032
- Figure 29: Asia Pacific Live Cell Imaging Market Revenue Share (%), by Country 2024 & 2032
- Figure 30: Middle East and Africa Live Cell Imaging Market Revenue (Million), by Product 2024 & 2032
- Figure 31: Middle East and Africa Live Cell Imaging Market Revenue Share (%), by Product 2024 & 2032
- Figure 32: Middle East and Africa Live Cell Imaging Market Revenue (Million), by Application 2024 & 2032
- Figure 33: Middle East and Africa Live Cell Imaging Market Revenue Share (%), by Application 2024 & 2032
- Figure 34: Middle East and Africa Live Cell Imaging Market Revenue (Million), by Country 2024 & 2032
- Figure 35: Middle East and Africa Live Cell Imaging Market Revenue Share (%), by Country 2024 & 2032
- Figure 36: South America Live Cell Imaging Market Revenue (Million), by Product 2024 & 2032
- Figure 37: South America Live Cell Imaging Market Revenue Share (%), by Product 2024 & 2032
- Figure 38: South America Live Cell Imaging Market Revenue (Million), by Application 2024 & 2032
- Figure 39: South America Live Cell Imaging Market Revenue Share (%), by Application 2024 & 2032
- Figure 40: South America Live Cell Imaging Market Revenue (Million), by Country 2024 & 2032
- Figure 41: South America Live Cell Imaging Market Revenue Share (%), by Country 2024 & 2032
List of Tables
- Table 1: Global Live Cell Imaging Market Revenue Million Forecast, by Region 2019 & 2032
- Table 2: Global Live Cell Imaging Market Revenue Million Forecast, by Product 2019 & 2032
- Table 3: Global Live Cell Imaging Market Revenue Million Forecast, by Application 2019 & 2032
- Table 4: Global Live Cell Imaging Market Revenue Million Forecast, by Region 2019 & 2032
- Table 5: Global Live Cell Imaging Market Revenue Million Forecast, by Country 2019 & 2032
- Table 6: United States Live Cell Imaging Market Revenue (Million) Forecast, by Application 2019 & 2032
- Table 7: Canada Live Cell Imaging Market Revenue (Million) Forecast, by Application 2019 & 2032
- Table 8: Mexico Live Cell Imaging Market Revenue (Million) Forecast, by Application 2019 & 2032
- Table 9: Global Live Cell Imaging Market Revenue Million Forecast, by Country 2019 & 2032
- Table 10: Germany Live Cell Imaging Market Revenue (Million) Forecast, by Application 2019 & 2032
- Table 11: United Kingdom Live Cell Imaging Market Revenue (Million) Forecast, by Application 2019 & 2032
- Table 12: France Live Cell Imaging Market Revenue (Million) Forecast, by Application 2019 & 2032
- Table 13: Italy Live Cell Imaging Market Revenue (Million) Forecast, by Application 2019 & 2032
- Table 14: Spain Live Cell Imaging Market Revenue (Million) Forecast, by Application 2019 & 2032
- Table 15: Rest of Europe Live Cell Imaging Market Revenue (Million) Forecast, by Application 2019 & 2032
- Table 16: Global Live Cell Imaging Market Revenue Million Forecast, by Country 2019 & 2032
- Table 17: China Live Cell Imaging Market Revenue (Million) Forecast, by Application 2019 & 2032
- Table 18: Japan Live Cell Imaging Market Revenue (Million) Forecast, by Application 2019 & 2032
- Table 19: India Live Cell Imaging Market Revenue (Million) Forecast, by Application 2019 & 2032
- Table 20: Australia Live Cell Imaging Market Revenue (Million) Forecast, by Application 2019 & 2032
- Table 21: South Korea Live Cell Imaging Market Revenue (Million) Forecast, by Application 2019 & 2032
- Table 22: Rest of Asia Pacific Live Cell Imaging Market Revenue (Million) Forecast, by Application 2019 & 2032
- Table 23: Global Live Cell Imaging Market Revenue Million Forecast, by Country 2019 & 2032
- Table 24: GCC Live Cell Imaging Market Revenue (Million) Forecast, by Application 2019 & 2032
- Table 25: South Africa Live Cell Imaging Market Revenue (Million) Forecast, by Application 2019 & 2032
- Table 26: Rest of Middle East and Africa Live Cell Imaging Market Revenue (Million) Forecast, by Application 2019 & 2032
- Table 27: Global Live Cell Imaging Market Revenue Million Forecast, by Country 2019 & 2032
- Table 28: Brazil Live Cell Imaging Market Revenue (Million) Forecast, by Application 2019 & 2032
- Table 29: Argentina Live Cell Imaging Market Revenue (Million) Forecast, by Application 2019 & 2032
- Table 30: Rest of South America Live Cell Imaging Market Revenue (Million) Forecast, by Application 2019 & 2032
- Table 31: Global Live Cell Imaging Market Revenue Million Forecast, by Product 2019 & 2032
- Table 32: Global Live Cell Imaging Market Revenue Million Forecast, by Application 2019 & 2032
- Table 33: Global Live Cell Imaging Market Revenue Million Forecast, by Country 2019 & 2032
- Table 34: United States Live Cell Imaging Market Revenue (Million) Forecast, by Application 2019 & 2032
- Table 35: Canada Live Cell Imaging Market Revenue (Million) Forecast, by Application 2019 & 2032
- Table 36: Mexico Live Cell Imaging Market Revenue (Million) Forecast, by Application 2019 & 2032
- Table 37: Global Live Cell Imaging Market Revenue Million Forecast, by Product 2019 & 2032
- Table 38: Global Live Cell Imaging Market Revenue Million Forecast, by Application 2019 & 2032
- Table 39: Global Live Cell Imaging Market Revenue Million Forecast, by Country 2019 & 2032
- Table 40: Germany Live Cell Imaging Market Revenue (Million) Forecast, by Application 2019 & 2032
- Table 41: United Kingdom Live Cell Imaging Market Revenue (Million) Forecast, by Application 2019 & 2032
- Table 42: France Live Cell Imaging Market Revenue (Million) Forecast, by Application 2019 & 2032
- Table 43: Italy Live Cell Imaging Market Revenue (Million) Forecast, by Application 2019 & 2032
- Table 44: Spain Live Cell Imaging Market Revenue (Million) Forecast, by Application 2019 & 2032
- Table 45: Rest of Europe Live Cell Imaging Market Revenue (Million) Forecast, by Application 2019 & 2032
- Table 46: Global Live Cell Imaging Market Revenue Million Forecast, by Product 2019 & 2032
- Table 47: Global Live Cell Imaging Market Revenue Million Forecast, by Application 2019 & 2032
- Table 48: Global Live Cell Imaging Market Revenue Million Forecast, by Country 2019 & 2032
- Table 49: China Live Cell Imaging Market Revenue (Million) Forecast, by Application 2019 & 2032
- Table 50: Japan Live Cell Imaging Market Revenue (Million) Forecast, by Application 2019 & 2032
- Table 51: India Live Cell Imaging Market Revenue (Million) Forecast, by Application 2019 & 2032
- Table 52: Australia Live Cell Imaging Market Revenue (Million) Forecast, by Application 2019 & 2032
- Table 53: South Korea Live Cell Imaging Market Revenue (Million) Forecast, by Application 2019 & 2032
- Table 54: Rest of Asia Pacific Live Cell Imaging Market Revenue (Million) Forecast, by Application 2019 & 2032
- Table 55: Global Live Cell Imaging Market Revenue Million Forecast, by Product 2019 & 2032
- Table 56: Global Live Cell Imaging Market Revenue Million Forecast, by Application 2019 & 2032
- Table 57: Global Live Cell Imaging Market Revenue Million Forecast, by Country 2019 & 2032
- Table 58: GCC Live Cell Imaging Market Revenue (Million) Forecast, by Application 2019 & 2032
- Table 59: South Africa Live Cell Imaging Market Revenue (Million) Forecast, by Application 2019 & 2032
- Table 60: Rest of Middle East and Africa Live Cell Imaging Market Revenue (Million) Forecast, by Application 2019 & 2032
- Table 61: Global Live Cell Imaging Market Revenue Million Forecast, by Product 2019 & 2032
- Table 62: Global Live Cell Imaging Market Revenue Million Forecast, by Application 2019 & 2032
- Table 63: Global Live Cell Imaging Market Revenue Million Forecast, by Country 2019 & 2032
- Table 64: Brazil Live Cell Imaging Market Revenue (Million) Forecast, by Application 2019 & 2032
- Table 65: Argentina Live Cell Imaging Market Revenue (Million) Forecast, by Application 2019 & 2032
- Table 66: Rest of South America Live Cell Imaging Market Revenue (Million) Forecast, by Application 2019 & 2032
Frequently Asked Questions
1. What is the projected Compound Annual Growth Rate (CAGR) of the Live Cell Imaging Market?
The projected CAGR is approximately 7.06%.
2. Which companies are prominent players in the Live Cell Imaging Market?
Key companies in the market include Becton Dickinson and Company, Zeiss Group, LCI (Live Cell Instrument), Axion BioSystems Inc, Thermo Fisher Scientific Inc, Danaher (Leica Microsystems), Agilent Technologies Inc, Sartorius AG*List Not Exhaustive, Nikon Corporation Inc, Olympus Corporation (EVIDENT), Merck KGaA (Sigma- Aldrich Corporation), PerkinElmer Inc.
3. What are the main segments of the Live Cell Imaging Market?
The market segments include Product, Application.
4. Can you provide details about the market size?
The market size is estimated to be USD 2.25 Million as of 2022.
5. What are some drivers contributing to market growth?
Adoption of High-content Screening Techniques in Drug Discovery; Rising Prevalence of Chronic Disease Demanding Higher and Quicker Diagnostic Facilities; Government Funding for Cell-based Research.
6. What are the notable trends driving market growth?
Standalone Systems Segment is Expected to Hold a Significant Market Share Over the Forecast Period.
7. Are there any restraints impacting market growth?
High Cost of High-content Screening Systems; Shortage of Skilled Professionals.
8. Can you provide examples of recent developments in the market?
June 2023: Nanolive launched the 3D Cell Explorer 96focus, an innovative platform that brings unlimited high content analysis to label-free live cell imaging without the need for labeling. With the aid of AI-powered digital assays and an automated workflow, the 3D Cell Explorer 96focus streamlines the imaging process, offering researchers a cost-effective and reliable means of conducting cell imaging experiments.
9. What pricing options are available for accessing the report?
Pricing options include single-user, multi-user, and enterprise licenses priced at USD 4750, USD 5250, and USD 8750 respectively.
10. Is the market size provided in terms of value or volume?
The market size is provided in terms of value, measured in Million.
11. Are there any specific market keywords associated with the report?
Yes, the market keyword associated with the report is "Live Cell Imaging Market," which aids in identifying and referencing the specific market segment covered.
12. How do I determine which pricing option suits my needs best?
The pricing options vary based on user requirements and access needs. Individual users may opt for single-user licenses, while businesses requiring broader access may choose multi-user or enterprise licenses for cost-effective access to the report.
13. Are there any additional resources or data provided in the Live Cell Imaging Market report?
While the report offers comprehensive insights, it's advisable to review the specific contents or supplementary materials provided to ascertain if additional resources or data are available.
14. How can I stay updated on further developments or reports in the Live Cell Imaging Market?
To stay informed about further developments, trends, and reports in the Live Cell Imaging Market, consider subscribing to industry newsletters, following relevant companies and organizations, or regularly checking reputable industry news sources and publications.
Methodology
Step 1 - Identification of Relevant Samples Size from Population Database


Step 2 - Approaches for Defining Global Market Size (Value, Volume* & Price*)

Note*: In applicable scenarios
Step 3 - Data Sources
Primary Research
- Web Analytics
- Survey Reports
- Research Institute
- Latest Research Reports
- Opinion Leaders
Secondary Research
- Annual Reports
- White Paper
- Latest Press Release
- Industry Association
- Paid Database
- Investor Presentations

Step 4 - Data Triangulation
Involves using different sources of information in order to increase the validity of a study
These sources are likely to be stakeholders in a program - participants, other researchers, program staff, other community members, and so on.
Then we put all data in single framework & apply various statistical tools to find out the dynamic on the market.
During the analysis stage, feedback from the stakeholder groups would be compared to determine areas of agreement as well as areas of divergence


