
Key Insights
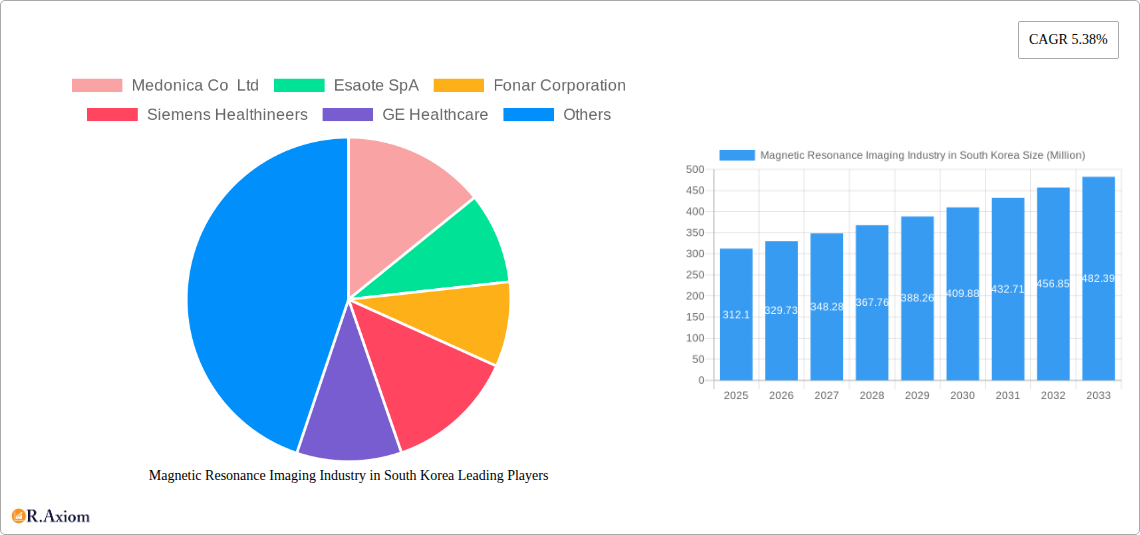
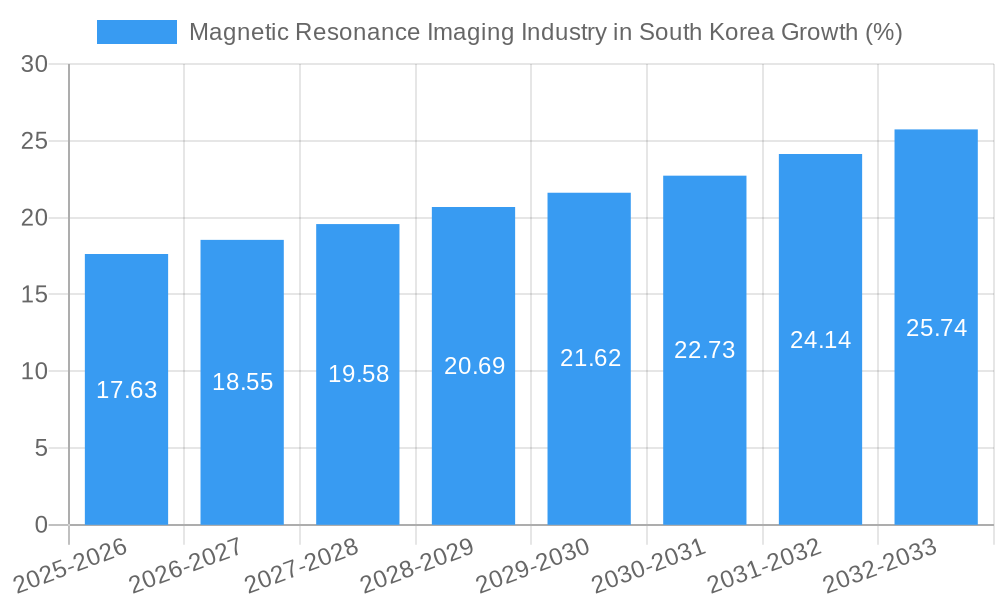
The South Korean Magnetic Resonance Imaging (MRI) market, valued at $312.10 million in 2025, is projected to experience robust growth, driven by factors such as increasing prevalence of chronic diseases necessitating advanced diagnostic imaging, rising healthcare expenditure, and government initiatives promoting technological advancements in healthcare. The market's Compound Annual Growth Rate (CAGR) of 5.38% from 2025 to 2033 indicates a steady expansion, with significant contributions anticipated from all market segments. High-field and ultra-high-field MRI systems are expected to witness higher demand due to their superior imaging capabilities, leading to earlier and more accurate diagnoses. The application segments, particularly oncology, neurology, and cardiology, are driving significant growth due to the increasing incidence of related diseases in the aging South Korean population. Technological advancements focusing on faster scan times, improved image quality, and reduced claustrophobia in open MRI systems are further fueling market expansion. While challenges exist, such as high equipment costs and the need for skilled technicians, the overall outlook remains positive, fueled by continuous innovation and increasing healthcare awareness among the population.
The segmentation analysis reveals a diverse market structure. The closed MRI systems segment holds a larger market share currently, but open MRI systems are experiencing faster growth rates driven by patient comfort needs. Similarly, high-field and ultra-high-field MRI systems are expected to capture a growing market share due to technological advancements offering superior resolution and improved diagnostic capabilities. Within applications, oncology, neurology, and cardiology dominate, reflecting the prevalent health concerns within the country. Competitive forces are strong, with both international giants like Siemens Healthineers, GE Healthcare, and Philips, and domestic players like Medonica Co Ltd, competing intensely. This competition drives innovation and accessibility, further strengthening market growth. The focus on minimally invasive procedures and improved patient outcomes underscores the long-term growth prospects of the South Korean MRI market.
Magnetic Resonance Imaging (MRI) Industry in South Korea: A Comprehensive Market Report (2019-2033)
This in-depth report provides a comprehensive analysis of the Magnetic Resonance Imaging (MRI) industry in South Korea, covering the period from 2019 to 2033. It offers valuable insights into market dynamics, segmentation, key players, and future growth prospects, making it an essential resource for industry stakeholders, investors, and strategic decision-makers. The report leverages extensive market research and data analysis to deliver actionable intelligence and forecasts.
Magnetic Resonance Imaging Industry in South Korea Market Concentration & Innovation
The South Korean MRI market exhibits a moderately concentrated landscape, with a handful of global giants and a few domestic players controlling a significant portion of the market share. While precise market share data for each company is proprietary and varies year-to-year, estimates suggest that Siemens Healthineers, GE Healthcare, and Koninklijke Philips NV hold substantial market share. Smaller players like Medonica Co Ltd, Esaote SpA, Fonar Corporation, Neusoft Medical Systems Co Ltd, Canon Medical Systems Corporation, and Fujifilm Holdings Corporation compete for the remaining share, often specializing in niche segments or specific technologies.
Innovation in the South Korean MRI market is driven by several factors including:
- Technological advancements: Focus on higher field strength systems (e.g., 3T and above), improved image quality, faster scan times, and AI-powered diagnostic tools.
- Government regulations: Stringent regulatory approvals and quality standards incentivize companies to develop advanced technologies.
- Rising healthcare expenditure: Increased investment in healthcare infrastructure is fueling demand for sophisticated MRI systems.
- Growing prevalence of chronic diseases: The rise in conditions like cancer, neurological disorders, and cardiovascular diseases is increasing the need for accurate MRI diagnostics.
Mergers and acquisitions (M&A) play a significant role in shaping the market landscape. While precise M&A deal values within the South Korean MRI sector are difficult to publicly ascertain, global trends indicate significant investment in the sector, often driven by technological acquisitions to strengthen market positions and broaden product portfolios. The overall market consolidation is expected to continue. The regulatory framework in South Korea, while stringent, fosters innovation by encouraging the development and adoption of advanced medical technologies. The presence of strong domestic and international players ensures a dynamic and competitive market.
Magnetic Resonance Imaging Industry in South Korea Industry Trends & Insights
The South Korean MRI market is experiencing robust growth, driven by a confluence of factors. The market’s Compound Annual Growth Rate (CAGR) during the historical period (2019-2024) was approximately xx%, driven by factors such as rising healthcare expenditure, an aging population leading to increased prevalence of chronic diseases requiring MRI diagnosis, and government initiatives promoting advanced medical technology adoption. Market penetration of MRI systems in South Korea is increasing steadily, although there's still room for growth in rural areas and smaller hospitals.
Technological advancements are significantly influencing the market's trajectory. The adoption of high-field MRI systems (3T and above) is accelerating, driven by their superior image quality and diagnostic capabilities. Moreover, the integration of artificial intelligence (AI) and machine learning (ML) is enhancing image analysis, leading to faster and more accurate diagnoses. This is further enhanced by the introduction of novel technologies and imaging techniques.
Consumer preferences are shifting towards minimally invasive procedures and faster scan times. The demand for open MRI systems, which are more comfortable for claustrophobic patients, is also growing. Competitive dynamics are characterized by intense competition among established players and the emergence of innovative start-ups. Strategic partnerships, investments, and collaborations are becoming increasingly important to maintain competitiveness.
Dominant Markets & Segments in Magnetic Resonance Imaging Industry in South Korea
Dominant Segments:
- Architecture: Closed MRI systems currently dominate the market due to superior image quality and diagnostic capabilities. However, the open MRI system segment is experiencing growth due to increased patient comfort.
- Field Strength: High-field MRI systems (1.5T and 3T) are the dominant segment due to superior image quality. The very high and ultra-high field systems are gaining traction, though at a slower pace due to higher costs and specialized applications.
- Application: Oncology and neurology are the dominant application segments, driven by high prevalence of cancers and neurological disorders. Cardiology, musculoskeletal, and gastroenterology applications are also growing steadily.
Key Drivers for Dominance:
- Economic Policies: Government initiatives supporting healthcare infrastructure development and technological advancement.
- Infrastructure: Advanced healthcare infrastructure in major urban centers enabling the deployment of high-end MRI systems.
- Healthcare Expenditure: Continuous rise in per capita healthcare spending in South Korea.
The dominance of certain segments reflects the country’s healthcare priorities and advancements in medical technology. The ongoing shift towards higher-field systems and specialized applications reflects the increasing sophistication of diagnostic needs.
Magnetic Resonance Imaging Industry in South Korea Product Developments
Recent product developments highlight a strong focus on improving image quality, scan speed, and patient comfort. High-field strength MRI systems are gaining traction, along with systems incorporating advanced coil technologies and AI-powered image analysis. This is driven by the continuous push to offer better diagnostic capabilities and minimize discomfort for patients, enhancing patient experience and satisfaction.
Report Scope & Segmentation Analysis
This report segments the South Korean MRI market based on architecture (Closed and Open MRI Systems), field strength (Low Field, High Field, Very High Field, and Ultra-high Field MRI Systems), and application (Oncology, Neurology, Cardiology, Gastroenterology, Musculoskeletal, and Other Applications). Each segment’s market size and growth projections are provided for the historical period (2019-2024), base year (2025), and forecast period (2025-2033). Competitive landscapes for each segment are also analyzed, highlighting key players, their market share, and competitive strategies.
Key Drivers of Magnetic Resonance Imaging Industry in South Korea Growth
Several key drivers fuel the growth of the South Korean MRI market:
- Technological advancements: Continuous innovation leading to improved image quality, faster scan times, and enhanced diagnostic capabilities.
- Increasing prevalence of chronic diseases: The rising incidence of cancer, neurological disorders, and cardiovascular diseases drives demand for accurate MRI diagnoses.
- Government support: Government initiatives promoting healthcare infrastructure development and adoption of advanced medical technologies.
- Rising healthcare expenditure: Increased investment in healthcare infrastructure facilitates the adoption of advanced medical imaging equipment.
Challenges in the Magnetic Resonance Imaging Industry in South Korea Sector
Despite the positive outlook, the South Korean MRI market faces several challenges:
- High cost of MRI systems: The high capital expenditure associated with purchasing and maintaining advanced MRI systems poses a barrier, particularly for smaller hospitals and clinics. This results in a limitation on accessibility and increased cost of healthcare.
- Stringent regulatory approvals: The regulatory process for obtaining approvals for new MRI systems can be lengthy and complex. This increases the time-to-market for new technologies.
- Intense competition: The market faces intense competition from both domestic and international players, requiring companies to constantly innovate to maintain their market share.
Emerging Opportunities in Magnetic Resonance Imaging Industry in South Korea
Several emerging opportunities exist within the South Korean MRI market:
- Growth in regional markets: Expanding access to MRI services in rural areas presents significant growth potential.
- Adoption of AI-powered diagnostic tools: The integration of AI and machine learning is enhancing diagnostic capabilities and improving efficiency.
- Demand for specialized MRI applications: The increasing need for specialized MRI applications, such as functional MRI (fMRI) and diffusion tensor imaging (DTI), presents further growth opportunities.
Leading Players in the Magnetic Resonance Imaging Industry in South Korea Market
- Medonica Co Ltd
- Esaote SpA
- Fonar Corporation
- Siemens Healthineers
- GE Healthcare
- Neusoft Medical Systems Co Ltd
- Koninklijke Philips NV
- Canon Medical Systems Corporation
- Fujifilm Holdings Corporation
Key Developments in Magnetic Resonance Imaging Industry in South Korea Industry
- August 2022: AIRS Medical secured USD 20 Million in Series B funding, indicating significant investor confidence in the South Korean healthcare technology sector.
- February 2021: Elektra launched its next-generation 1.5T MRI device, Unity, in South Korea, demonstrating ongoing innovation in MRI technology.
Strategic Outlook for Magnetic Resonance Imaging Industry in South Korea Market
The South Korean MRI market is poised for continued growth driven by technological advancements, rising healthcare expenditure, and government support. The increasing prevalence of chronic diseases and the growing demand for advanced diagnostic imaging will fuel demand for higher-field MRI systems and specialized applications. Companies that successfully adapt to evolving technologies and consumer preferences are expected to capture significant market share in the coming years. The market will see further consolidation and increased competition, emphasizing the need for strategic partnerships and collaborations to thrive.
Magnetic Resonance Imaging Industry in South Korea Segmentation
-
1. Architecture
- 1.1. Closed MRI Systems
- 1.2. Open MRI Systems
-
2. Field Strength
- 2.1. Low Field MRI Systems
- 2.2. High Field MRI Systems
- 2.3. Very Hig
-
3. Application
- 3.1. Oncology
- 3.2. Neurology
- 3.3. Cardiology
- 3.4. Gastroenterology
- 3.5. Musculoskeletal
- 3.6. Other Applications
Magnetic Resonance Imaging Industry in South Korea Segmentation By Geography
-
1. North America
- 1.1. United States
- 1.2. Canada
- 1.3. Mexico
-
2. South America
- 2.1. Brazil
- 2.2. Argentina
- 2.3. Rest of South America
-
3. Europe
- 3.1. United Kingdom
- 3.2. Germany
- 3.3. France
- 3.4. Italy
- 3.5. Spain
- 3.6. Russia
- 3.7. Benelux
- 3.8. Nordics
- 3.9. Rest of Europe
-
4. Middle East & Africa
- 4.1. Turkey
- 4.2. Israel
- 4.3. GCC
- 4.4. North Africa
- 4.5. South Africa
- 4.6. Rest of Middle East & Africa
-
5. Asia Pacific
- 5.1. China
- 5.2. India
- 5.3. Japan
- 5.4. South Korea
- 5.5. ASEAN
- 5.6. Oceania
- 5.7. Rest of Asia Pacific
Magnetic Resonance Imaging Industry in South Korea REPORT HIGHLIGHTS
| Aspects | Details |
|---|---|
| Study Period | 2019-2033 |
| Base Year | 2024 |
| Estimated Year | 2025 |
| Forecast Period | 2025-2033 |
| Historical Period | 2019-2024 |
| Growth Rate | CAGR of 5.38% from 2019-2033 |
| Segmentation |
|
Table of Contents
- 1. Introduction
- 1.1. Research Scope
- 1.2. Market Segmentation
- 1.3. Research Methodology
- 1.4. Definitions and Assumptions
- 2. Executive Summary
- 2.1. Introduction
- 3. Market Dynamics
- 3.1. Introduction
- 3.2. Market Drivers
- 3.2.1. Introduction of Hybrid MRI Systems; Increasing Prevalence of Chronic Diseases and Rising Geriatric Population
- 3.3. Market Restrains
- 3.3.1. High Cost of MRI Systems
- 3.4. Market Trends
- 3.4.1. High-Field MRI Systems are Expected to Witness Healthy Growth Over the Forecast Period
- 4. Market Factor Analysis
- 4.1. Porters Five Forces
- 4.2. Supply/Value Chain
- 4.3. PESTEL analysis
- 4.4. Market Entropy
- 4.5. Patent/Trademark Analysis
- 5. Global Magnetic Resonance Imaging Industry in South Korea Analysis, Insights and Forecast, 2019-2031
- 5.1. Market Analysis, Insights and Forecast - by Architecture
- 5.1.1. Closed MRI Systems
- 5.1.2. Open MRI Systems
- 5.2. Market Analysis, Insights and Forecast - by Field Strength
- 5.2.1. Low Field MRI Systems
- 5.2.2. High Field MRI Systems
- 5.2.3. Very Hig
- 5.3. Market Analysis, Insights and Forecast - by Application
- 5.3.1. Oncology
- 5.3.2. Neurology
- 5.3.3. Cardiology
- 5.3.4. Gastroenterology
- 5.3.5. Musculoskeletal
- 5.3.6. Other Applications
- 5.4. Market Analysis, Insights and Forecast - by Region
- 5.4.1. North America
- 5.4.2. South America
- 5.4.3. Europe
- 5.4.4. Middle East & Africa
- 5.4.5. Asia Pacific
- 5.1. Market Analysis, Insights and Forecast - by Architecture
- 6. North America Magnetic Resonance Imaging Industry in South Korea Analysis, Insights and Forecast, 2019-2031
- 6.1. Market Analysis, Insights and Forecast - by Architecture
- 6.1.1. Closed MRI Systems
- 6.1.2. Open MRI Systems
- 6.2. Market Analysis, Insights and Forecast - by Field Strength
- 6.2.1. Low Field MRI Systems
- 6.2.2. High Field MRI Systems
- 6.2.3. Very Hig
- 6.3. Market Analysis, Insights and Forecast - by Application
- 6.3.1. Oncology
- 6.3.2. Neurology
- 6.3.3. Cardiology
- 6.3.4. Gastroenterology
- 6.3.5. Musculoskeletal
- 6.3.6. Other Applications
- 6.1. Market Analysis, Insights and Forecast - by Architecture
- 7. South America Magnetic Resonance Imaging Industry in South Korea Analysis, Insights and Forecast, 2019-2031
- 7.1. Market Analysis, Insights and Forecast - by Architecture
- 7.1.1. Closed MRI Systems
- 7.1.2. Open MRI Systems
- 7.2. Market Analysis, Insights and Forecast - by Field Strength
- 7.2.1. Low Field MRI Systems
- 7.2.2. High Field MRI Systems
- 7.2.3. Very Hig
- 7.3. Market Analysis, Insights and Forecast - by Application
- 7.3.1. Oncology
- 7.3.2. Neurology
- 7.3.3. Cardiology
- 7.3.4. Gastroenterology
- 7.3.5. Musculoskeletal
- 7.3.6. Other Applications
- 7.1. Market Analysis, Insights and Forecast - by Architecture
- 8. Europe Magnetic Resonance Imaging Industry in South Korea Analysis, Insights and Forecast, 2019-2031
- 8.1. Market Analysis, Insights and Forecast - by Architecture
- 8.1.1. Closed MRI Systems
- 8.1.2. Open MRI Systems
- 8.2. Market Analysis, Insights and Forecast - by Field Strength
- 8.2.1. Low Field MRI Systems
- 8.2.2. High Field MRI Systems
- 8.2.3. Very Hig
- 8.3. Market Analysis, Insights and Forecast - by Application
- 8.3.1. Oncology
- 8.3.2. Neurology
- 8.3.3. Cardiology
- 8.3.4. Gastroenterology
- 8.3.5. Musculoskeletal
- 8.3.6. Other Applications
- 8.1. Market Analysis, Insights and Forecast - by Architecture
- 9. Middle East & Africa Magnetic Resonance Imaging Industry in South Korea Analysis, Insights and Forecast, 2019-2031
- 9.1. Market Analysis, Insights and Forecast - by Architecture
- 9.1.1. Closed MRI Systems
- 9.1.2. Open MRI Systems
- 9.2. Market Analysis, Insights and Forecast - by Field Strength
- 9.2.1. Low Field MRI Systems
- 9.2.2. High Field MRI Systems
- 9.2.3. Very Hig
- 9.3. Market Analysis, Insights and Forecast - by Application
- 9.3.1. Oncology
- 9.3.2. Neurology
- 9.3.3. Cardiology
- 9.3.4. Gastroenterology
- 9.3.5. Musculoskeletal
- 9.3.6. Other Applications
- 9.1. Market Analysis, Insights and Forecast - by Architecture
- 10. Asia Pacific Magnetic Resonance Imaging Industry in South Korea Analysis, Insights and Forecast, 2019-2031
- 10.1. Market Analysis, Insights and Forecast - by Architecture
- 10.1.1. Closed MRI Systems
- 10.1.2. Open MRI Systems
- 10.2. Market Analysis, Insights and Forecast - by Field Strength
- 10.2.1. Low Field MRI Systems
- 10.2.2. High Field MRI Systems
- 10.2.3. Very Hig
- 10.3. Market Analysis, Insights and Forecast - by Application
- 10.3.1. Oncology
- 10.3.2. Neurology
- 10.3.3. Cardiology
- 10.3.4. Gastroenterology
- 10.3.5. Musculoskeletal
- 10.3.6. Other Applications
- 10.1. Market Analysis, Insights and Forecast - by Architecture
- 11. Competitive Analysis
- 11.1. Global Market Share Analysis 2024
- 11.2. Company Profiles
- 11.2.1 Medonica Co Ltd
- 11.2.1.1. Overview
- 11.2.1.2. Products
- 11.2.1.3. SWOT Analysis
- 11.2.1.4. Recent Developments
- 11.2.1.5. Financials (Based on Availability)
- 11.2.2 Esaote SpA
- 11.2.2.1. Overview
- 11.2.2.2. Products
- 11.2.2.3. SWOT Analysis
- 11.2.2.4. Recent Developments
- 11.2.2.5. Financials (Based on Availability)
- 11.2.3 Fonar Corporation
- 11.2.3.1. Overview
- 11.2.3.2. Products
- 11.2.3.3. SWOT Analysis
- 11.2.3.4. Recent Developments
- 11.2.3.5. Financials (Based on Availability)
- 11.2.4 Siemens Healthineers
- 11.2.4.1. Overview
- 11.2.4.2. Products
- 11.2.4.3. SWOT Analysis
- 11.2.4.4. Recent Developments
- 11.2.4.5. Financials (Based on Availability)
- 11.2.5 GE Healthcare
- 11.2.5.1. Overview
- 11.2.5.2. Products
- 11.2.5.3. SWOT Analysis
- 11.2.5.4. Recent Developments
- 11.2.5.5. Financials (Based on Availability)
- 11.2.6 Neusoft Medical Systems Co Ltd
- 11.2.6.1. Overview
- 11.2.6.2. Products
- 11.2.6.3. SWOT Analysis
- 11.2.6.4. Recent Developments
- 11.2.6.5. Financials (Based on Availability)
- 11.2.7 Koninklijke Philips NV
- 11.2.7.1. Overview
- 11.2.7.2. Products
- 11.2.7.3. SWOT Analysis
- 11.2.7.4. Recent Developments
- 11.2.7.5. Financials (Based on Availability)
- 11.2.8 Canon Medical Systems Corporation
- 11.2.8.1. Overview
- 11.2.8.2. Products
- 11.2.8.3. SWOT Analysis
- 11.2.8.4. Recent Developments
- 11.2.8.5. Financials (Based on Availability)
- 11.2.9 Fujifilm Holdings Corporation
- 11.2.9.1. Overview
- 11.2.9.2. Products
- 11.2.9.3. SWOT Analysis
- 11.2.9.4. Recent Developments
- 11.2.9.5. Financials (Based on Availability)
- 11.2.1 Medonica Co Ltd
List of Figures
- Figure 1: Global Magnetic Resonance Imaging Industry in South Korea Revenue Breakdown (Million, %) by Region 2024 & 2032
- Figure 2: South Korea Magnetic Resonance Imaging Industry in South Korea Revenue (Million), by Country 2024 & 2032
- Figure 3: South Korea Magnetic Resonance Imaging Industry in South Korea Revenue Share (%), by Country 2024 & 2032
- Figure 4: North America Magnetic Resonance Imaging Industry in South Korea Revenue (Million), by Architecture 2024 & 2032
- Figure 5: North America Magnetic Resonance Imaging Industry in South Korea Revenue Share (%), by Architecture 2024 & 2032
- Figure 6: North America Magnetic Resonance Imaging Industry in South Korea Revenue (Million), by Field Strength 2024 & 2032
- Figure 7: North America Magnetic Resonance Imaging Industry in South Korea Revenue Share (%), by Field Strength 2024 & 2032
- Figure 8: North America Magnetic Resonance Imaging Industry in South Korea Revenue (Million), by Application 2024 & 2032
- Figure 9: North America Magnetic Resonance Imaging Industry in South Korea Revenue Share (%), by Application 2024 & 2032
- Figure 10: North America Magnetic Resonance Imaging Industry in South Korea Revenue (Million), by Country 2024 & 2032
- Figure 11: North America Magnetic Resonance Imaging Industry in South Korea Revenue Share (%), by Country 2024 & 2032
- Figure 12: South America Magnetic Resonance Imaging Industry in South Korea Revenue (Million), by Architecture 2024 & 2032
- Figure 13: South America Magnetic Resonance Imaging Industry in South Korea Revenue Share (%), by Architecture 2024 & 2032
- Figure 14: South America Magnetic Resonance Imaging Industry in South Korea Revenue (Million), by Field Strength 2024 & 2032
- Figure 15: South America Magnetic Resonance Imaging Industry in South Korea Revenue Share (%), by Field Strength 2024 & 2032
- Figure 16: South America Magnetic Resonance Imaging Industry in South Korea Revenue (Million), by Application 2024 & 2032
- Figure 17: South America Magnetic Resonance Imaging Industry in South Korea Revenue Share (%), by Application 2024 & 2032
- Figure 18: South America Magnetic Resonance Imaging Industry in South Korea Revenue (Million), by Country 2024 & 2032
- Figure 19: South America Magnetic Resonance Imaging Industry in South Korea Revenue Share (%), by Country 2024 & 2032
- Figure 20: Europe Magnetic Resonance Imaging Industry in South Korea Revenue (Million), by Architecture 2024 & 2032
- Figure 21: Europe Magnetic Resonance Imaging Industry in South Korea Revenue Share (%), by Architecture 2024 & 2032
- Figure 22: Europe Magnetic Resonance Imaging Industry in South Korea Revenue (Million), by Field Strength 2024 & 2032
- Figure 23: Europe Magnetic Resonance Imaging Industry in South Korea Revenue Share (%), by Field Strength 2024 & 2032
- Figure 24: Europe Magnetic Resonance Imaging Industry in South Korea Revenue (Million), by Application 2024 & 2032
- Figure 25: Europe Magnetic Resonance Imaging Industry in South Korea Revenue Share (%), by Application 2024 & 2032
- Figure 26: Europe Magnetic Resonance Imaging Industry in South Korea Revenue (Million), by Country 2024 & 2032
- Figure 27: Europe Magnetic Resonance Imaging Industry in South Korea Revenue Share (%), by Country 2024 & 2032
- Figure 28: Middle East & Africa Magnetic Resonance Imaging Industry in South Korea Revenue (Million), by Architecture 2024 & 2032
- Figure 29: Middle East & Africa Magnetic Resonance Imaging Industry in South Korea Revenue Share (%), by Architecture 2024 & 2032
- Figure 30: Middle East & Africa Magnetic Resonance Imaging Industry in South Korea Revenue (Million), by Field Strength 2024 & 2032
- Figure 31: Middle East & Africa Magnetic Resonance Imaging Industry in South Korea Revenue Share (%), by Field Strength 2024 & 2032
- Figure 32: Middle East & Africa Magnetic Resonance Imaging Industry in South Korea Revenue (Million), by Application 2024 & 2032
- Figure 33: Middle East & Africa Magnetic Resonance Imaging Industry in South Korea Revenue Share (%), by Application 2024 & 2032
- Figure 34: Middle East & Africa Magnetic Resonance Imaging Industry in South Korea Revenue (Million), by Country 2024 & 2032
- Figure 35: Middle East & Africa Magnetic Resonance Imaging Industry in South Korea Revenue Share (%), by Country 2024 & 2032
- Figure 36: Asia Pacific Magnetic Resonance Imaging Industry in South Korea Revenue (Million), by Architecture 2024 & 2032
- Figure 37: Asia Pacific Magnetic Resonance Imaging Industry in South Korea Revenue Share (%), by Architecture 2024 & 2032
- Figure 38: Asia Pacific Magnetic Resonance Imaging Industry in South Korea Revenue (Million), by Field Strength 2024 & 2032
- Figure 39: Asia Pacific Magnetic Resonance Imaging Industry in South Korea Revenue Share (%), by Field Strength 2024 & 2032
- Figure 40: Asia Pacific Magnetic Resonance Imaging Industry in South Korea Revenue (Million), by Application 2024 & 2032
- Figure 41: Asia Pacific Magnetic Resonance Imaging Industry in South Korea Revenue Share (%), by Application 2024 & 2032
- Figure 42: Asia Pacific Magnetic Resonance Imaging Industry in South Korea Revenue (Million), by Country 2024 & 2032
- Figure 43: Asia Pacific Magnetic Resonance Imaging Industry in South Korea Revenue Share (%), by Country 2024 & 2032
List of Tables
- Table 1: Global Magnetic Resonance Imaging Industry in South Korea Revenue Million Forecast, by Region 2019 & 2032
- Table 2: Global Magnetic Resonance Imaging Industry in South Korea Revenue Million Forecast, by Architecture 2019 & 2032
- Table 3: Global Magnetic Resonance Imaging Industry in South Korea Revenue Million Forecast, by Field Strength 2019 & 2032
- Table 4: Global Magnetic Resonance Imaging Industry in South Korea Revenue Million Forecast, by Application 2019 & 2032
- Table 5: Global Magnetic Resonance Imaging Industry in South Korea Revenue Million Forecast, by Region 2019 & 2032
- Table 6: Global Magnetic Resonance Imaging Industry in South Korea Revenue Million Forecast, by Country 2019 & 2032
- Table 7: Global Magnetic Resonance Imaging Industry in South Korea Revenue Million Forecast, by Architecture 2019 & 2032
- Table 8: Global Magnetic Resonance Imaging Industry in South Korea Revenue Million Forecast, by Field Strength 2019 & 2032
- Table 9: Global Magnetic Resonance Imaging Industry in South Korea Revenue Million Forecast, by Application 2019 & 2032
- Table 10: Global Magnetic Resonance Imaging Industry in South Korea Revenue Million Forecast, by Country 2019 & 2032
- Table 11: United States Magnetic Resonance Imaging Industry in South Korea Revenue (Million) Forecast, by Application 2019 & 2032
- Table 12: Canada Magnetic Resonance Imaging Industry in South Korea Revenue (Million) Forecast, by Application 2019 & 2032
- Table 13: Mexico Magnetic Resonance Imaging Industry in South Korea Revenue (Million) Forecast, by Application 2019 & 2032
- Table 14: Global Magnetic Resonance Imaging Industry in South Korea Revenue Million Forecast, by Architecture 2019 & 2032
- Table 15: Global Magnetic Resonance Imaging Industry in South Korea Revenue Million Forecast, by Field Strength 2019 & 2032
- Table 16: Global Magnetic Resonance Imaging Industry in South Korea Revenue Million Forecast, by Application 2019 & 2032
- Table 17: Global Magnetic Resonance Imaging Industry in South Korea Revenue Million Forecast, by Country 2019 & 2032
- Table 18: Brazil Magnetic Resonance Imaging Industry in South Korea Revenue (Million) Forecast, by Application 2019 & 2032
- Table 19: Argentina Magnetic Resonance Imaging Industry in South Korea Revenue (Million) Forecast, by Application 2019 & 2032
- Table 20: Rest of South America Magnetic Resonance Imaging Industry in South Korea Revenue (Million) Forecast, by Application 2019 & 2032
- Table 21: Global Magnetic Resonance Imaging Industry in South Korea Revenue Million Forecast, by Architecture 2019 & 2032
- Table 22: Global Magnetic Resonance Imaging Industry in South Korea Revenue Million Forecast, by Field Strength 2019 & 2032
- Table 23: Global Magnetic Resonance Imaging Industry in South Korea Revenue Million Forecast, by Application 2019 & 2032
- Table 24: Global Magnetic Resonance Imaging Industry in South Korea Revenue Million Forecast, by Country 2019 & 2032
- Table 25: United Kingdom Magnetic Resonance Imaging Industry in South Korea Revenue (Million) Forecast, by Application 2019 & 2032
- Table 26: Germany Magnetic Resonance Imaging Industry in South Korea Revenue (Million) Forecast, by Application 2019 & 2032
- Table 27: France Magnetic Resonance Imaging Industry in South Korea Revenue (Million) Forecast, by Application 2019 & 2032
- Table 28: Italy Magnetic Resonance Imaging Industry in South Korea Revenue (Million) Forecast, by Application 2019 & 2032
- Table 29: Spain Magnetic Resonance Imaging Industry in South Korea Revenue (Million) Forecast, by Application 2019 & 2032
- Table 30: Russia Magnetic Resonance Imaging Industry in South Korea Revenue (Million) Forecast, by Application 2019 & 2032
- Table 31: Benelux Magnetic Resonance Imaging Industry in South Korea Revenue (Million) Forecast, by Application 2019 & 2032
- Table 32: Nordics Magnetic Resonance Imaging Industry in South Korea Revenue (Million) Forecast, by Application 2019 & 2032
- Table 33: Rest of Europe Magnetic Resonance Imaging Industry in South Korea Revenue (Million) Forecast, by Application 2019 & 2032
- Table 34: Global Magnetic Resonance Imaging Industry in South Korea Revenue Million Forecast, by Architecture 2019 & 2032
- Table 35: Global Magnetic Resonance Imaging Industry in South Korea Revenue Million Forecast, by Field Strength 2019 & 2032
- Table 36: Global Magnetic Resonance Imaging Industry in South Korea Revenue Million Forecast, by Application 2019 & 2032
- Table 37: Global Magnetic Resonance Imaging Industry in South Korea Revenue Million Forecast, by Country 2019 & 2032
- Table 38: Turkey Magnetic Resonance Imaging Industry in South Korea Revenue (Million) Forecast, by Application 2019 & 2032
- Table 39: Israel Magnetic Resonance Imaging Industry in South Korea Revenue (Million) Forecast, by Application 2019 & 2032
- Table 40: GCC Magnetic Resonance Imaging Industry in South Korea Revenue (Million) Forecast, by Application 2019 & 2032
- Table 41: North Africa Magnetic Resonance Imaging Industry in South Korea Revenue (Million) Forecast, by Application 2019 & 2032
- Table 42: South Africa Magnetic Resonance Imaging Industry in South Korea Revenue (Million) Forecast, by Application 2019 & 2032
- Table 43: Rest of Middle East & Africa Magnetic Resonance Imaging Industry in South Korea Revenue (Million) Forecast, by Application 2019 & 2032
- Table 44: Global Magnetic Resonance Imaging Industry in South Korea Revenue Million Forecast, by Architecture 2019 & 2032
- Table 45: Global Magnetic Resonance Imaging Industry in South Korea Revenue Million Forecast, by Field Strength 2019 & 2032
- Table 46: Global Magnetic Resonance Imaging Industry in South Korea Revenue Million Forecast, by Application 2019 & 2032
- Table 47: Global Magnetic Resonance Imaging Industry in South Korea Revenue Million Forecast, by Country 2019 & 2032
- Table 48: China Magnetic Resonance Imaging Industry in South Korea Revenue (Million) Forecast, by Application 2019 & 2032
- Table 49: India Magnetic Resonance Imaging Industry in South Korea Revenue (Million) Forecast, by Application 2019 & 2032
- Table 50: Japan Magnetic Resonance Imaging Industry in South Korea Revenue (Million) Forecast, by Application 2019 & 2032
- Table 51: South Korea Magnetic Resonance Imaging Industry in South Korea Revenue (Million) Forecast, by Application 2019 & 2032
- Table 52: ASEAN Magnetic Resonance Imaging Industry in South Korea Revenue (Million) Forecast, by Application 2019 & 2032
- Table 53: Oceania Magnetic Resonance Imaging Industry in South Korea Revenue (Million) Forecast, by Application 2019 & 2032
- Table 54: Rest of Asia Pacific Magnetic Resonance Imaging Industry in South Korea Revenue (Million) Forecast, by Application 2019 & 2032
Frequently Asked Questions
1. What is the projected Compound Annual Growth Rate (CAGR) of the Magnetic Resonance Imaging Industry in South Korea?
The projected CAGR is approximately 5.38%.
2. Which companies are prominent players in the Magnetic Resonance Imaging Industry in South Korea?
Key companies in the market include Medonica Co Ltd, Esaote SpA, Fonar Corporation, Siemens Healthineers, GE Healthcare, Neusoft Medical Systems Co Ltd, Koninklijke Philips NV, Canon Medical Systems Corporation, Fujifilm Holdings Corporation.
3. What are the main segments of the Magnetic Resonance Imaging Industry in South Korea?
The market segments include Architecture, Field Strength, Application.
4. Can you provide details about the market size?
The market size is estimated to be USD 312.10 Million as of 2022.
5. What are some drivers contributing to market growth?
Introduction of Hybrid MRI Systems; Increasing Prevalence of Chronic Diseases and Rising Geriatric Population.
6. What are the notable trends driving market growth?
High-Field MRI Systems are Expected to Witness Healthy Growth Over the Forecast Period.
7. Are there any restraints impacting market growth?
High Cost of MRI Systems.
8. Can you provide examples of recent developments in the market?
In August 2022, South Korea-based healthcare start-up AIRS Medical has secured around USD 20 million in a Series B funding round that included existing investor Klim Ventures.
9. What pricing options are available for accessing the report?
Pricing options include single-user, multi-user, and enterprise licenses priced at USD 3800, USD 4500, and USD 5800 respectively.
10. Is the market size provided in terms of value or volume?
The market size is provided in terms of value, measured in Million.
11. Are there any specific market keywords associated with the report?
Yes, the market keyword associated with the report is "Magnetic Resonance Imaging Industry in South Korea," which aids in identifying and referencing the specific market segment covered.
12. How do I determine which pricing option suits my needs best?
The pricing options vary based on user requirements and access needs. Individual users may opt for single-user licenses, while businesses requiring broader access may choose multi-user or enterprise licenses for cost-effective access to the report.
13. Are there any additional resources or data provided in the Magnetic Resonance Imaging Industry in South Korea report?
While the report offers comprehensive insights, it's advisable to review the specific contents or supplementary materials provided to ascertain if additional resources or data are available.
14. How can I stay updated on further developments or reports in the Magnetic Resonance Imaging Industry in South Korea?
To stay informed about further developments, trends, and reports in the Magnetic Resonance Imaging Industry in South Korea, consider subscribing to industry newsletters, following relevant companies and organizations, or regularly checking reputable industry news sources and publications.
Methodology
Step 1 - Identification of Relevant Samples Size from Population Database


Step 2 - Approaches for Defining Global Market Size (Value, Volume* & Price*)

Note*: In applicable scenarios
Step 3 - Data Sources
Primary Research
- Web Analytics
- Survey Reports
- Research Institute
- Latest Research Reports
- Opinion Leaders
Secondary Research
- Annual Reports
- White Paper
- Latest Press Release
- Industry Association
- Paid Database
- Investor Presentations

Step 4 - Data Triangulation
Involves using different sources of information in order to increase the validity of a study
These sources are likely to be stakeholders in a program - participants, other researchers, program staff, other community members, and so on.
Then we put all data in single framework & apply various statistical tools to find out the dynamic on the market.
During the analysis stage, feedback from the stakeholder groups would be compared to determine areas of agreement as well as areas of divergence


