
Key Insights
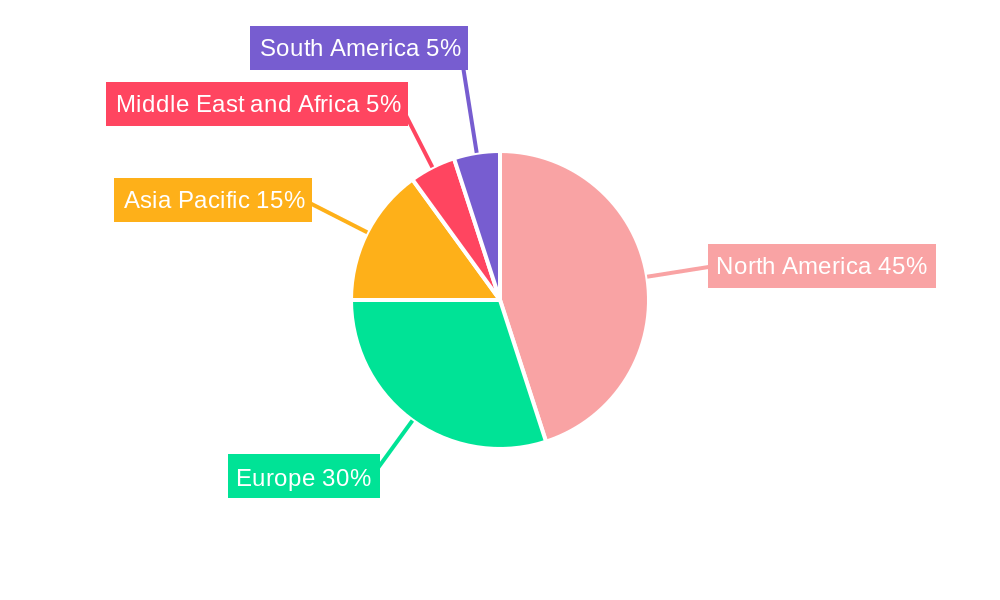
The global spine biologics market is experiencing robust growth, driven by a rising geriatric population susceptible to degenerative spinal disorders, increasing spinal fusion surgeries, and advancements in minimally invasive surgical techniques. The market's Compound Annual Growth Rate (CAGR) of 4.00% from 2019-2024 suggests a steadily expanding market, projected to continue this trajectory through 2033. Significant market segments include bone graft substitutes (including synthetic bone grafts, spinal allografts, and demineralized bone matrix) which are experiencing substantial demand fueled by their biocompatibility and efficacy in spinal fusion procedures. Hospitals and ambulatory surgical centers constitute the primary end-users, reflecting the preference for these procedures in well-equipped facilities. Leading players like Arthrex Inc, Johnson & Johnson (Depuy Synthes), and Zimmer Biomet are actively engaged in R&D, driving innovation in material science and surgical techniques, further boosting market growth. However, the high cost of these biologics and potential complications associated with their use present some restraints to market expansion. Geographically, North America currently dominates the market owing to advanced healthcare infrastructure and high adoption rates, while the Asia-Pacific region shows promising growth potential driven by rising healthcare expenditure and increasing awareness of minimally invasive spinal surgeries.
The continued expansion of the spine biologics market is anticipated to be fueled by several factors. Technological advancements are leading to the development of more effective and biocompatible bone graft substitutes, reducing the risk of complications and improving patient outcomes. Furthermore, the increasing prevalence of chronic back pain and spinal deformities, coupled with a growing preference for minimally invasive surgical techniques, will drive demand for these biologics. Competitive pressures among major players are also contributing positively, pushing innovation and offering patients a wider range of choices. While regulatory hurdles and pricing pressures remain challenges, the overall market outlook remains positive, with sustained growth anticipated across various regions, particularly in developing economies experiencing rapid healthcare infrastructure development.
Spine Biologics Industry: A Comprehensive Market Report (2019-2033)
This comprehensive report provides an in-depth analysis of the Spine Biologics industry, offering valuable insights for stakeholders, investors, and industry professionals. The report covers the period from 2019 to 2033, with a focus on the forecast period of 2025-2033 and a base year of 2025. The global market is estimated to be valued at xx Million in 2025 and is projected to reach xx Million by 2033, exhibiting a CAGR of xx% during the forecast period.
Spine Biologics Industry Market Concentration & Innovation
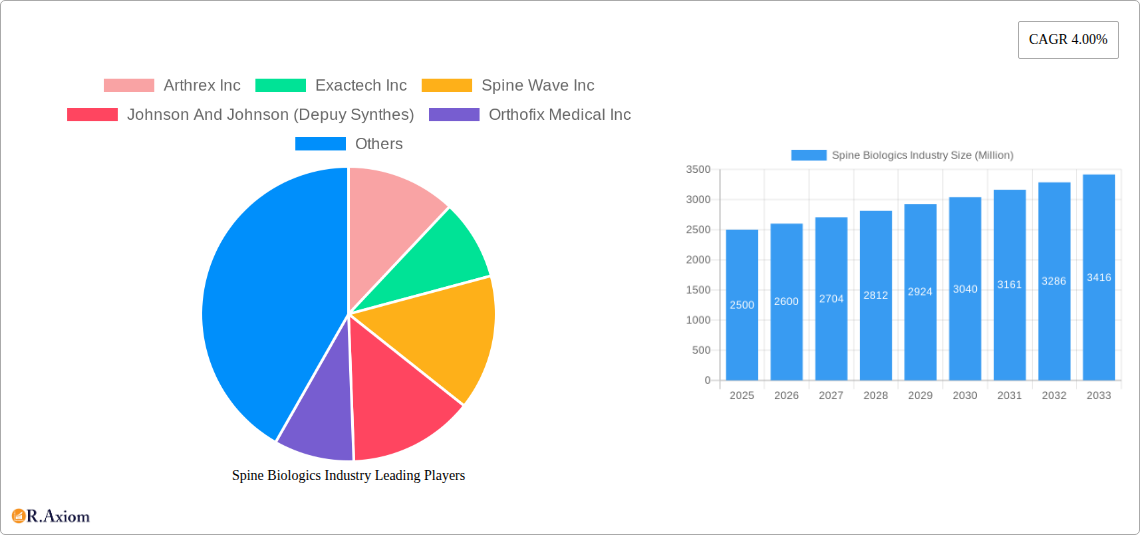
The Spine Biologics market exhibits a moderately concentrated landscape, with key players such as Arthrex Inc, Exactech Inc, Spine Wave Inc, Johnson & Johnson (Depuy Synthes), Orthofix Medical Inc, NuVasive Inc, Stryker Corporation, Zimmer Biomet, and Medtronic plc holding significant market share. The combined market share of the top five players is estimated at xx% in 2025. Innovation is driven by the need for less invasive procedures, improved biocompatibility, and enhanced bone integration. Stringent regulatory frameworks, such as those set by the FDA, influence product development and market entry. The market witnesses continuous innovation through the development of novel biomaterials, improved delivery systems, and combination products. Product substitution is a significant factor, with ongoing research into more effective and cost-efficient alternatives. The increasing adoption of minimally invasive spine surgery (MISS) is driving demand for smaller, more efficient biologics. Mergers and acquisitions (M&A) play a crucial role in shaping the market landscape. In recent years, M&A deal values have totaled xx Million, reflecting consolidation and strategic expansion within the industry.
- Key Players Market Share (2025): Arthrex Inc (xx%), Exactech Inc (xx%), Spine Wave Inc (xx%), Johnson & Johnson (xx%), Orthofix Medical Inc (xx%), NuVasive Inc (xx%), Stryker Corporation (xx%), Zimmer Biomet (xx%), Medtronic plc (xx%).
- Recent M&A Activity: [List significant M&A deals with values if available, otherwise use "xx Million" as a placeholder.]
Spine Biologics Industry Industry Trends & Insights
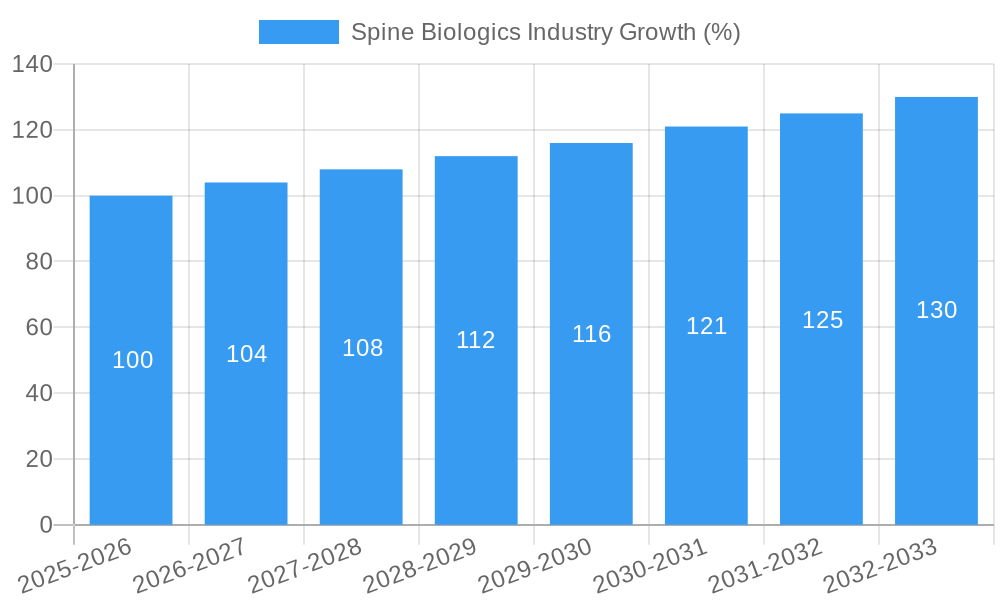
The Spine Biologics market is experiencing robust growth, driven by the rising prevalence of degenerative spine diseases, an aging global population, and increasing demand for minimally invasive surgical procedures. Technological advancements, such as the development of bio-engineered bone grafts and advanced delivery systems, are further fueling market expansion. Consumer preferences are shifting towards less invasive procedures with faster recovery times and improved outcomes. The competitive dynamics are characterized by intense rivalry among established players and the emergence of innovative companies offering niche products. The market shows a clear preference for products with superior efficacy, safety, and cost-effectiveness. The CAGR for the period 2025-2033 is projected at xx%, indicating sustained market growth. Market penetration of novel biologics is gradually increasing, driven by clinical evidence of their efficacy. However, challenges such as high cost of treatment, stringent regulatory approvals, and potential complications associated with certain products remain crucial considerations.
Dominant Markets & Segments in Spine Biologics Industry
The North American region currently holds the largest market share, followed by Europe. Within the product segment, Bone Graft Substitutes dominate, accounting for xx% of the market in 2025, due to their versatility and widespread use. Hospitals represent the major end-user segment, driven by higher procedure volumes and advanced infrastructure.
- Key Drivers for North American Dominance:
- High healthcare expenditure.
- Advanced healthcare infrastructure.
- Strong regulatory support for innovation.
- High prevalence of spinal disorders.
- Bone Graft Substitutes Dominance:
- Versatility across different spinal procedures.
- Widespread acceptance and proven efficacy.
- Continuous development of innovative substitutes.
- Hospitals as Primary End-Users:
- High procedure volumes and specialized surgical teams.
- Availability of advanced imaging and monitoring technologies.
- Comprehensive post-operative care capabilities.
Spine Biologics Industry Product Developments
Recent innovations focus on enhancing bone integration, reducing inflammation, and improving the overall effectiveness of bone graft substitutes. This includes the development of bio-engineered materials that mimic natural bone, as well as the incorporation of growth factors and other bioactive molecules to accelerate healing. These advancements offer superior clinical outcomes and create a competitive advantage for companies that successfully bring these innovations to market. The market also sees the growth of combination products that integrate biologics with other implants or devices, streamlining surgical procedures and improving patient outcomes.
Report Scope & Segmentation Analysis
This report segments the Spine Biologics market by product (Bone Graft Substitutes, Synthetic Bone Grafts, Spinal Allografts, Demineralized Bone Matrix, Others) and by end-user (Hospitals, Ambulatory Surgical Centers, Others). Each segment is analyzed in detail, providing insights into market size, growth projections, and competitive dynamics. The Bone Graft Substitutes segment exhibits the highest growth potential, followed by Synthetic Bone Grafts. The hospital segment is the largest end-user, driven by increasing surgical procedures. The market is characterized by a competitive landscape, with established players and emerging companies competing for market share through innovation and strategic partnerships.
Key Drivers of Spine Biologics Industry Growth
The growth of the Spine Biologics industry is propelled by several key factors, including: the increasing prevalence of spinal disorders globally; advancements in minimally invasive surgical techniques; the rising geriatric population; and technological advancements in biomaterials and delivery systems. Favorable regulatory environments in key markets further stimulate industry growth. Additionally, the growing awareness about the benefits of biologics in spine surgery and rising healthcare expenditure are significant drivers.
Challenges in the Spine Biologics Industry Sector
The Spine Biologics industry faces challenges such as stringent regulatory pathways for new product approvals, which can increase time-to-market and development costs. Supply chain disruptions can impact product availability and pricing. Moreover, intense competition from established players and emerging companies necessitates continuous innovation and efficient cost management. The high cost of biologics also presents a barrier to access for many patients.
Emerging Opportunities in Spine Biologics Industry
Emerging opportunities exist in the development of personalized biologics, leveraging advanced genetic and cellular therapies to improve patient outcomes. The expansion into emerging markets with growing healthcare infrastructure presents significant potential for market expansion. Furthermore, strategic partnerships and collaborations between biologics companies and medical device manufacturers can unlock synergistic growth opportunities.
Leading Players in the Spine Biologics Industry Market
- Arthrex Inc
- Exactech Inc
- Spine Wave Inc
- Johnson & Johnson (Depuy Synthes)
- Orthofix Medical Inc
- NuVasive Inc
- Stryker Corporation
- Zimmer Biomet
- Medtronic plc
Key Developments in Spine Biologics Industry Industry
- [Year/Month]: [Development – e.g., Launch of new bone graft substitute by Company X]
- [Year/Month]: [Development – e.g., Acquisition of Company Y by Company Z]
- [Year/Month]: [Development – e.g., FDA approval of novel biologic by Company A]
- [Year/Month]: [Development – e.g., Publication of positive clinical trial results for new product]
Strategic Outlook for Spine Biologics Industry Market
The Spine Biologics market is poised for continued growth, fueled by technological advancements, expanding applications, and a growing need for effective spinal treatments. The development of personalized and regenerative medicine approaches holds significant potential to shape the future of the industry. Strategic partnerships and collaborations, coupled with a focus on innovation and cost-effectiveness, will be crucial for success in this dynamic and competitive landscape.
Spine Biologics Industry Segmentation
-
1. Product
-
1.1. Bone Graft Substitutes
- 1.1.1. Bone Morphogenetic Proteins
- 1.1.2. Synthetic Bone Grafts
-
1.2. Spinal Allografts
- 1.2.1. Machined Bones Allograft
- 1.2.2. Demineralized Bone Matrix
- 1.3. Others
-
1.1. Bone Graft Substitutes
-
2. End User
- 2.1. Hospitals
- 2.2. Ambulatory Surgical Centers
- 2.3. Others
Spine Biologics Industry Segmentation By Geography
-
1. North America
- 1.1. United States
- 1.2. Canada
- 1.3. Mexico
-
2. Europe
- 2.1. Germany
- 2.2. United Kingdom
- 2.3. France
- 2.4. Italy
- 2.5. Spain
- 2.6. Rest of Europe
-
3. Asia Pacific
- 3.1. China
- 3.2. Japan
- 3.3. India
- 3.4. Australia
- 3.5. South Korea
- 3.6. Rest of Asia Pacific
-
4. Middle East and Africa
- 4.1. GCC
- 4.2. South Africa
- 4.3. Rest of Middle East and Africa
-
5. South America
- 5.1. Brazil
- 5.2. Argentina
- 5.3. Rest of South America
Spine Biologics Industry REPORT HIGHLIGHTS
| Aspects | Details |
|---|---|
| Study Period | 2019-2033 |
| Base Year | 2024 |
| Estimated Year | 2025 |
| Forecast Period | 2025-2033 |
| Historical Period | 2019-2024 |
| Growth Rate | CAGR of 4.00% from 2019-2033 |
| Segmentation |
|
Table of Contents
- 1. Introduction
- 1.1. Research Scope
- 1.2. Market Segmentation
- 1.3. Research Methodology
- 1.4. Definitions and Assumptions
- 2. Executive Summary
- 2.1. Introduction
- 3. Market Dynamics
- 3.1. Introduction
- 3.2. Market Drivers
- 3.2.1. ; Growing Geriatric Population; Growing Prevalence of Spine Deformities; Technological Advancements
- 3.3. Market Restrains
- 3.3.1. ; Reimbursement Policies
- 3.4. Market Trends
- 3.4.1. Spinal Allografts in Spinal Biologics is Estimated to Witness a Healthy Growth in Future
- 4. Market Factor Analysis
- 4.1. Porters Five Forces
- 4.2. Supply/Value Chain
- 4.3. PESTEL analysis
- 4.4. Market Entropy
- 4.5. Patent/Trademark Analysis
- 5. Global Spine Biologics Industry Analysis, Insights and Forecast, 2019-2031
- 5.1. Market Analysis, Insights and Forecast - by Product
- 5.1.1. Bone Graft Substitutes
- 5.1.1.1. Bone Morphogenetic Proteins
- 5.1.1.2. Synthetic Bone Grafts
- 5.1.2. Spinal Allografts
- 5.1.2.1. Machined Bones Allograft
- 5.1.2.2. Demineralized Bone Matrix
- 5.1.3. Others
- 5.1.1. Bone Graft Substitutes
- 5.2. Market Analysis, Insights and Forecast - by End User
- 5.2.1. Hospitals
- 5.2.2. Ambulatory Surgical Centers
- 5.2.3. Others
- 5.3. Market Analysis, Insights and Forecast - by Region
- 5.3.1. North America
- 5.3.2. Europe
- 5.3.3. Asia Pacific
- 5.3.4. Middle East and Africa
- 5.3.5. South America
- 5.1. Market Analysis, Insights and Forecast - by Product
- 6. North America Spine Biologics Industry Analysis, Insights and Forecast, 2019-2031
- 6.1. Market Analysis, Insights and Forecast - by Product
- 6.1.1. Bone Graft Substitutes
- 6.1.1.1. Bone Morphogenetic Proteins
- 6.1.1.2. Synthetic Bone Grafts
- 6.1.2. Spinal Allografts
- 6.1.2.1. Machined Bones Allograft
- 6.1.2.2. Demineralized Bone Matrix
- 6.1.3. Others
- 6.1.1. Bone Graft Substitutes
- 6.2. Market Analysis, Insights and Forecast - by End User
- 6.2.1. Hospitals
- 6.2.2. Ambulatory Surgical Centers
- 6.2.3. Others
- 6.1. Market Analysis, Insights and Forecast - by Product
- 7. Europe Spine Biologics Industry Analysis, Insights and Forecast, 2019-2031
- 7.1. Market Analysis, Insights and Forecast - by Product
- 7.1.1. Bone Graft Substitutes
- 7.1.1.1. Bone Morphogenetic Proteins
- 7.1.1.2. Synthetic Bone Grafts
- 7.1.2. Spinal Allografts
- 7.1.2.1. Machined Bones Allograft
- 7.1.2.2. Demineralized Bone Matrix
- 7.1.3. Others
- 7.1.1. Bone Graft Substitutes
- 7.2. Market Analysis, Insights and Forecast - by End User
- 7.2.1. Hospitals
- 7.2.2. Ambulatory Surgical Centers
- 7.2.3. Others
- 7.1. Market Analysis, Insights and Forecast - by Product
- 8. Asia Pacific Spine Biologics Industry Analysis, Insights and Forecast, 2019-2031
- 8.1. Market Analysis, Insights and Forecast - by Product
- 8.1.1. Bone Graft Substitutes
- 8.1.1.1. Bone Morphogenetic Proteins
- 8.1.1.2. Synthetic Bone Grafts
- 8.1.2. Spinal Allografts
- 8.1.2.1. Machined Bones Allograft
- 8.1.2.2. Demineralized Bone Matrix
- 8.1.3. Others
- 8.1.1. Bone Graft Substitutes
- 8.2. Market Analysis, Insights and Forecast - by End User
- 8.2.1. Hospitals
- 8.2.2. Ambulatory Surgical Centers
- 8.2.3. Others
- 8.1. Market Analysis, Insights and Forecast - by Product
- 9. Middle East and Africa Spine Biologics Industry Analysis, Insights and Forecast, 2019-2031
- 9.1. Market Analysis, Insights and Forecast - by Product
- 9.1.1. Bone Graft Substitutes
- 9.1.1.1. Bone Morphogenetic Proteins
- 9.1.1.2. Synthetic Bone Grafts
- 9.1.2. Spinal Allografts
- 9.1.2.1. Machined Bones Allograft
- 9.1.2.2. Demineralized Bone Matrix
- 9.1.3. Others
- 9.1.1. Bone Graft Substitutes
- 9.2. Market Analysis, Insights and Forecast - by End User
- 9.2.1. Hospitals
- 9.2.2. Ambulatory Surgical Centers
- 9.2.3. Others
- 9.1. Market Analysis, Insights and Forecast - by Product
- 10. South America Spine Biologics Industry Analysis, Insights and Forecast, 2019-2031
- 10.1. Market Analysis, Insights and Forecast - by Product
- 10.1.1. Bone Graft Substitutes
- 10.1.1.1. Bone Morphogenetic Proteins
- 10.1.1.2. Synthetic Bone Grafts
- 10.1.2. Spinal Allografts
- 10.1.2.1. Machined Bones Allograft
- 10.1.2.2. Demineralized Bone Matrix
- 10.1.3. Others
- 10.1.1. Bone Graft Substitutes
- 10.2. Market Analysis, Insights and Forecast - by End User
- 10.2.1. Hospitals
- 10.2.2. Ambulatory Surgical Centers
- 10.2.3. Others
- 10.1. Market Analysis, Insights and Forecast - by Product
- 11. North America Spine Biologics Industry Analysis, Insights and Forecast, 2019-2031
- 11.1. Market Analysis, Insights and Forecast - By Country/Sub-region
- 11.1.1 United States
- 11.1.2 Canada
- 11.1.3 Mexico
- 12. Europe Spine Biologics Industry Analysis, Insights and Forecast, 2019-2031
- 12.1. Market Analysis, Insights and Forecast - By Country/Sub-region
- 12.1.1 Germany
- 12.1.2 United Kingdom
- 12.1.3 France
- 12.1.4 Italy
- 12.1.5 Spain
- 12.1.6 Rest of Europe
- 13. Asia Pacific Spine Biologics Industry Analysis, Insights and Forecast, 2019-2031
- 13.1. Market Analysis, Insights and Forecast - By Country/Sub-region
- 13.1.1 China
- 13.1.2 Japan
- 13.1.3 India
- 13.1.4 Australia
- 13.1.5 South Korea
- 13.1.6 Rest of Asia Pacific
- 14. Middle East and Africa Spine Biologics Industry Analysis, Insights and Forecast, 2019-2031
- 14.1. Market Analysis, Insights and Forecast - By Country/Sub-region
- 14.1.1 GCC
- 14.1.2 South Africa
- 14.1.3 Rest of Middle East and Africa
- 15. South America Spine Biologics Industry Analysis, Insights and Forecast, 2019-2031
- 15.1. Market Analysis, Insights and Forecast - By Country/Sub-region
- 15.1.1 Brazil
- 15.1.2 Argentina
- 15.1.3 Rest of South America
- 16. Competitive Analysis
- 16.1. Global Market Share Analysis 2024
- 16.2. Company Profiles
- 16.2.1 Arthrex Inc
- 16.2.1.1. Overview
- 16.2.1.2. Products
- 16.2.1.3. SWOT Analysis
- 16.2.1.4. Recent Developments
- 16.2.1.5. Financials (Based on Availability)
- 16.2.2 Exactech Inc
- 16.2.2.1. Overview
- 16.2.2.2. Products
- 16.2.2.3. SWOT Analysis
- 16.2.2.4. Recent Developments
- 16.2.2.5. Financials (Based on Availability)
- 16.2.3 Spine Wave Inc
- 16.2.3.1. Overview
- 16.2.3.2. Products
- 16.2.3.3. SWOT Analysis
- 16.2.3.4. Recent Developments
- 16.2.3.5. Financials (Based on Availability)
- 16.2.4 Johnson And Johnson (Depuy Synthes)
- 16.2.4.1. Overview
- 16.2.4.2. Products
- 16.2.4.3. SWOT Analysis
- 16.2.4.4. Recent Developments
- 16.2.4.5. Financials (Based on Availability)
- 16.2.5 Orthofix Medical Inc
- 16.2.5.1. Overview
- 16.2.5.2. Products
- 16.2.5.3. SWOT Analysis
- 16.2.5.4. Recent Developments
- 16.2.5.5. Financials (Based on Availability)
- 16.2.6 NuVasive Inc
- 16.2.6.1. Overview
- 16.2.6.2. Products
- 16.2.6.3. SWOT Analysis
- 16.2.6.4. Recent Developments
- 16.2.6.5. Financials (Based on Availability)
- 16.2.7 Stryker Corporation
- 16.2.7.1. Overview
- 16.2.7.2. Products
- 16.2.7.3. SWOT Analysis
- 16.2.7.4. Recent Developments
- 16.2.7.5. Financials (Based on Availability)
- 16.2.8 Zimmer Biomet
- 16.2.8.1. Overview
- 16.2.8.2. Products
- 16.2.8.3. SWOT Analysis
- 16.2.8.4. Recent Developments
- 16.2.8.5. Financials (Based on Availability)
- 16.2.9 Medtronic plc
- 16.2.9.1. Overview
- 16.2.9.2. Products
- 16.2.9.3. SWOT Analysis
- 16.2.9.4. Recent Developments
- 16.2.9.5. Financials (Based on Availability)
- 16.2.1 Arthrex Inc
List of Figures
- Figure 1: Global Spine Biologics Industry Revenue Breakdown (Million, %) by Region 2024 & 2032
- Figure 2: North America Spine Biologics Industry Revenue (Million), by Country 2024 & 2032
- Figure 3: North America Spine Biologics Industry Revenue Share (%), by Country 2024 & 2032
- Figure 4: Europe Spine Biologics Industry Revenue (Million), by Country 2024 & 2032
- Figure 5: Europe Spine Biologics Industry Revenue Share (%), by Country 2024 & 2032
- Figure 6: Asia Pacific Spine Biologics Industry Revenue (Million), by Country 2024 & 2032
- Figure 7: Asia Pacific Spine Biologics Industry Revenue Share (%), by Country 2024 & 2032
- Figure 8: Middle East and Africa Spine Biologics Industry Revenue (Million), by Country 2024 & 2032
- Figure 9: Middle East and Africa Spine Biologics Industry Revenue Share (%), by Country 2024 & 2032
- Figure 10: South America Spine Biologics Industry Revenue (Million), by Country 2024 & 2032
- Figure 11: South America Spine Biologics Industry Revenue Share (%), by Country 2024 & 2032
- Figure 12: North America Spine Biologics Industry Revenue (Million), by Product 2024 & 2032
- Figure 13: North America Spine Biologics Industry Revenue Share (%), by Product 2024 & 2032
- Figure 14: North America Spine Biologics Industry Revenue (Million), by End User 2024 & 2032
- Figure 15: North America Spine Biologics Industry Revenue Share (%), by End User 2024 & 2032
- Figure 16: North America Spine Biologics Industry Revenue (Million), by Country 2024 & 2032
- Figure 17: North America Spine Biologics Industry Revenue Share (%), by Country 2024 & 2032
- Figure 18: Europe Spine Biologics Industry Revenue (Million), by Product 2024 & 2032
- Figure 19: Europe Spine Biologics Industry Revenue Share (%), by Product 2024 & 2032
- Figure 20: Europe Spine Biologics Industry Revenue (Million), by End User 2024 & 2032
- Figure 21: Europe Spine Biologics Industry Revenue Share (%), by End User 2024 & 2032
- Figure 22: Europe Spine Biologics Industry Revenue (Million), by Country 2024 & 2032
- Figure 23: Europe Spine Biologics Industry Revenue Share (%), by Country 2024 & 2032
- Figure 24: Asia Pacific Spine Biologics Industry Revenue (Million), by Product 2024 & 2032
- Figure 25: Asia Pacific Spine Biologics Industry Revenue Share (%), by Product 2024 & 2032
- Figure 26: Asia Pacific Spine Biologics Industry Revenue (Million), by End User 2024 & 2032
- Figure 27: Asia Pacific Spine Biologics Industry Revenue Share (%), by End User 2024 & 2032
- Figure 28: Asia Pacific Spine Biologics Industry Revenue (Million), by Country 2024 & 2032
- Figure 29: Asia Pacific Spine Biologics Industry Revenue Share (%), by Country 2024 & 2032
- Figure 30: Middle East and Africa Spine Biologics Industry Revenue (Million), by Product 2024 & 2032
- Figure 31: Middle East and Africa Spine Biologics Industry Revenue Share (%), by Product 2024 & 2032
- Figure 32: Middle East and Africa Spine Biologics Industry Revenue (Million), by End User 2024 & 2032
- Figure 33: Middle East and Africa Spine Biologics Industry Revenue Share (%), by End User 2024 & 2032
- Figure 34: Middle East and Africa Spine Biologics Industry Revenue (Million), by Country 2024 & 2032
- Figure 35: Middle East and Africa Spine Biologics Industry Revenue Share (%), by Country 2024 & 2032
- Figure 36: South America Spine Biologics Industry Revenue (Million), by Product 2024 & 2032
- Figure 37: South America Spine Biologics Industry Revenue Share (%), by Product 2024 & 2032
- Figure 38: South America Spine Biologics Industry Revenue (Million), by End User 2024 & 2032
- Figure 39: South America Spine Biologics Industry Revenue Share (%), by End User 2024 & 2032
- Figure 40: South America Spine Biologics Industry Revenue (Million), by Country 2024 & 2032
- Figure 41: South America Spine Biologics Industry Revenue Share (%), by Country 2024 & 2032
List of Tables
- Table 1: Global Spine Biologics Industry Revenue Million Forecast, by Region 2019 & 2032
- Table 2: Global Spine Biologics Industry Revenue Million Forecast, by Product 2019 & 2032
- Table 3: Global Spine Biologics Industry Revenue Million Forecast, by End User 2019 & 2032
- Table 4: Global Spine Biologics Industry Revenue Million Forecast, by Region 2019 & 2032
- Table 5: Global Spine Biologics Industry Revenue Million Forecast, by Country 2019 & 2032
- Table 6: United States Spine Biologics Industry Revenue (Million) Forecast, by Application 2019 & 2032
- Table 7: Canada Spine Biologics Industry Revenue (Million) Forecast, by Application 2019 & 2032
- Table 8: Mexico Spine Biologics Industry Revenue (Million) Forecast, by Application 2019 & 2032
- Table 9: Global Spine Biologics Industry Revenue Million Forecast, by Country 2019 & 2032
- Table 10: Germany Spine Biologics Industry Revenue (Million) Forecast, by Application 2019 & 2032
- Table 11: United Kingdom Spine Biologics Industry Revenue (Million) Forecast, by Application 2019 & 2032
- Table 12: France Spine Biologics Industry Revenue (Million) Forecast, by Application 2019 & 2032
- Table 13: Italy Spine Biologics Industry Revenue (Million) Forecast, by Application 2019 & 2032
- Table 14: Spain Spine Biologics Industry Revenue (Million) Forecast, by Application 2019 & 2032
- Table 15: Rest of Europe Spine Biologics Industry Revenue (Million) Forecast, by Application 2019 & 2032
- Table 16: Global Spine Biologics Industry Revenue Million Forecast, by Country 2019 & 2032
- Table 17: China Spine Biologics Industry Revenue (Million) Forecast, by Application 2019 & 2032
- Table 18: Japan Spine Biologics Industry Revenue (Million) Forecast, by Application 2019 & 2032
- Table 19: India Spine Biologics Industry Revenue (Million) Forecast, by Application 2019 & 2032
- Table 20: Australia Spine Biologics Industry Revenue (Million) Forecast, by Application 2019 & 2032
- Table 21: South Korea Spine Biologics Industry Revenue (Million) Forecast, by Application 2019 & 2032
- Table 22: Rest of Asia Pacific Spine Biologics Industry Revenue (Million) Forecast, by Application 2019 & 2032
- Table 23: Global Spine Biologics Industry Revenue Million Forecast, by Country 2019 & 2032
- Table 24: GCC Spine Biologics Industry Revenue (Million) Forecast, by Application 2019 & 2032
- Table 25: South Africa Spine Biologics Industry Revenue (Million) Forecast, by Application 2019 & 2032
- Table 26: Rest of Middle East and Africa Spine Biologics Industry Revenue (Million) Forecast, by Application 2019 & 2032
- Table 27: Global Spine Biologics Industry Revenue Million Forecast, by Country 2019 & 2032
- Table 28: Brazil Spine Biologics Industry Revenue (Million) Forecast, by Application 2019 & 2032
- Table 29: Argentina Spine Biologics Industry Revenue (Million) Forecast, by Application 2019 & 2032
- Table 30: Rest of South America Spine Biologics Industry Revenue (Million) Forecast, by Application 2019 & 2032
- Table 31: Global Spine Biologics Industry Revenue Million Forecast, by Product 2019 & 2032
- Table 32: Global Spine Biologics Industry Revenue Million Forecast, by End User 2019 & 2032
- Table 33: Global Spine Biologics Industry Revenue Million Forecast, by Country 2019 & 2032
- Table 34: United States Spine Biologics Industry Revenue (Million) Forecast, by Application 2019 & 2032
- Table 35: Canada Spine Biologics Industry Revenue (Million) Forecast, by Application 2019 & 2032
- Table 36: Mexico Spine Biologics Industry Revenue (Million) Forecast, by Application 2019 & 2032
- Table 37: Global Spine Biologics Industry Revenue Million Forecast, by Product 2019 & 2032
- Table 38: Global Spine Biologics Industry Revenue Million Forecast, by End User 2019 & 2032
- Table 39: Global Spine Biologics Industry Revenue Million Forecast, by Country 2019 & 2032
- Table 40: Germany Spine Biologics Industry Revenue (Million) Forecast, by Application 2019 & 2032
- Table 41: United Kingdom Spine Biologics Industry Revenue (Million) Forecast, by Application 2019 & 2032
- Table 42: France Spine Biologics Industry Revenue (Million) Forecast, by Application 2019 & 2032
- Table 43: Italy Spine Biologics Industry Revenue (Million) Forecast, by Application 2019 & 2032
- Table 44: Spain Spine Biologics Industry Revenue (Million) Forecast, by Application 2019 & 2032
- Table 45: Rest of Europe Spine Biologics Industry Revenue (Million) Forecast, by Application 2019 & 2032
- Table 46: Global Spine Biologics Industry Revenue Million Forecast, by Product 2019 & 2032
- Table 47: Global Spine Biologics Industry Revenue Million Forecast, by End User 2019 & 2032
- Table 48: Global Spine Biologics Industry Revenue Million Forecast, by Country 2019 & 2032
- Table 49: China Spine Biologics Industry Revenue (Million) Forecast, by Application 2019 & 2032
- Table 50: Japan Spine Biologics Industry Revenue (Million) Forecast, by Application 2019 & 2032
- Table 51: India Spine Biologics Industry Revenue (Million) Forecast, by Application 2019 & 2032
- Table 52: Australia Spine Biologics Industry Revenue (Million) Forecast, by Application 2019 & 2032
- Table 53: South Korea Spine Biologics Industry Revenue (Million) Forecast, by Application 2019 & 2032
- Table 54: Rest of Asia Pacific Spine Biologics Industry Revenue (Million) Forecast, by Application 2019 & 2032
- Table 55: Global Spine Biologics Industry Revenue Million Forecast, by Product 2019 & 2032
- Table 56: Global Spine Biologics Industry Revenue Million Forecast, by End User 2019 & 2032
- Table 57: Global Spine Biologics Industry Revenue Million Forecast, by Country 2019 & 2032
- Table 58: GCC Spine Biologics Industry Revenue (Million) Forecast, by Application 2019 & 2032
- Table 59: South Africa Spine Biologics Industry Revenue (Million) Forecast, by Application 2019 & 2032
- Table 60: Rest of Middle East and Africa Spine Biologics Industry Revenue (Million) Forecast, by Application 2019 & 2032
- Table 61: Global Spine Biologics Industry Revenue Million Forecast, by Product 2019 & 2032
- Table 62: Global Spine Biologics Industry Revenue Million Forecast, by End User 2019 & 2032
- Table 63: Global Spine Biologics Industry Revenue Million Forecast, by Country 2019 & 2032
- Table 64: Brazil Spine Biologics Industry Revenue (Million) Forecast, by Application 2019 & 2032
- Table 65: Argentina Spine Biologics Industry Revenue (Million) Forecast, by Application 2019 & 2032
- Table 66: Rest of South America Spine Biologics Industry Revenue (Million) Forecast, by Application 2019 & 2032
Frequently Asked Questions
1. What is the projected Compound Annual Growth Rate (CAGR) of the Spine Biologics Industry?
The projected CAGR is approximately 4.00%.
2. Which companies are prominent players in the Spine Biologics Industry?
Key companies in the market include Arthrex Inc, Exactech Inc, Spine Wave Inc, Johnson And Johnson (Depuy Synthes), Orthofix Medical Inc, NuVasive Inc , Stryker Corporation, Zimmer Biomet, Medtronic plc.
3. What are the main segments of the Spine Biologics Industry?
The market segments include Product, End User.
4. Can you provide details about the market size?
The market size is estimated to be USD XX Million as of 2022.
5. What are some drivers contributing to market growth?
; Growing Geriatric Population; Growing Prevalence of Spine Deformities; Technological Advancements.
6. What are the notable trends driving market growth?
Spinal Allografts in Spinal Biologics is Estimated to Witness a Healthy Growth in Future.
7. Are there any restraints impacting market growth?
; Reimbursement Policies.
8. Can you provide examples of recent developments in the market?
N/A
9. What pricing options are available for accessing the report?
Pricing options include single-user, multi-user, and enterprise licenses priced at USD 4750, USD 5250, and USD 8750 respectively.
10. Is the market size provided in terms of value or volume?
The market size is provided in terms of value, measured in Million.
11. Are there any specific market keywords associated with the report?
Yes, the market keyword associated with the report is "Spine Biologics Industry," which aids in identifying and referencing the specific market segment covered.
12. How do I determine which pricing option suits my needs best?
The pricing options vary based on user requirements and access needs. Individual users may opt for single-user licenses, while businesses requiring broader access may choose multi-user or enterprise licenses for cost-effective access to the report.
13. Are there any additional resources or data provided in the Spine Biologics Industry report?
While the report offers comprehensive insights, it's advisable to review the specific contents or supplementary materials provided to ascertain if additional resources or data are available.
14. How can I stay updated on further developments or reports in the Spine Biologics Industry?
To stay informed about further developments, trends, and reports in the Spine Biologics Industry, consider subscribing to industry newsletters, following relevant companies and organizations, or regularly checking reputable industry news sources and publications.
Methodology
Step 1 - Identification of Relevant Samples Size from Population Database


Step 2 - Approaches for Defining Global Market Size (Value, Volume* & Price*)

Note*: In applicable scenarios
Step 3 - Data Sources
Primary Research
- Web Analytics
- Survey Reports
- Research Institute
- Latest Research Reports
- Opinion Leaders
Secondary Research
- Annual Reports
- White Paper
- Latest Press Release
- Industry Association
- Paid Database
- Investor Presentations

Step 4 - Data Triangulation
Involves using different sources of information in order to increase the validity of a study
These sources are likely to be stakeholders in a program - participants, other researchers, program staff, other community members, and so on.
Then we put all data in single framework & apply various statistical tools to find out the dynamic on the market.
During the analysis stage, feedback from the stakeholder groups would be compared to determine areas of agreement as well as areas of divergence


