
Key Insights
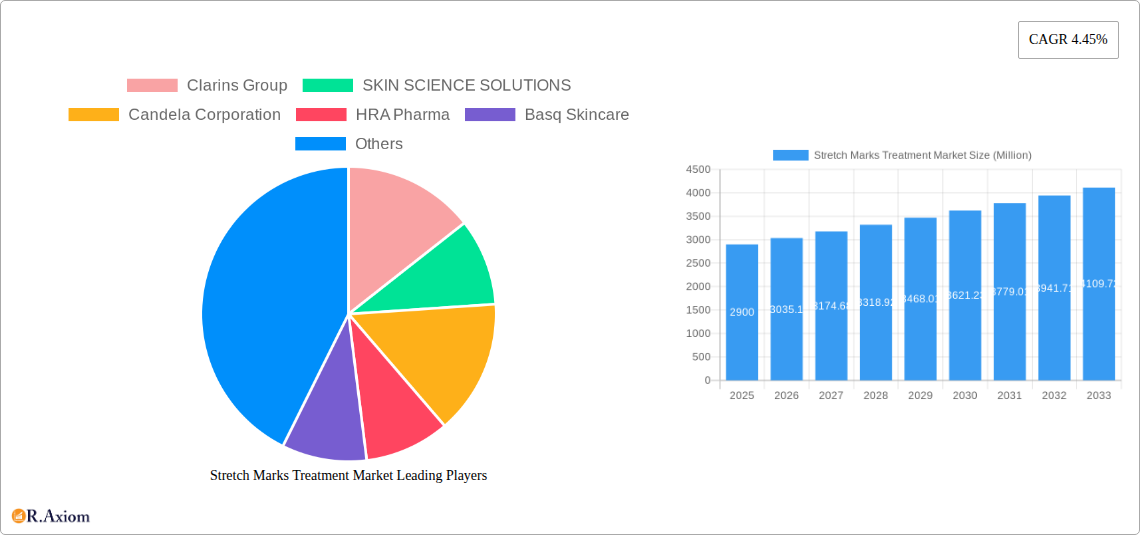
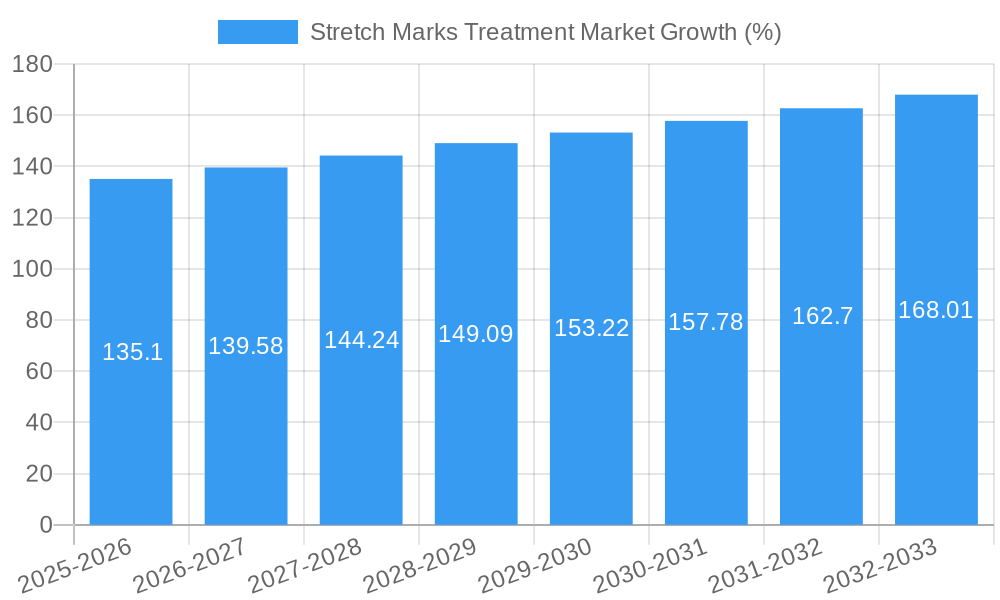
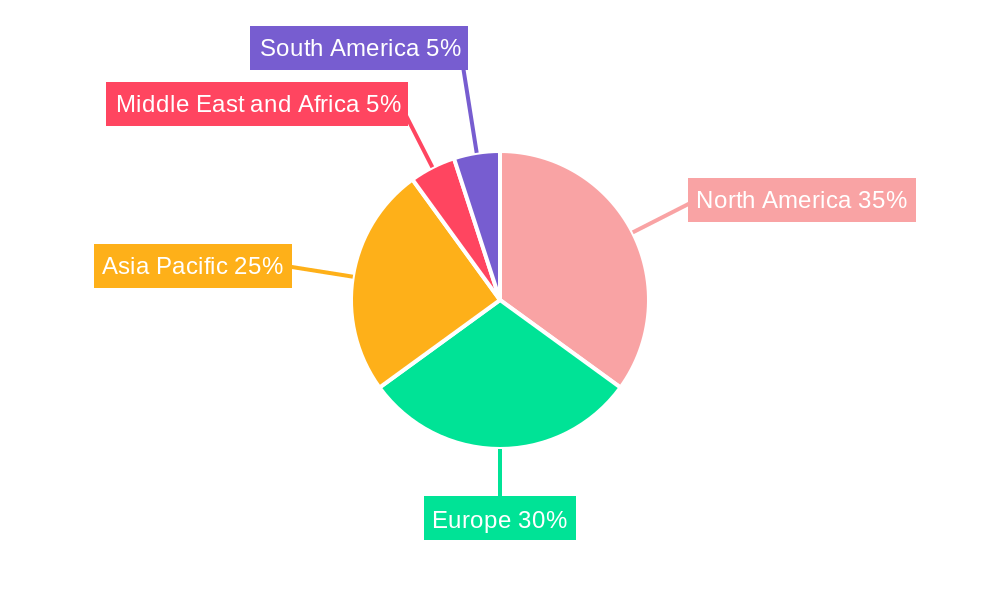
The global stretch marks treatment market, valued at $2.90 billion in 2025, is projected to experience robust growth, driven by rising awareness about body image and the increasing prevalence of stretch marks across diverse demographics. A compound annual growth rate (CAGR) of 4.45% from 2025 to 2033 indicates a significant market expansion, fueled by several key factors. The rising adoption of minimally invasive procedures like laser treatments and the expanding availability of effective topical creams and lotions contribute to this growth. Furthermore, the increasing disposable incomes in emerging economies and the growing popularity of aesthetic treatments are bolstering market demand. The market segmentation reveals a strong preference for topical products, representing a significant portion of the market share due to convenience and affordability. However, the laser treatment segment is expected to witness substantial growth due to its efficacy and relatively quicker results compared to topical treatments. The home-use segment is also showing significant growth potential, driven by the increasing availability of at-home treatment options and the convenience they offer. While the high cost of certain treatments, particularly laser therapies, may pose a restraint, the overall market outlook remains positive, driven by consumer demand for effective stretch mark reduction solutions. The geographic segmentation indicates North America and Europe as leading markets, driven by high disposable incomes and a high level of awareness of aesthetic treatments. However, emerging markets in Asia Pacific and Latin America are expected to demonstrate significant growth potential in the coming years due to rising affluence and increased adoption rates.
The competitive landscape is characterized by a mix of established multinational corporations and specialized smaller companies. Key players are investing heavily in research and development to introduce innovative and highly effective products. This competitive landscape fosters innovation, leading to the development of advanced technologies and formulations, thereby fueling further market growth. Strategic partnerships and collaborations are also becoming common amongst market participants, aimed at expanding their product portfolio and geographic reach. Future growth will likely be driven by technological advancements in laser treatments, the development of more effective topical solutions, and a continued rise in consumer awareness regarding stretch mark treatment options. The market's future depends on the ongoing development of safer, more effective, and more accessible treatments.
This comprehensive report provides a detailed analysis of the global Stretch Marks Treatment Market, offering valuable insights for industry stakeholders, investors, and researchers. The study period covers 2019-2033, with 2025 as the base and estimated year, and a forecast period of 2025-2033. The historical period analyzed is 2019-2024. The report segments the market by treatment type (Topical Products, Laser, Other Treatments) and end-user (Hospitals and Clinics, Home Use), providing a granular understanding of market dynamics and growth potential. The market size is projected to reach xx Million by 2033.
Stretch Marks Treatment Market Market Concentration & Innovation
This section analyzes the competitive landscape of the stretch marks treatment market, examining market concentration, innovation drivers, regulatory frameworks, product substitutes, end-user trends, and mergers and acquisitions (M&A) activities. The market exhibits a moderately concentrated structure with key players holding significant market share. However, the emergence of innovative technologies and new entrants is gradually increasing competition.
- Market Share: The top five players collectively hold approximately xx% of the global market share in 2025, with Clarins Group, Skin Science Solutions, and Candela Corporation among the leading companies. Exact market share percentages will be detailed in the full report.
- Innovation Drivers: The demand for effective and non-invasive treatments is driving innovation in the market, with a focus on developing advanced topical products, minimally invasive laser technologies, and other innovative treatments. Regulatory approvals and technological advancements significantly impact market growth.
- Regulatory Frameworks: Stringent regulatory requirements for medical devices and cosmetic products influence market entry and product development strategies. Variations in regulations across different geographies impact market dynamics.
- Product Substitutes: Home remedies and traditional treatments act as substitutes but lack the efficacy and convenience of modern stretch mark treatments.
- End-User Trends: Increasing awareness of aesthetic concerns and a growing preference for non-invasive procedures are driving demand, especially among younger demographics.
- M&A Activities: The past five years have witnessed xx M&A deals in the stretch marks treatment market, with an average deal value of xx Million. These activities are primarily focused on expanding product portfolios and market reach.
Stretch Marks Treatment Market Industry Trends & Insights
This section delves into the key trends and insights shaping the stretch marks treatment market. The market is experiencing significant growth, driven by factors such as rising disposable incomes, increasing awareness about body image, and advancements in treatment technologies.
The market is projected to witness a Compound Annual Growth Rate (CAGR) of xx% during the forecast period (2025-2033). Market penetration of non-invasive treatments, particularly laser therapies, is increasing steadily due to their effectiveness and minimal downtime. Consumer preferences are shifting towards minimally invasive, technologically advanced solutions with faster results and reduced side effects. Intense competition among established players and new entrants is driving innovation and price reductions. The growing popularity of at-home treatments is also influencing market dynamics. Detailed analysis of consumer demographics, preferences and purchasing behavior is included in the full report.
Dominant Markets & Segments in Stretch Marks Treatment Market
This section identifies the leading regions, countries, and market segments within the stretch marks treatment market.
- Leading Region: North America is projected to dominate the market during the forecast period, driven by high disposable incomes, advanced healthcare infrastructure, and greater awareness of aesthetic procedures.
- Leading Country: The United States is the largest market within North America and globally.
Key Drivers for Dominance:
- North America: High disposable incomes, advanced healthcare infrastructure, early adoption of new technologies, and a strong focus on aesthetic enhancements.
- United States: High consumer spending on personal care and beauty products, increasing adoption of minimally invasive procedures, and extensive marketing efforts by industry players.
Segment Analysis:
- Topical Products: This segment is projected to retain a significant market share due to its accessibility, affordability, and ease of use. The market will see continued innovation in formulations and ingredients.
- Laser Treatments: This segment is growing rapidly, driven by technological advancements that lead to more precise and effective treatments. However, the relatively higher cost compared to topical products remains a limiting factor.
- Other Treatments: This segment includes a range of treatments such as microneedling and chemical peels. Growth in this segment will be influenced by innovations and advancements in non-laser based technologies.
- Hospitals and Clinics: This segment holds a significant share due to access to advanced equipment and expertise, but is constrained by higher treatment costs.
- Home Use: The home-use segment is expected to experience substantial growth, driven by the increasing availability of effective over-the-counter products and home-use devices.
Stretch Marks Treatment Market Product Developments
Recent years have witnessed significant product innovations in the stretch marks treatment market, driven by advancements in laser technology, topical formulations, and other treatment modalities. New products focus on improved efficacy, reduced side effects, and enhanced patient experience. Companies are actively investing in research and development to create more effective and targeted therapies. The market is witnessing a shift towards personalized treatments that cater to specific skin types and conditions.
Report Scope & Segmentation Analysis
This report provides a comprehensive analysis of the global stretch marks treatment market, segmented by treatment type (Topical Products, Laser, Other Treatments) and end-user (Hospitals and Clinics, Home Use). Each segment is analyzed in terms of its market size, growth rate, competitive landscape, and key drivers. Growth projections are provided for each segment over the forecast period (2025-2033). Competitive dynamics, including market share and strategic initiatives of key players, are also detailed for each segment.
Key Drivers of Stretch Marks Treatment Market Growth
The market's growth is propelled by several key factors:
- Rising disposable incomes: Increased affordability of aesthetic treatments fuels market expansion.
- Growing awareness of body image: Greater consumer concern regarding stretch marks drives demand for effective solutions.
- Technological advancements: Innovations in laser technology and topical formulations enhance treatment efficacy.
- Favorable regulatory environment: Clearer guidelines and approvals streamline market entry for new products.
Challenges in the Stretch Marks Treatment Market Sector
Several challenges hinder market growth:
- High treatment costs: Laser treatments and other advanced procedures can be expensive, limiting access for some consumers.
- Potential side effects: Some treatments may have side effects, impacting consumer acceptance.
- Competition: Intense competition among established players and emerging companies can pressure profit margins.
- Regulatory hurdles: Navigating complex regulatory approvals can be time-consuming and costly for new product launches.
Emerging Opportunities in Stretch Marks Treatment Market
Several emerging opportunities promise future growth:
- Personalized treatments: Tailoring treatments to individual needs will enhance efficacy and satisfaction.
- Technological advancements: Innovations in nanotechnology and other advanced materials will lead to more effective topical products and minimally invasive procedures.
- Growing demand for home-use products: Expanding the accessibility of effective home-use treatments will broaden the market.
- Untapped markets in developing economies: Increasing awareness and rising disposable incomes will unlock significant opportunities in these regions.
Leading Players in the Stretch Marks Treatment Market Market
- Clarins Group
- SKIN SCIENCE SOLUTIONS
- Candela Corporation
- HRA Pharma
- Basq Skincare
- Weleda AG
- Union Swiss (Pty) Ltd
- Dermaclara Inc
- Helix BioMedix Inc
- Laboratoires Expanscience
- Alliance Pharma PLC
- E T Browne Drug Co Inc (Palmers)
Key Developments in Stretch Marks Treatment Market Industry
- May 2022: Givaudan Active Beauty launched Centella CAST, a new ingredient for improving skin elasticity and reducing the appearance of stretch marks.
- April 2022: Skin Science Solutions launched Icoone Roboderm, a new device for non-invasive facial and body rejuvenation, including stretch mark treatment.
Strategic Outlook for Stretch Marks Treatment Market Market
The stretch marks treatment market presents a promising outlook, fueled by continuous technological advancements, growing consumer awareness, and favorable regulatory landscapes. The market will likely witness further consolidation through M&A activities, alongside an increasing focus on personalized and minimally invasive treatments. Expansion into untapped markets and the development of innovative, effective, and safe products will drive future growth. Further market expansion can be anticipated in developing economies with increasing disposable incomes and rising aesthetic awareness.
Stretch Marks Treatment Market Segmentation
-
1. Treatment
-
1.1. Topical Products
- 1.1.1. Creams
- 1.1.2. Oils and Serum
- 1.1.3. Lotion
-
1.2. Laser
- 1.2.1. Fractional Lasers
- 1.2.2. Pulse-dye Lasers
- 1.2.3. Other Lasers
- 1.3. Other Treatments
-
1.1. Topical Products
-
2. End User
- 2.1. Hospitals and Clinics
- 2.2. Home Use
Stretch Marks Treatment Market Segmentation By Geography
-
1. North America
- 1.1. United States
- 1.2. Canada
- 1.3. Mexico
-
2. Europe
- 2.1. Germany
- 2.2. United Kingdom
- 2.3. France
- 2.4. Italy
- 2.5. Spain
- 2.6. Rest of Europe
-
3. Asia Pacific
- 3.1. China
- 3.2. Japan
- 3.3. India
- 3.4. Australia
- 3.5. South Korea
- 3.6. Rest of Asia Pacific
-
4. Middle East and Africa
- 4.1. GCC
- 4.2. South Africa
- 4.3. Rest of Middle East and Africa
-
5. South America
- 5.1. Brazil
- 5.2. Argentina
- 5.3. Rest of South America
Stretch Marks Treatment Market REPORT HIGHLIGHTS
| Aspects | Details |
|---|---|
| Study Period | 2019-2033 |
| Base Year | 2024 |
| Estimated Year | 2025 |
| Forecast Period | 2025-2033 |
| Historical Period | 2019-2024 |
| Growth Rate | CAGR of 4.45% from 2019-2033 |
| Segmentation |
|
Table of Contents
- 1. Introduction
- 1.1. Research Scope
- 1.2. Market Segmentation
- 1.3. Research Methodology
- 1.4. Definitions and Assumptions
- 2. Executive Summary
- 2.1. Introduction
- 3. Market Dynamics
- 3.1. Introduction
- 3.2. Market Drivers
- 3.2.1. Growing Burden of Obesity Worldwide; Increasing Number of Pregnancies and Concerns About Stretch Marks
- 3.3. Market Restrains
- 3.3.1. High Cost of Laser and Microdermabrasion Treatment
- 3.4. Market Trends
- 3.4.1. Oils and Serum in the Topical Treatment Segment are Expected to Hold a Major Share of the Market
- 4. Market Factor Analysis
- 4.1. Porters Five Forces
- 4.2. Supply/Value Chain
- 4.3. PESTEL analysis
- 4.4. Market Entropy
- 4.5. Patent/Trademark Analysis
- 5. Global Stretch Marks Treatment Market Analysis, Insights and Forecast, 2019-2031
- 5.1. Market Analysis, Insights and Forecast - by Treatment
- 5.1.1. Topical Products
- 5.1.1.1. Creams
- 5.1.1.2. Oils and Serum
- 5.1.1.3. Lotion
- 5.1.2. Laser
- 5.1.2.1. Fractional Lasers
- 5.1.2.2. Pulse-dye Lasers
- 5.1.2.3. Other Lasers
- 5.1.3. Other Treatments
- 5.1.1. Topical Products
- 5.2. Market Analysis, Insights and Forecast - by End User
- 5.2.1. Hospitals and Clinics
- 5.2.2. Home Use
- 5.3. Market Analysis, Insights and Forecast - by Region
- 5.3.1. North America
- 5.3.2. Europe
- 5.3.3. Asia Pacific
- 5.3.4. Middle East and Africa
- 5.3.5. South America
- 5.1. Market Analysis, Insights and Forecast - by Treatment
- 6. North America Stretch Marks Treatment Market Analysis, Insights and Forecast, 2019-2031
- 6.1. Market Analysis, Insights and Forecast - by Treatment
- 6.1.1. Topical Products
- 6.1.1.1. Creams
- 6.1.1.2. Oils and Serum
- 6.1.1.3. Lotion
- 6.1.2. Laser
- 6.1.2.1. Fractional Lasers
- 6.1.2.2. Pulse-dye Lasers
- 6.1.2.3. Other Lasers
- 6.1.3. Other Treatments
- 6.1.1. Topical Products
- 6.2. Market Analysis, Insights and Forecast - by End User
- 6.2.1. Hospitals and Clinics
- 6.2.2. Home Use
- 6.1. Market Analysis, Insights and Forecast - by Treatment
- 7. Europe Stretch Marks Treatment Market Analysis, Insights and Forecast, 2019-2031
- 7.1. Market Analysis, Insights and Forecast - by Treatment
- 7.1.1. Topical Products
- 7.1.1.1. Creams
- 7.1.1.2. Oils and Serum
- 7.1.1.3. Lotion
- 7.1.2. Laser
- 7.1.2.1. Fractional Lasers
- 7.1.2.2. Pulse-dye Lasers
- 7.1.2.3. Other Lasers
- 7.1.3. Other Treatments
- 7.1.1. Topical Products
- 7.2. Market Analysis, Insights and Forecast - by End User
- 7.2.1. Hospitals and Clinics
- 7.2.2. Home Use
- 7.1. Market Analysis, Insights and Forecast - by Treatment
- 8. Asia Pacific Stretch Marks Treatment Market Analysis, Insights and Forecast, 2019-2031
- 8.1. Market Analysis, Insights and Forecast - by Treatment
- 8.1.1. Topical Products
- 8.1.1.1. Creams
- 8.1.1.2. Oils and Serum
- 8.1.1.3. Lotion
- 8.1.2. Laser
- 8.1.2.1. Fractional Lasers
- 8.1.2.2. Pulse-dye Lasers
- 8.1.2.3. Other Lasers
- 8.1.3. Other Treatments
- 8.1.1. Topical Products
- 8.2. Market Analysis, Insights and Forecast - by End User
- 8.2.1. Hospitals and Clinics
- 8.2.2. Home Use
- 8.1. Market Analysis, Insights and Forecast - by Treatment
- 9. Middle East and Africa Stretch Marks Treatment Market Analysis, Insights and Forecast, 2019-2031
- 9.1. Market Analysis, Insights and Forecast - by Treatment
- 9.1.1. Topical Products
- 9.1.1.1. Creams
- 9.1.1.2. Oils and Serum
- 9.1.1.3. Lotion
- 9.1.2. Laser
- 9.1.2.1. Fractional Lasers
- 9.1.2.2. Pulse-dye Lasers
- 9.1.2.3. Other Lasers
- 9.1.3. Other Treatments
- 9.1.1. Topical Products
- 9.2. Market Analysis, Insights and Forecast - by End User
- 9.2.1. Hospitals and Clinics
- 9.2.2. Home Use
- 9.1. Market Analysis, Insights and Forecast - by Treatment
- 10. South America Stretch Marks Treatment Market Analysis, Insights and Forecast, 2019-2031
- 10.1. Market Analysis, Insights and Forecast - by Treatment
- 10.1.1. Topical Products
- 10.1.1.1. Creams
- 10.1.1.2. Oils and Serum
- 10.1.1.3. Lotion
- 10.1.2. Laser
- 10.1.2.1. Fractional Lasers
- 10.1.2.2. Pulse-dye Lasers
- 10.1.2.3. Other Lasers
- 10.1.3. Other Treatments
- 10.1.1. Topical Products
- 10.2. Market Analysis, Insights and Forecast - by End User
- 10.2.1. Hospitals and Clinics
- 10.2.2. Home Use
- 10.1. Market Analysis, Insights and Forecast - by Treatment
- 11. North America Stretch Marks Treatment Market Analysis, Insights and Forecast, 2019-2031
- 11.1. Market Analysis, Insights and Forecast - By Country/Sub-region
- 11.1.1 United States
- 11.1.2 Canada
- 11.1.3 Mexico
- 12. Europe Stretch Marks Treatment Market Analysis, Insights and Forecast, 2019-2031
- 12.1. Market Analysis, Insights and Forecast - By Country/Sub-region
- 12.1.1 Germany
- 12.1.2 United Kingdom
- 12.1.3 France
- 12.1.4 Italy
- 12.1.5 Spain
- 12.1.6 Rest of Europe
- 13. Asia Pacific Stretch Marks Treatment Market Analysis, Insights and Forecast, 2019-2031
- 13.1. Market Analysis, Insights and Forecast - By Country/Sub-region
- 13.1.1 China
- 13.1.2 Japan
- 13.1.3 India
- 13.1.4 Australia
- 13.1.5 South Korea
- 13.1.6 Rest of Asia Pacific
- 14. Middle East and Africa Stretch Marks Treatment Market Analysis, Insights and Forecast, 2019-2031
- 14.1. Market Analysis, Insights and Forecast - By Country/Sub-region
- 14.1.1 GCC
- 14.1.2 South Africa
- 14.1.3 Rest of Middle East and Africa
- 15. South America Stretch Marks Treatment Market Analysis, Insights and Forecast, 2019-2031
- 15.1. Market Analysis, Insights and Forecast - By Country/Sub-region
- 15.1.1 Brazil
- 15.1.2 Argentina
- 15.1.3 Rest of South America
- 16. Competitive Analysis
- 16.1. Global Market Share Analysis 2024
- 16.2. Company Profiles
- 16.2.1 Clarins Group
- 16.2.1.1. Overview
- 16.2.1.2. Products
- 16.2.1.3. SWOT Analysis
- 16.2.1.4. Recent Developments
- 16.2.1.5. Financials (Based on Availability)
- 16.2.2 SKIN SCIENCE SOLUTIONS
- 16.2.2.1. Overview
- 16.2.2.2. Products
- 16.2.2.3. SWOT Analysis
- 16.2.2.4. Recent Developments
- 16.2.2.5. Financials (Based on Availability)
- 16.2.3 Candela Corporation
- 16.2.3.1. Overview
- 16.2.3.2. Products
- 16.2.3.3. SWOT Analysis
- 16.2.3.4. Recent Developments
- 16.2.3.5. Financials (Based on Availability)
- 16.2.4 HRA Pharma
- 16.2.4.1. Overview
- 16.2.4.2. Products
- 16.2.4.3. SWOT Analysis
- 16.2.4.4. Recent Developments
- 16.2.4.5. Financials (Based on Availability)
- 16.2.5 Basq Skincare
- 16.2.5.1. Overview
- 16.2.5.2. Products
- 16.2.5.3. SWOT Analysis
- 16.2.5.4. Recent Developments
- 16.2.5.5. Financials (Based on Availability)
- 16.2.6 Weleda AG
- 16.2.6.1. Overview
- 16.2.6.2. Products
- 16.2.6.3. SWOT Analysis
- 16.2.6.4. Recent Developments
- 16.2.6.5. Financials (Based on Availability)
- 16.2.7 Union Swiss (Pty) Ltd
- 16.2.7.1. Overview
- 16.2.7.2. Products
- 16.2.7.3. SWOT Analysis
- 16.2.7.4. Recent Developments
- 16.2.7.5. Financials (Based on Availability)
- 16.2.8 Dermaclara Inc
- 16.2.8.1. Overview
- 16.2.8.2. Products
- 16.2.8.3. SWOT Analysis
- 16.2.8.4. Recent Developments
- 16.2.8.5. Financials (Based on Availability)
- 16.2.9 Helix BioMedix Inc
- 16.2.9.1. Overview
- 16.2.9.2. Products
- 16.2.9.3. SWOT Analysis
- 16.2.9.4. Recent Developments
- 16.2.9.5. Financials (Based on Availability)
- 16.2.10 Laboratoires Expanscience
- 16.2.10.1. Overview
- 16.2.10.2. Products
- 16.2.10.3. SWOT Analysis
- 16.2.10.4. Recent Developments
- 16.2.10.5. Financials (Based on Availability)
- 16.2.11 Alliance Pharma PLC
- 16.2.11.1. Overview
- 16.2.11.2. Products
- 16.2.11.3. SWOT Analysis
- 16.2.11.4. Recent Developments
- 16.2.11.5. Financials (Based on Availability)
- 16.2.12 E T Browne Drug Co Inc (Palmers)
- 16.2.12.1. Overview
- 16.2.12.2. Products
- 16.2.12.3. SWOT Analysis
- 16.2.12.4. Recent Developments
- 16.2.12.5. Financials (Based on Availability)
- 16.2.1 Clarins Group
List of Figures
- Figure 1: Global Stretch Marks Treatment Market Revenue Breakdown (Million, %) by Region 2024 & 2032
- Figure 2: Global Stretch Marks Treatment Market Volume Breakdown (K Unit, %) by Region 2024 & 2032
- Figure 3: North America Stretch Marks Treatment Market Revenue (Million), by Country 2024 & 2032
- Figure 4: North America Stretch Marks Treatment Market Volume (K Unit), by Country 2024 & 2032
- Figure 5: North America Stretch Marks Treatment Market Revenue Share (%), by Country 2024 & 2032
- Figure 6: North America Stretch Marks Treatment Market Volume Share (%), by Country 2024 & 2032
- Figure 7: Europe Stretch Marks Treatment Market Revenue (Million), by Country 2024 & 2032
- Figure 8: Europe Stretch Marks Treatment Market Volume (K Unit), by Country 2024 & 2032
- Figure 9: Europe Stretch Marks Treatment Market Revenue Share (%), by Country 2024 & 2032
- Figure 10: Europe Stretch Marks Treatment Market Volume Share (%), by Country 2024 & 2032
- Figure 11: Asia Pacific Stretch Marks Treatment Market Revenue (Million), by Country 2024 & 2032
- Figure 12: Asia Pacific Stretch Marks Treatment Market Volume (K Unit), by Country 2024 & 2032
- Figure 13: Asia Pacific Stretch Marks Treatment Market Revenue Share (%), by Country 2024 & 2032
- Figure 14: Asia Pacific Stretch Marks Treatment Market Volume Share (%), by Country 2024 & 2032
- Figure 15: Middle East and Africa Stretch Marks Treatment Market Revenue (Million), by Country 2024 & 2032
- Figure 16: Middle East and Africa Stretch Marks Treatment Market Volume (K Unit), by Country 2024 & 2032
- Figure 17: Middle East and Africa Stretch Marks Treatment Market Revenue Share (%), by Country 2024 & 2032
- Figure 18: Middle East and Africa Stretch Marks Treatment Market Volume Share (%), by Country 2024 & 2032
- Figure 19: South America Stretch Marks Treatment Market Revenue (Million), by Country 2024 & 2032
- Figure 20: South America Stretch Marks Treatment Market Volume (K Unit), by Country 2024 & 2032
- Figure 21: South America Stretch Marks Treatment Market Revenue Share (%), by Country 2024 & 2032
- Figure 22: South America Stretch Marks Treatment Market Volume Share (%), by Country 2024 & 2032
- Figure 23: North America Stretch Marks Treatment Market Revenue (Million), by Treatment 2024 & 2032
- Figure 24: North America Stretch Marks Treatment Market Volume (K Unit), by Treatment 2024 & 2032
- Figure 25: North America Stretch Marks Treatment Market Revenue Share (%), by Treatment 2024 & 2032
- Figure 26: North America Stretch Marks Treatment Market Volume Share (%), by Treatment 2024 & 2032
- Figure 27: North America Stretch Marks Treatment Market Revenue (Million), by End User 2024 & 2032
- Figure 28: North America Stretch Marks Treatment Market Volume (K Unit), by End User 2024 & 2032
- Figure 29: North America Stretch Marks Treatment Market Revenue Share (%), by End User 2024 & 2032
- Figure 30: North America Stretch Marks Treatment Market Volume Share (%), by End User 2024 & 2032
- Figure 31: North America Stretch Marks Treatment Market Revenue (Million), by Country 2024 & 2032
- Figure 32: North America Stretch Marks Treatment Market Volume (K Unit), by Country 2024 & 2032
- Figure 33: North America Stretch Marks Treatment Market Revenue Share (%), by Country 2024 & 2032
- Figure 34: North America Stretch Marks Treatment Market Volume Share (%), by Country 2024 & 2032
- Figure 35: Europe Stretch Marks Treatment Market Revenue (Million), by Treatment 2024 & 2032
- Figure 36: Europe Stretch Marks Treatment Market Volume (K Unit), by Treatment 2024 & 2032
- Figure 37: Europe Stretch Marks Treatment Market Revenue Share (%), by Treatment 2024 & 2032
- Figure 38: Europe Stretch Marks Treatment Market Volume Share (%), by Treatment 2024 & 2032
- Figure 39: Europe Stretch Marks Treatment Market Revenue (Million), by End User 2024 & 2032
- Figure 40: Europe Stretch Marks Treatment Market Volume (K Unit), by End User 2024 & 2032
- Figure 41: Europe Stretch Marks Treatment Market Revenue Share (%), by End User 2024 & 2032
- Figure 42: Europe Stretch Marks Treatment Market Volume Share (%), by End User 2024 & 2032
- Figure 43: Europe Stretch Marks Treatment Market Revenue (Million), by Country 2024 & 2032
- Figure 44: Europe Stretch Marks Treatment Market Volume (K Unit), by Country 2024 & 2032
- Figure 45: Europe Stretch Marks Treatment Market Revenue Share (%), by Country 2024 & 2032
- Figure 46: Europe Stretch Marks Treatment Market Volume Share (%), by Country 2024 & 2032
- Figure 47: Asia Pacific Stretch Marks Treatment Market Revenue (Million), by Treatment 2024 & 2032
- Figure 48: Asia Pacific Stretch Marks Treatment Market Volume (K Unit), by Treatment 2024 & 2032
- Figure 49: Asia Pacific Stretch Marks Treatment Market Revenue Share (%), by Treatment 2024 & 2032
- Figure 50: Asia Pacific Stretch Marks Treatment Market Volume Share (%), by Treatment 2024 & 2032
- Figure 51: Asia Pacific Stretch Marks Treatment Market Revenue (Million), by End User 2024 & 2032
- Figure 52: Asia Pacific Stretch Marks Treatment Market Volume (K Unit), by End User 2024 & 2032
- Figure 53: Asia Pacific Stretch Marks Treatment Market Revenue Share (%), by End User 2024 & 2032
- Figure 54: Asia Pacific Stretch Marks Treatment Market Volume Share (%), by End User 2024 & 2032
- Figure 55: Asia Pacific Stretch Marks Treatment Market Revenue (Million), by Country 2024 & 2032
- Figure 56: Asia Pacific Stretch Marks Treatment Market Volume (K Unit), by Country 2024 & 2032
- Figure 57: Asia Pacific Stretch Marks Treatment Market Revenue Share (%), by Country 2024 & 2032
- Figure 58: Asia Pacific Stretch Marks Treatment Market Volume Share (%), by Country 2024 & 2032
- Figure 59: Middle East and Africa Stretch Marks Treatment Market Revenue (Million), by Treatment 2024 & 2032
- Figure 60: Middle East and Africa Stretch Marks Treatment Market Volume (K Unit), by Treatment 2024 & 2032
- Figure 61: Middle East and Africa Stretch Marks Treatment Market Revenue Share (%), by Treatment 2024 & 2032
- Figure 62: Middle East and Africa Stretch Marks Treatment Market Volume Share (%), by Treatment 2024 & 2032
- Figure 63: Middle East and Africa Stretch Marks Treatment Market Revenue (Million), by End User 2024 & 2032
- Figure 64: Middle East and Africa Stretch Marks Treatment Market Volume (K Unit), by End User 2024 & 2032
- Figure 65: Middle East and Africa Stretch Marks Treatment Market Revenue Share (%), by End User 2024 & 2032
- Figure 66: Middle East and Africa Stretch Marks Treatment Market Volume Share (%), by End User 2024 & 2032
- Figure 67: Middle East and Africa Stretch Marks Treatment Market Revenue (Million), by Country 2024 & 2032
- Figure 68: Middle East and Africa Stretch Marks Treatment Market Volume (K Unit), by Country 2024 & 2032
- Figure 69: Middle East and Africa Stretch Marks Treatment Market Revenue Share (%), by Country 2024 & 2032
- Figure 70: Middle East and Africa Stretch Marks Treatment Market Volume Share (%), by Country 2024 & 2032
- Figure 71: South America Stretch Marks Treatment Market Revenue (Million), by Treatment 2024 & 2032
- Figure 72: South America Stretch Marks Treatment Market Volume (K Unit), by Treatment 2024 & 2032
- Figure 73: South America Stretch Marks Treatment Market Revenue Share (%), by Treatment 2024 & 2032
- Figure 74: South America Stretch Marks Treatment Market Volume Share (%), by Treatment 2024 & 2032
- Figure 75: South America Stretch Marks Treatment Market Revenue (Million), by End User 2024 & 2032
- Figure 76: South America Stretch Marks Treatment Market Volume (K Unit), by End User 2024 & 2032
- Figure 77: South America Stretch Marks Treatment Market Revenue Share (%), by End User 2024 & 2032
- Figure 78: South America Stretch Marks Treatment Market Volume Share (%), by End User 2024 & 2032
- Figure 79: South America Stretch Marks Treatment Market Revenue (Million), by Country 2024 & 2032
- Figure 80: South America Stretch Marks Treatment Market Volume (K Unit), by Country 2024 & 2032
- Figure 81: South America Stretch Marks Treatment Market Revenue Share (%), by Country 2024 & 2032
- Figure 82: South America Stretch Marks Treatment Market Volume Share (%), by Country 2024 & 2032
List of Tables
- Table 1: Global Stretch Marks Treatment Market Revenue Million Forecast, by Region 2019 & 2032
- Table 2: Global Stretch Marks Treatment Market Volume K Unit Forecast, by Region 2019 & 2032
- Table 3: Global Stretch Marks Treatment Market Revenue Million Forecast, by Treatment 2019 & 2032
- Table 4: Global Stretch Marks Treatment Market Volume K Unit Forecast, by Treatment 2019 & 2032
- Table 5: Global Stretch Marks Treatment Market Revenue Million Forecast, by End User 2019 & 2032
- Table 6: Global Stretch Marks Treatment Market Volume K Unit Forecast, by End User 2019 & 2032
- Table 7: Global Stretch Marks Treatment Market Revenue Million Forecast, by Region 2019 & 2032
- Table 8: Global Stretch Marks Treatment Market Volume K Unit Forecast, by Region 2019 & 2032
- Table 9: Global Stretch Marks Treatment Market Revenue Million Forecast, by Country 2019 & 2032
- Table 10: Global Stretch Marks Treatment Market Volume K Unit Forecast, by Country 2019 & 2032
- Table 11: United States Stretch Marks Treatment Market Revenue (Million) Forecast, by Application 2019 & 2032
- Table 12: United States Stretch Marks Treatment Market Volume (K Unit) Forecast, by Application 2019 & 2032
- Table 13: Canada Stretch Marks Treatment Market Revenue (Million) Forecast, by Application 2019 & 2032
- Table 14: Canada Stretch Marks Treatment Market Volume (K Unit) Forecast, by Application 2019 & 2032
- Table 15: Mexico Stretch Marks Treatment Market Revenue (Million) Forecast, by Application 2019 & 2032
- Table 16: Mexico Stretch Marks Treatment Market Volume (K Unit) Forecast, by Application 2019 & 2032
- Table 17: Global Stretch Marks Treatment Market Revenue Million Forecast, by Country 2019 & 2032
- Table 18: Global Stretch Marks Treatment Market Volume K Unit Forecast, by Country 2019 & 2032
- Table 19: Germany Stretch Marks Treatment Market Revenue (Million) Forecast, by Application 2019 & 2032
- Table 20: Germany Stretch Marks Treatment Market Volume (K Unit) Forecast, by Application 2019 & 2032
- Table 21: United Kingdom Stretch Marks Treatment Market Revenue (Million) Forecast, by Application 2019 & 2032
- Table 22: United Kingdom Stretch Marks Treatment Market Volume (K Unit) Forecast, by Application 2019 & 2032
- Table 23: France Stretch Marks Treatment Market Revenue (Million) Forecast, by Application 2019 & 2032
- Table 24: France Stretch Marks Treatment Market Volume (K Unit) Forecast, by Application 2019 & 2032
- Table 25: Italy Stretch Marks Treatment Market Revenue (Million) Forecast, by Application 2019 & 2032
- Table 26: Italy Stretch Marks Treatment Market Volume (K Unit) Forecast, by Application 2019 & 2032
- Table 27: Spain Stretch Marks Treatment Market Revenue (Million) Forecast, by Application 2019 & 2032
- Table 28: Spain Stretch Marks Treatment Market Volume (K Unit) Forecast, by Application 2019 & 2032
- Table 29: Rest of Europe Stretch Marks Treatment Market Revenue (Million) Forecast, by Application 2019 & 2032
- Table 30: Rest of Europe Stretch Marks Treatment Market Volume (K Unit) Forecast, by Application 2019 & 2032
- Table 31: Global Stretch Marks Treatment Market Revenue Million Forecast, by Country 2019 & 2032
- Table 32: Global Stretch Marks Treatment Market Volume K Unit Forecast, by Country 2019 & 2032
- Table 33: China Stretch Marks Treatment Market Revenue (Million) Forecast, by Application 2019 & 2032
- Table 34: China Stretch Marks Treatment Market Volume (K Unit) Forecast, by Application 2019 & 2032
- Table 35: Japan Stretch Marks Treatment Market Revenue (Million) Forecast, by Application 2019 & 2032
- Table 36: Japan Stretch Marks Treatment Market Volume (K Unit) Forecast, by Application 2019 & 2032
- Table 37: India Stretch Marks Treatment Market Revenue (Million) Forecast, by Application 2019 & 2032
- Table 38: India Stretch Marks Treatment Market Volume (K Unit) Forecast, by Application 2019 & 2032
- Table 39: Australia Stretch Marks Treatment Market Revenue (Million) Forecast, by Application 2019 & 2032
- Table 40: Australia Stretch Marks Treatment Market Volume (K Unit) Forecast, by Application 2019 & 2032
- Table 41: South Korea Stretch Marks Treatment Market Revenue (Million) Forecast, by Application 2019 & 2032
- Table 42: South Korea Stretch Marks Treatment Market Volume (K Unit) Forecast, by Application 2019 & 2032
- Table 43: Rest of Asia Pacific Stretch Marks Treatment Market Revenue (Million) Forecast, by Application 2019 & 2032
- Table 44: Rest of Asia Pacific Stretch Marks Treatment Market Volume (K Unit) Forecast, by Application 2019 & 2032
- Table 45: Global Stretch Marks Treatment Market Revenue Million Forecast, by Country 2019 & 2032
- Table 46: Global Stretch Marks Treatment Market Volume K Unit Forecast, by Country 2019 & 2032
- Table 47: GCC Stretch Marks Treatment Market Revenue (Million) Forecast, by Application 2019 & 2032
- Table 48: GCC Stretch Marks Treatment Market Volume (K Unit) Forecast, by Application 2019 & 2032
- Table 49: South Africa Stretch Marks Treatment Market Revenue (Million) Forecast, by Application 2019 & 2032
- Table 50: South Africa Stretch Marks Treatment Market Volume (K Unit) Forecast, by Application 2019 & 2032
- Table 51: Rest of Middle East and Africa Stretch Marks Treatment Market Revenue (Million) Forecast, by Application 2019 & 2032
- Table 52: Rest of Middle East and Africa Stretch Marks Treatment Market Volume (K Unit) Forecast, by Application 2019 & 2032
- Table 53: Global Stretch Marks Treatment Market Revenue Million Forecast, by Country 2019 & 2032
- Table 54: Global Stretch Marks Treatment Market Volume K Unit Forecast, by Country 2019 & 2032
- Table 55: Brazil Stretch Marks Treatment Market Revenue (Million) Forecast, by Application 2019 & 2032
- Table 56: Brazil Stretch Marks Treatment Market Volume (K Unit) Forecast, by Application 2019 & 2032
- Table 57: Argentina Stretch Marks Treatment Market Revenue (Million) Forecast, by Application 2019 & 2032
- Table 58: Argentina Stretch Marks Treatment Market Volume (K Unit) Forecast, by Application 2019 & 2032
- Table 59: Rest of South America Stretch Marks Treatment Market Revenue (Million) Forecast, by Application 2019 & 2032
- Table 60: Rest of South America Stretch Marks Treatment Market Volume (K Unit) Forecast, by Application 2019 & 2032
- Table 61: Global Stretch Marks Treatment Market Revenue Million Forecast, by Treatment 2019 & 2032
- Table 62: Global Stretch Marks Treatment Market Volume K Unit Forecast, by Treatment 2019 & 2032
- Table 63: Global Stretch Marks Treatment Market Revenue Million Forecast, by End User 2019 & 2032
- Table 64: Global Stretch Marks Treatment Market Volume K Unit Forecast, by End User 2019 & 2032
- Table 65: Global Stretch Marks Treatment Market Revenue Million Forecast, by Country 2019 & 2032
- Table 66: Global Stretch Marks Treatment Market Volume K Unit Forecast, by Country 2019 & 2032
- Table 67: United States Stretch Marks Treatment Market Revenue (Million) Forecast, by Application 2019 & 2032
- Table 68: United States Stretch Marks Treatment Market Volume (K Unit) Forecast, by Application 2019 & 2032
- Table 69: Canada Stretch Marks Treatment Market Revenue (Million) Forecast, by Application 2019 & 2032
- Table 70: Canada Stretch Marks Treatment Market Volume (K Unit) Forecast, by Application 2019 & 2032
- Table 71: Mexico Stretch Marks Treatment Market Revenue (Million) Forecast, by Application 2019 & 2032
- Table 72: Mexico Stretch Marks Treatment Market Volume (K Unit) Forecast, by Application 2019 & 2032
- Table 73: Global Stretch Marks Treatment Market Revenue Million Forecast, by Treatment 2019 & 2032
- Table 74: Global Stretch Marks Treatment Market Volume K Unit Forecast, by Treatment 2019 & 2032
- Table 75: Global Stretch Marks Treatment Market Revenue Million Forecast, by End User 2019 & 2032
- Table 76: Global Stretch Marks Treatment Market Volume K Unit Forecast, by End User 2019 & 2032
- Table 77: Global Stretch Marks Treatment Market Revenue Million Forecast, by Country 2019 & 2032
- Table 78: Global Stretch Marks Treatment Market Volume K Unit Forecast, by Country 2019 & 2032
- Table 79: Germany Stretch Marks Treatment Market Revenue (Million) Forecast, by Application 2019 & 2032
- Table 80: Germany Stretch Marks Treatment Market Volume (K Unit) Forecast, by Application 2019 & 2032
- Table 81: United Kingdom Stretch Marks Treatment Market Revenue (Million) Forecast, by Application 2019 & 2032
- Table 82: United Kingdom Stretch Marks Treatment Market Volume (K Unit) Forecast, by Application 2019 & 2032
- Table 83: France Stretch Marks Treatment Market Revenue (Million) Forecast, by Application 2019 & 2032
- Table 84: France Stretch Marks Treatment Market Volume (K Unit) Forecast, by Application 2019 & 2032
- Table 85: Italy Stretch Marks Treatment Market Revenue (Million) Forecast, by Application 2019 & 2032
- Table 86: Italy Stretch Marks Treatment Market Volume (K Unit) Forecast, by Application 2019 & 2032
- Table 87: Spain Stretch Marks Treatment Market Revenue (Million) Forecast, by Application 2019 & 2032
- Table 88: Spain Stretch Marks Treatment Market Volume (K Unit) Forecast, by Application 2019 & 2032
- Table 89: Rest of Europe Stretch Marks Treatment Market Revenue (Million) Forecast, by Application 2019 & 2032
- Table 90: Rest of Europe Stretch Marks Treatment Market Volume (K Unit) Forecast, by Application 2019 & 2032
- Table 91: Global Stretch Marks Treatment Market Revenue Million Forecast, by Treatment 2019 & 2032
- Table 92: Global Stretch Marks Treatment Market Volume K Unit Forecast, by Treatment 2019 & 2032
- Table 93: Global Stretch Marks Treatment Market Revenue Million Forecast, by End User 2019 & 2032
- Table 94: Global Stretch Marks Treatment Market Volume K Unit Forecast, by End User 2019 & 2032
- Table 95: Global Stretch Marks Treatment Market Revenue Million Forecast, by Country 2019 & 2032
- Table 96: Global Stretch Marks Treatment Market Volume K Unit Forecast, by Country 2019 & 2032
- Table 97: China Stretch Marks Treatment Market Revenue (Million) Forecast, by Application 2019 & 2032
- Table 98: China Stretch Marks Treatment Market Volume (K Unit) Forecast, by Application 2019 & 2032
- Table 99: Japan Stretch Marks Treatment Market Revenue (Million) Forecast, by Application 2019 & 2032
- Table 100: Japan Stretch Marks Treatment Market Volume (K Unit) Forecast, by Application 2019 & 2032
- Table 101: India Stretch Marks Treatment Market Revenue (Million) Forecast, by Application 2019 & 2032
- Table 102: India Stretch Marks Treatment Market Volume (K Unit) Forecast, by Application 2019 & 2032
- Table 103: Australia Stretch Marks Treatment Market Revenue (Million) Forecast, by Application 2019 & 2032
- Table 104: Australia Stretch Marks Treatment Market Volume (K Unit) Forecast, by Application 2019 & 2032
- Table 105: South Korea Stretch Marks Treatment Market Revenue (Million) Forecast, by Application 2019 & 2032
- Table 106: South Korea Stretch Marks Treatment Market Volume (K Unit) Forecast, by Application 2019 & 2032
- Table 107: Rest of Asia Pacific Stretch Marks Treatment Market Revenue (Million) Forecast, by Application 2019 & 2032
- Table 108: Rest of Asia Pacific Stretch Marks Treatment Market Volume (K Unit) Forecast, by Application 2019 & 2032
- Table 109: Global Stretch Marks Treatment Market Revenue Million Forecast, by Treatment 2019 & 2032
- Table 110: Global Stretch Marks Treatment Market Volume K Unit Forecast, by Treatment 2019 & 2032
- Table 111: Global Stretch Marks Treatment Market Revenue Million Forecast, by End User 2019 & 2032
- Table 112: Global Stretch Marks Treatment Market Volume K Unit Forecast, by End User 2019 & 2032
- Table 113: Global Stretch Marks Treatment Market Revenue Million Forecast, by Country 2019 & 2032
- Table 114: Global Stretch Marks Treatment Market Volume K Unit Forecast, by Country 2019 & 2032
- Table 115: GCC Stretch Marks Treatment Market Revenue (Million) Forecast, by Application 2019 & 2032
- Table 116: GCC Stretch Marks Treatment Market Volume (K Unit) Forecast, by Application 2019 & 2032
- Table 117: South Africa Stretch Marks Treatment Market Revenue (Million) Forecast, by Application 2019 & 2032
- Table 118: South Africa Stretch Marks Treatment Market Volume (K Unit) Forecast, by Application 2019 & 2032
- Table 119: Rest of Middle East and Africa Stretch Marks Treatment Market Revenue (Million) Forecast, by Application 2019 & 2032
- Table 120: Rest of Middle East and Africa Stretch Marks Treatment Market Volume (K Unit) Forecast, by Application 2019 & 2032
- Table 121: Global Stretch Marks Treatment Market Revenue Million Forecast, by Treatment 2019 & 2032
- Table 122: Global Stretch Marks Treatment Market Volume K Unit Forecast, by Treatment 2019 & 2032
- Table 123: Global Stretch Marks Treatment Market Revenue Million Forecast, by End User 2019 & 2032
- Table 124: Global Stretch Marks Treatment Market Volume K Unit Forecast, by End User 2019 & 2032
- Table 125: Global Stretch Marks Treatment Market Revenue Million Forecast, by Country 2019 & 2032
- Table 126: Global Stretch Marks Treatment Market Volume K Unit Forecast, by Country 2019 & 2032
- Table 127: Brazil Stretch Marks Treatment Market Revenue (Million) Forecast, by Application 2019 & 2032
- Table 128: Brazil Stretch Marks Treatment Market Volume (K Unit) Forecast, by Application 2019 & 2032
- Table 129: Argentina Stretch Marks Treatment Market Revenue (Million) Forecast, by Application 2019 & 2032
- Table 130: Argentina Stretch Marks Treatment Market Volume (K Unit) Forecast, by Application 2019 & 2032
- Table 131: Rest of South America Stretch Marks Treatment Market Revenue (Million) Forecast, by Application 2019 & 2032
- Table 132: Rest of South America Stretch Marks Treatment Market Volume (K Unit) Forecast, by Application 2019 & 2032
Frequently Asked Questions
1. What is the projected Compound Annual Growth Rate (CAGR) of the Stretch Marks Treatment Market?
The projected CAGR is approximately 4.45%.
2. Which companies are prominent players in the Stretch Marks Treatment Market?
Key companies in the market include Clarins Group, SKIN SCIENCE SOLUTIONS, Candela Corporation, HRA Pharma, Basq Skincare, Weleda AG, Union Swiss (Pty) Ltd, Dermaclara Inc, Helix BioMedix Inc, Laboratoires Expanscience, Alliance Pharma PLC, E T Browne Drug Co Inc (Palmers).
3. What are the main segments of the Stretch Marks Treatment Market?
The market segments include Treatment, End User.
4. Can you provide details about the market size?
The market size is estimated to be USD 2.90 Million as of 2022.
5. What are some drivers contributing to market growth?
Growing Burden of Obesity Worldwide; Increasing Number of Pregnancies and Concerns About Stretch Marks.
6. What are the notable trends driving market growth?
Oils and Serum in the Topical Treatment Segment are Expected to Hold a Major Share of the Market.
7. Are there any restraints impacting market growth?
High Cost of Laser and Microdermabrasion Treatment.
8. Can you provide examples of recent developments in the market?
In May 2022, Givaudan Active Beauty launched Centella CAST, an ingredient that acts on the mechanisms responsible for the formation of stretch marks. It acts on four different levels to restore skin elasticity, density, and firmness, thus reducing the appearance of stretch marks.
9. What pricing options are available for accessing the report?
Pricing options include single-user, multi-user, and enterprise licenses priced at USD 4750, USD 5250, and USD 8750 respectively.
10. Is the market size provided in terms of value or volume?
The market size is provided in terms of value, measured in Million and volume, measured in K Unit.
11. Are there any specific market keywords associated with the report?
Yes, the market keyword associated with the report is "Stretch Marks Treatment Market," which aids in identifying and referencing the specific market segment covered.
12. How do I determine which pricing option suits my needs best?
The pricing options vary based on user requirements and access needs. Individual users may opt for single-user licenses, while businesses requiring broader access may choose multi-user or enterprise licenses for cost-effective access to the report.
13. Are there any additional resources or data provided in the Stretch Marks Treatment Market report?
While the report offers comprehensive insights, it's advisable to review the specific contents or supplementary materials provided to ascertain if additional resources or data are available.
14. How can I stay updated on further developments or reports in the Stretch Marks Treatment Market?
To stay informed about further developments, trends, and reports in the Stretch Marks Treatment Market, consider subscribing to industry newsletters, following relevant companies and organizations, or regularly checking reputable industry news sources and publications.
Methodology
Step 1 - Identification of Relevant Samples Size from Population Database


Step 2 - Approaches for Defining Global Market Size (Value, Volume* & Price*)

Note*: In applicable scenarios
Step 3 - Data Sources
Primary Research
- Web Analytics
- Survey Reports
- Research Institute
- Latest Research Reports
- Opinion Leaders
Secondary Research
- Annual Reports
- White Paper
- Latest Press Release
- Industry Association
- Paid Database
- Investor Presentations

Step 4 - Data Triangulation
Involves using different sources of information in order to increase the validity of a study
These sources are likely to be stakeholders in a program - participants, other researchers, program staff, other community members, and so on.
Then we put all data in single framework & apply various statistical tools to find out the dynamic on the market.
During the analysis stage, feedback from the stakeholder groups would be compared to determine areas of agreement as well as areas of divergence


