
Key Insights
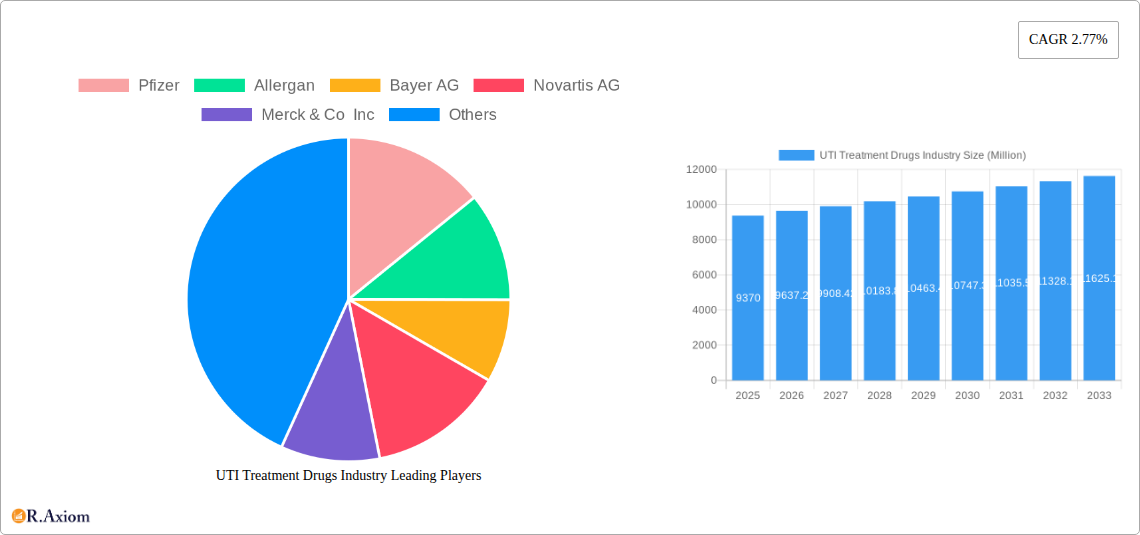
The global UTI Treatment Drugs market, valued at $9.37 billion in 2025, is projected to experience steady growth, with a Compound Annual Growth Rate (CAGR) of 2.77% from 2025 to 2033. This growth is driven by several factors. Rising prevalence of urinary tract infections (UTIs), particularly among women, fuels demand for effective treatment options. Aging populations in developed nations contribute significantly to increased UTI cases due to weakened immune systems and other age-related conditions. Furthermore, increasing awareness regarding UTI symptoms and the availability of improved diagnostic tools lead to earlier diagnosis and treatment, positively impacting market expansion. However, the market faces certain restraints. The emergence of antibiotic resistance poses a significant challenge, limiting the efficacy of existing treatments and necessitating the development of novel therapeutic approaches. Moreover, stringent regulatory approvals for new drugs and high research and development costs can hinder market growth. The market is segmented by indication (complicated vs. uncomplicated UTIs and other specific conditions), and by drug class (penicillins, quinolones, cephalosporins, azoles, nitrofurans, and others). The competitive landscape includes major pharmaceutical players like Pfizer, Allergan, Bayer, Novartis, and Merck, as well as several generic manufacturers, driving both innovation and price competition. Regional variations in healthcare infrastructure and access to medication contribute to differences in market share; North America and Europe currently dominate the market due to higher healthcare expenditure and advanced healthcare infrastructure.
The future of the UTI Treatment Drugs market hinges on several key trends. The development of novel antibiotics and alternative therapeutic strategies to combat antibiotic resistance is paramount. Personalized medicine approaches, tailoring treatment based on individual patient characteristics and bacterial resistance profiles, are gaining traction. Furthermore, the increasing adoption of point-of-care diagnostics for rapid UTI detection enables prompt and targeted treatment, improving patient outcomes. The market will likely witness continuous innovation in drug delivery systems and formulations, aiming to enhance efficacy and reduce side effects. Growth will also be influenced by ongoing research into novel drug targets and the development of prophylactic measures to prevent recurrent UTIs. Strategic partnerships and collaborations between pharmaceutical companies and research institutions are anticipated to accelerate the development and commercialization of innovative UTI treatment options.
This comprehensive report provides an in-depth analysis of the UTI Treatment Drugs industry, offering valuable insights into market dynamics, competitive landscape, and future growth prospects. The study covers the period 2019-2033, with a focus on the forecast period 2025-2033, using 2025 as the base and estimated year. The report is crucial for industry stakeholders, investors, and researchers seeking a clear understanding of this vital healthcare market.
UTI Treatment Drugs Industry Market Concentration & Innovation
The UTI treatment drugs market exhibits a moderately concentrated landscape, with several key players holding significant market share. Pfizer, Allergan, Bayer AG, Novartis AG, and Merck & Co Inc. are prominent leaders, collectively accounting for an estimated xx% of the global market in 2025. However, the presence of numerous regional and generic drug manufacturers fosters competition and drives innovation. The industry is characterized by continuous R&D efforts focused on developing novel antibiotics with improved efficacy and reduced side effects, driven by the rising prevalence of antibiotic resistance.
Market innovation is fueled by factors such as:
- Regulatory landscape: Stringent regulatory approvals necessitate continuous innovation to meet evolving safety and efficacy standards.
- Product substitutes: The emergence of alternative treatment modalities, including bacteriophages and immunotherapy, poses a potential challenge but also drives innovation in existing drug formulations.
- End-user trends: Growing awareness of UTI symptoms and improved access to healthcare are increasing demand for effective and convenient treatment options.
- M&A activities: Consolidation through mergers and acquisitions (M&A) has shaped the industry, with notable deals totaling an estimated xx Million in the past five years. These transactions have resulted in increased market share for larger players and accelerated product development. For example, a hypothetical acquisition of a smaller biotech company specializing in novel UTI treatments could bolster the market leader's portfolio.
UTI Treatment Drugs Industry Industry Trends & Insights
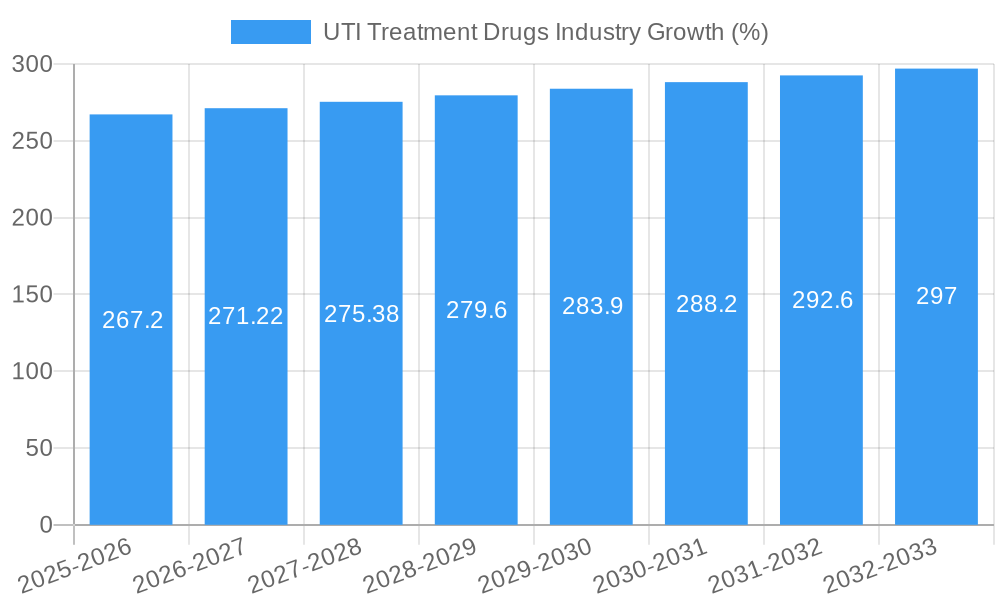
The global UTI treatment drugs market is projected to experience a Compound Annual Growth Rate (CAGR) of xx% during the forecast period (2025-2033), driven by several key factors. The rising prevalence of UTIs, particularly among women, is a major contributor to market growth. Furthermore, increased healthcare spending and improved diagnostic capabilities are bolstering the demand for effective treatments.
Technological advancements, such as rapid diagnostic tests and personalized medicine approaches, are influencing market trends. Consumer preferences are shifting towards convenient oral formulations and treatments with minimal side effects. The competitive dynamics are characterized by intense rivalry among established pharmaceutical companies and the emergence of biosimilar drugs. Market penetration of new drugs is estimated to reach xx% by 2033, primarily driven by enhanced efficacy and reduced adverse effects compared to older-generation antibiotics.
Dominant Markets & Segments in UTI Treatment Drugs Industry
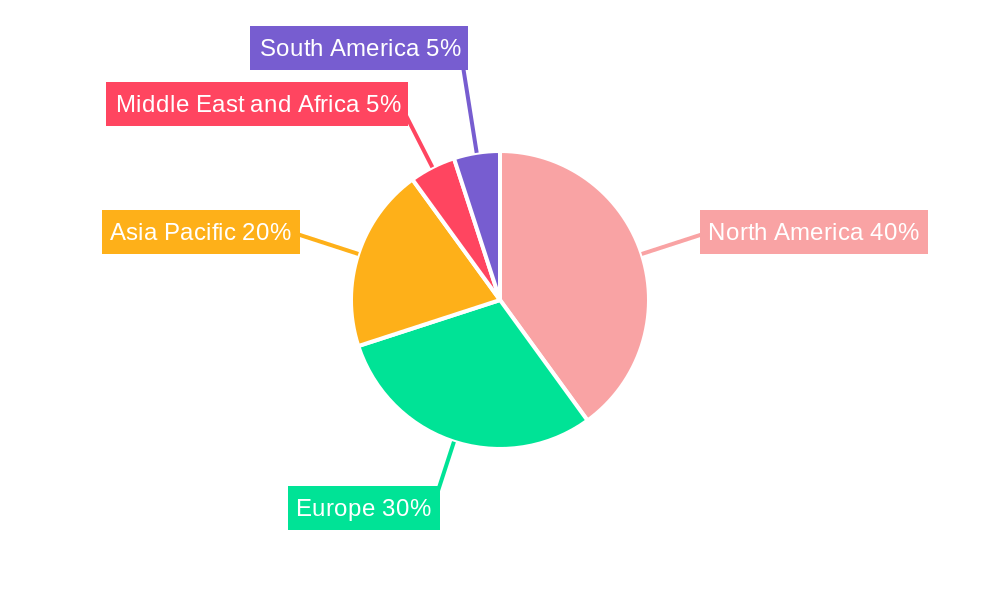
The North American market dominates the global UTI treatment drugs landscape, driven by high healthcare expenditure, advanced healthcare infrastructure, and a high prevalence of UTIs. However, rapidly developing economies in Asia-Pacific are demonstrating significant growth potential.
Dominant Segments:
- Indication: Uncomplicated UTIs represent the largest segment, accounting for an estimated xx Million in revenue in 2025, due to their higher prevalence compared to complicated UTIs. However, the complicated UTI segment is projected to witness higher CAGR due to increasing incidence of drug-resistant infections. Other indications, including recurrent UTIs and those associated with neurogenic bladder, represent a smaller but growing market.
- Drug Class: Quinolones and cephalosporins are currently the dominant drug classes, holding an estimated xx% market share. However, the increasing incidence of antibiotic resistance is driving demand for alternative treatment options like Nitrofurans and newer generation antibiotics. The "Other Drugs" segment, encompassing aminoglycoside antibodies, sulfonamides, and tetracyclines, is experiencing moderate growth, driven by their cost-effectiveness in specific patient populations. Azoles and Amphotericin B hold a smaller niche due to their limited use in uncomplicated UTIs. Penicillin and its combinations maintain a significant presence but face challenges from rising antibiotic resistance.
Key drivers for regional dominance include:
- Economic factors: High per capita income and robust healthcare infrastructure in North America support high market penetration.
- Regulatory environment: Stringent regulatory frameworks ensure drug safety and efficacy, influencing market entry and product development.
UTI Treatment Drugs Industry Product Developments
Recent product innovations focus on improving antibiotic efficacy, reducing side effects, and addressing antibiotic resistance. The market is witnessing the development of novel drug delivery systems, improved formulations with enhanced bioavailability, and combination therapies to target specific bacterial strains. These developments aim to enhance treatment outcomes and improve patient compliance. The focus is on developing drugs with a wider spectrum of activity and lower toxicity profiles to cater to the increasing needs of the market.
Report Scope & Segmentation Analysis
This report segments the UTI treatment drugs market by indication (uncomplicated UTI, complicated UTI, other indications), and drug class (penicillin and combinations, quinolones, cephalosporins, azoles and amphotericin B, nitrofurans, other drugs). Each segment is analyzed in detail, including growth projections, market size, and competitive dynamics. For instance, the uncomplicated UTI segment is expected to grow at a xx% CAGR, while the complicated UTI segment is projected to grow at a xx% CAGR, driven by the increasing prevalence of antibiotic-resistant infections. The quinolone segment holds a dominant share but is facing pressure from emerging resistance patterns.
Key Drivers of UTI Treatment Drugs Industry Growth
Several factors drive the growth of the UTI treatment drugs market:
- Rising Prevalence of UTIs: The increasing incidence of UTIs, especially among women, fuels demand for effective treatments.
- Technological Advancements: New diagnostic tools and improved drug formulations enhance treatment efficacy and convenience.
- Increased Healthcare Spending: Rising healthcare expenditure globally fuels investment in research and development, and market accessibility.
- Growing Awareness: Increased public awareness of UTIs and their consequences is leading to improved diagnosis and treatment-seeking behavior.
Challenges in the UTI Treatment Drugs Industry Sector
The UTI treatment drugs industry faces several challenges:
- Antibiotic Resistance: The growing prevalence of antibiotic-resistant bacteria necessitates the development of novel therapies, which presents a significant hurdle in terms of R&D and cost.
- Stringent Regulatory Approvals: The process of obtaining regulatory approvals for new drugs is lengthy and expensive, potentially hindering market entry.
- Generic Competition: The entry of generic drugs into the market exerts downward pressure on prices and profit margins.
- Supply Chain Disruptions: Global supply chain disruptions can impact the availability of raw materials and finished products, creating market instability.
Emerging Opportunities in UTI Treatment Drugs Industry
The industry presents promising opportunities:
- Development of Novel Antibiotics: The urgent need for new antibiotics to combat drug-resistant bacteria presents significant opportunities for pharmaceutical companies.
- Personalized Medicine: Tailoring treatment to individual patients based on their genetic makeup and specific bacterial strains presents a growing area of opportunity.
- Expansion into Emerging Markets: Untapped potential exists in emerging economies with rising healthcare spending and a growing prevalence of UTIs.
- Prophylactic Strategies: Development of preventive measures, such as novel vaccines or improved hygiene practices, represent a considerable opportunity.
Leading Players in the UTI Treatment Drugs Industry Market
- Pfizer
- Allergan
- Bayer AG
- Novartis AG
- Merck & Co Inc
- Cipla Inc
- Shionogi & Co Ltd
- AstraZeneca
- Almirall SA
- Dr Reddy's Laboratories Ltd
- Bristol-Myers Squibb Company
- GlaxoSmithKline PLC
Key Developments in UTI Treatment Drugs Industry Industry
- 2022/10: Company X launched a new broad-spectrum antibiotic for complicated UTIs. This development significantly impacted market dynamics by offering a more effective treatment option.
- 2023/03: A major merger between two pharmaceutical companies resulted in a combined entity with a stronger market presence in the UTI treatment drug sector, impacting competition and market share distribution.
- 2024/06: Regulatory approval was granted for a new drug with improved efficacy and reduced side effects, resulting in increased demand for this treatment and subsequent market shift.
- (Add further examples as needed, ensuring year and month are specified and the impact is clearly explained).
Strategic Outlook for UTI Treatment Drugs Market
The future of the UTI treatment drugs market is promising, driven by continued technological advancements, increased awareness, and the unmet need for novel antibiotics to combat drug resistance. The focus on personalized medicine, novel drug delivery systems, and the exploration of alternative treatment approaches will shape the industry landscape in the coming years. Continued growth is expected, particularly in emerging markets, driven by improving healthcare infrastructure and increasing access to diagnosis and treatment. The industry will continue to be characterized by innovation, competition, and regulatory scrutiny.
UTI Treatment Drugs Industry Segmentation
-
1. Drug
- 1.1. Penicillin and Combinations
- 1.2. Quinolones
- 1.3. Cephalosporin
- 1.4. Azoles and Amphotericin B
- 1.5. Nitrofurans
- 1.6. Other Dr
-
2. Indication
- 2.1. Complicated UTI
- 2.2. Uncomplicated UTI
- 2.3. Other In
UTI Treatment Drugs Industry Segmentation By Geography
-
1. North America
- 1.1. US
- 1.2. Canada
- 1.3. Mexico
-
2. Europe
- 2.1. Germany
- 2.2. UK
- 2.3. France
- 2.4. Italy
- 2.5. Spain
- 2.6. Rest of Europe
-
3. Asia Pacific
- 3.1. China
- 3.2. Japan
- 3.3. India
- 3.4. Australia
- 3.5. South Korea
- 3.6. Rest of Asia Pacific
-
4. Middle East and Africa
- 4.1. GCC
- 4.2. South Africa
- 4.3. Rest of Middle East and Africa
-
5. South America
- 5.1. Brazil
- 5.2. Argentina
- 5.3. Rest of South America
UTI Treatment Drugs Industry REPORT HIGHLIGHTS
| Aspects | Details |
|---|---|
| Study Period | 2019-2033 |
| Base Year | 2024 |
| Estimated Year | 2025 |
| Forecast Period | 2025-2033 |
| Historical Period | 2019-2024 |
| Growth Rate | CAGR of 2.77% from 2019-2033 |
| Segmentation |
|
Table of Contents
- 1. Introduction
- 1.1. Research Scope
- 1.2. Market Segmentation
- 1.3. Research Methodology
- 1.4. Definitions and Assumptions
- 2. Executive Summary
- 2.1. Introduction
- 3. Market Dynamics
- 3.1. Introduction
- 3.2. Market Drivers
- 3.2.1. Increasing Prevalence of Diabetes and Kidney Stones; Launch of Combination Drugs
- 3.3. Market Restrains
- 3.3.1. Adverse Effects Associated with the Use of Medication; Lack of Awareness in Developing and Underdeveloped Countries
- 3.4. Market Trends
- 3.4.1. Complicated UTIs Segment Expected to Hold a Major Share in the Urinary Tract Infection Therapeutics Market
- 4. Market Factor Analysis
- 4.1. Porters Five Forces
- 4.2. Supply/Value Chain
- 4.3. PESTEL analysis
- 4.4. Market Entropy
- 4.5. Patent/Trademark Analysis
- 5. Global UTI Treatment Drugs Industry Analysis, Insights and Forecast, 2019-2031
- 5.1. Market Analysis, Insights and Forecast - by Drug
- 5.1.1. Penicillin and Combinations
- 5.1.2. Quinolones
- 5.1.3. Cephalosporin
- 5.1.4. Azoles and Amphotericin B
- 5.1.5. Nitrofurans
- 5.1.6. Other Dr
- 5.2. Market Analysis, Insights and Forecast - by Indication
- 5.2.1. Complicated UTI
- 5.2.2. Uncomplicated UTI
- 5.2.3. Other In
- 5.3. Market Analysis, Insights and Forecast - by Region
- 5.3.1. North America
- 5.3.2. Europe
- 5.3.3. Asia Pacific
- 5.3.4. Middle East and Africa
- 5.3.5. South America
- 5.1. Market Analysis, Insights and Forecast - by Drug
- 6. North America UTI Treatment Drugs Industry Analysis, Insights and Forecast, 2019-2031
- 6.1. Market Analysis, Insights and Forecast - by Drug
- 6.1.1. Penicillin and Combinations
- 6.1.2. Quinolones
- 6.1.3. Cephalosporin
- 6.1.4. Azoles and Amphotericin B
- 6.1.5. Nitrofurans
- 6.1.6. Other Dr
- 6.2. Market Analysis, Insights and Forecast - by Indication
- 6.2.1. Complicated UTI
- 6.2.2. Uncomplicated UTI
- 6.2.3. Other In
- 6.1. Market Analysis, Insights and Forecast - by Drug
- 7. Europe UTI Treatment Drugs Industry Analysis, Insights and Forecast, 2019-2031
- 7.1. Market Analysis, Insights and Forecast - by Drug
- 7.1.1. Penicillin and Combinations
- 7.1.2. Quinolones
- 7.1.3. Cephalosporin
- 7.1.4. Azoles and Amphotericin B
- 7.1.5. Nitrofurans
- 7.1.6. Other Dr
- 7.2. Market Analysis, Insights and Forecast - by Indication
- 7.2.1. Complicated UTI
- 7.2.2. Uncomplicated UTI
- 7.2.3. Other In
- 7.1. Market Analysis, Insights and Forecast - by Drug
- 8. Asia Pacific UTI Treatment Drugs Industry Analysis, Insights and Forecast, 2019-2031
- 8.1. Market Analysis, Insights and Forecast - by Drug
- 8.1.1. Penicillin and Combinations
- 8.1.2. Quinolones
- 8.1.3. Cephalosporin
- 8.1.4. Azoles and Amphotericin B
- 8.1.5. Nitrofurans
- 8.1.6. Other Dr
- 8.2. Market Analysis, Insights and Forecast - by Indication
- 8.2.1. Complicated UTI
- 8.2.2. Uncomplicated UTI
- 8.2.3. Other In
- 8.1. Market Analysis, Insights and Forecast - by Drug
- 9. Middle East and Africa UTI Treatment Drugs Industry Analysis, Insights and Forecast, 2019-2031
- 9.1. Market Analysis, Insights and Forecast - by Drug
- 9.1.1. Penicillin and Combinations
- 9.1.2. Quinolones
- 9.1.3. Cephalosporin
- 9.1.4. Azoles and Amphotericin B
- 9.1.5. Nitrofurans
- 9.1.6. Other Dr
- 9.2. Market Analysis, Insights and Forecast - by Indication
- 9.2.1. Complicated UTI
- 9.2.2. Uncomplicated UTI
- 9.2.3. Other In
- 9.1. Market Analysis, Insights and Forecast - by Drug
- 10. South America UTI Treatment Drugs Industry Analysis, Insights and Forecast, 2019-2031
- 10.1. Market Analysis, Insights and Forecast - by Drug
- 10.1.1. Penicillin and Combinations
- 10.1.2. Quinolones
- 10.1.3. Cephalosporin
- 10.1.4. Azoles and Amphotericin B
- 10.1.5. Nitrofurans
- 10.1.6. Other Dr
- 10.2. Market Analysis, Insights and Forecast - by Indication
- 10.2.1. Complicated UTI
- 10.2.2. Uncomplicated UTI
- 10.2.3. Other In
- 10.1. Market Analysis, Insights and Forecast - by Drug
- 11. North America UTI Treatment Drugs Industry Analysis, Insights and Forecast, 2019-2031
- 11.1. Market Analysis, Insights and Forecast - By Country/Sub-region
- 11.1.1. undefined
- 12. Europe UTI Treatment Drugs Industry Analysis, Insights and Forecast, 2019-2031
- 12.1. Market Analysis, Insights and Forecast - By Country/Sub-region
- 12.1.1. undefined
- 13. Asia Pacifi UTI Treatment Drugs Industry Analysis, Insights and Forecast, 2019-2031
- 13.1. Market Analysis, Insights and Forecast - By Country/Sub-region
- 13.1.1. undefined
- 14. Middle East and Africa UTI Treatment Drugs Industry Analysis, Insights and Forecast, 2019-2031
- 14.1. Market Analysis, Insights and Forecast - By Country/Sub-region
- 14.1.1. undefined
- 15. South America UTI Treatment Drugs Industry Analysis, Insights and Forecast, 2019-2031
- 15.1. Market Analysis, Insights and Forecast - By Country/Sub-region
- 15.1.1. undefined
- 16. Competitive Analysis
- 16.1. Global Market Share Analysis 2024
- 16.2. Company Profiles
- 16.2.1 Pfizer
- 16.2.1.1. Overview
- 16.2.1.2. Products
- 16.2.1.3. SWOT Analysis
- 16.2.1.4. Recent Developments
- 16.2.1.5. Financials (Based on Availability)
- 16.2.2 Allergan
- 16.2.2.1. Overview
- 16.2.2.2. Products
- 16.2.2.3. SWOT Analysis
- 16.2.2.4. Recent Developments
- 16.2.2.5. Financials (Based on Availability)
- 16.2.3 Bayer AG
- 16.2.3.1. Overview
- 16.2.3.2. Products
- 16.2.3.3. SWOT Analysis
- 16.2.3.4. Recent Developments
- 16.2.3.5. Financials (Based on Availability)
- 16.2.4 Novartis AG
- 16.2.4.1. Overview
- 16.2.4.2. Products
- 16.2.4.3. SWOT Analysis
- 16.2.4.4. Recent Developments
- 16.2.4.5. Financials (Based on Availability)
- 16.2.5 Merck & Co Inc
- 16.2.5.1. Overview
- 16.2.5.2. Products
- 16.2.5.3. SWOT Analysis
- 16.2.5.4. Recent Developments
- 16.2.5.5. Financials (Based on Availability)
- 16.2.6 Cipla Inc
- 16.2.6.1. Overview
- 16.2.6.2. Products
- 16.2.6.3. SWOT Analysis
- 16.2.6.4. Recent Developments
- 16.2.6.5. Financials (Based on Availability)
- 16.2.7 Shionogi & Co Ltd
- 16.2.7.1. Overview
- 16.2.7.2. Products
- 16.2.7.3. SWOT Analysis
- 16.2.7.4. Recent Developments
- 16.2.7.5. Financials (Based on Availability)
- 16.2.8 AstraZeneca
- 16.2.8.1. Overview
- 16.2.8.2. Products
- 16.2.8.3. SWOT Analysis
- 16.2.8.4. Recent Developments
- 16.2.8.5. Financials (Based on Availability)
- 16.2.9 Almirall SA
- 16.2.9.1. Overview
- 16.2.9.2. Products
- 16.2.9.3. SWOT Analysis
- 16.2.9.4. Recent Developments
- 16.2.9.5. Financials (Based on Availability)
- 16.2.10 Dr Reddys Laboratories Ltd
- 16.2.10.1. Overview
- 16.2.10.2. Products
- 16.2.10.3. SWOT Analysis
- 16.2.10.4. Recent Developments
- 16.2.10.5. Financials (Based on Availability)
- 16.2.11 Bristol-Myers Squibb Company
- 16.2.11.1. Overview
- 16.2.11.2. Products
- 16.2.11.3. SWOT Analysis
- 16.2.11.4. Recent Developments
- 16.2.11.5. Financials (Based on Availability)
- 16.2.12 GlaxoSmithKline PLC
- 16.2.12.1. Overview
- 16.2.12.2. Products
- 16.2.12.3. SWOT Analysis
- 16.2.12.4. Recent Developments
- 16.2.12.5. Financials (Based on Availability)
- 16.2.1 Pfizer
List of Figures
- Figure 1: Global UTI Treatment Drugs Industry Revenue Breakdown (Million, %) by Region 2024 & 2032
- Figure 2: Global UTI Treatment Drugs Industry Volume Breakdown (K Unit, %) by Region 2024 & 2032
- Figure 3: North America UTI Treatment Drugs Industry Revenue (Million), by Country 2024 & 2032
- Figure 4: North America UTI Treatment Drugs Industry Volume (K Unit), by Country 2024 & 2032
- Figure 5: North America UTI Treatment Drugs Industry Revenue Share (%), by Country 2024 & 2032
- Figure 6: North America UTI Treatment Drugs Industry Volume Share (%), by Country 2024 & 2032
- Figure 7: Europe UTI Treatment Drugs Industry Revenue (Million), by Country 2024 & 2032
- Figure 8: Europe UTI Treatment Drugs Industry Volume (K Unit), by Country 2024 & 2032
- Figure 9: Europe UTI Treatment Drugs Industry Revenue Share (%), by Country 2024 & 2032
- Figure 10: Europe UTI Treatment Drugs Industry Volume Share (%), by Country 2024 & 2032
- Figure 11: Asia Pacifi UTI Treatment Drugs Industry Revenue (Million), by Country 2024 & 2032
- Figure 12: Asia Pacifi UTI Treatment Drugs Industry Volume (K Unit), by Country 2024 & 2032
- Figure 13: Asia Pacifi UTI Treatment Drugs Industry Revenue Share (%), by Country 2024 & 2032
- Figure 14: Asia Pacifi UTI Treatment Drugs Industry Volume Share (%), by Country 2024 & 2032
- Figure 15: Middle East and Africa UTI Treatment Drugs Industry Revenue (Million), by Country 2024 & 2032
- Figure 16: Middle East and Africa UTI Treatment Drugs Industry Volume (K Unit), by Country 2024 & 2032
- Figure 17: Middle East and Africa UTI Treatment Drugs Industry Revenue Share (%), by Country 2024 & 2032
- Figure 18: Middle East and Africa UTI Treatment Drugs Industry Volume Share (%), by Country 2024 & 2032
- Figure 19: South America UTI Treatment Drugs Industry Revenue (Million), by Country 2024 & 2032
- Figure 20: South America UTI Treatment Drugs Industry Volume (K Unit), by Country 2024 & 2032
- Figure 21: South America UTI Treatment Drugs Industry Revenue Share (%), by Country 2024 & 2032
- Figure 22: South America UTI Treatment Drugs Industry Volume Share (%), by Country 2024 & 2032
- Figure 23: North America UTI Treatment Drugs Industry Revenue (Million), by Drug 2024 & 2032
- Figure 24: North America UTI Treatment Drugs Industry Volume (K Unit), by Drug 2024 & 2032
- Figure 25: North America UTI Treatment Drugs Industry Revenue Share (%), by Drug 2024 & 2032
- Figure 26: North America UTI Treatment Drugs Industry Volume Share (%), by Drug 2024 & 2032
- Figure 27: North America UTI Treatment Drugs Industry Revenue (Million), by Indication 2024 & 2032
- Figure 28: North America UTI Treatment Drugs Industry Volume (K Unit), by Indication 2024 & 2032
- Figure 29: North America UTI Treatment Drugs Industry Revenue Share (%), by Indication 2024 & 2032
- Figure 30: North America UTI Treatment Drugs Industry Volume Share (%), by Indication 2024 & 2032
- Figure 31: North America UTI Treatment Drugs Industry Revenue (Million), by Country 2024 & 2032
- Figure 32: North America UTI Treatment Drugs Industry Volume (K Unit), by Country 2024 & 2032
- Figure 33: North America UTI Treatment Drugs Industry Revenue Share (%), by Country 2024 & 2032
- Figure 34: North America UTI Treatment Drugs Industry Volume Share (%), by Country 2024 & 2032
- Figure 35: Europe UTI Treatment Drugs Industry Revenue (Million), by Drug 2024 & 2032
- Figure 36: Europe UTI Treatment Drugs Industry Volume (K Unit), by Drug 2024 & 2032
- Figure 37: Europe UTI Treatment Drugs Industry Revenue Share (%), by Drug 2024 & 2032
- Figure 38: Europe UTI Treatment Drugs Industry Volume Share (%), by Drug 2024 & 2032
- Figure 39: Europe UTI Treatment Drugs Industry Revenue (Million), by Indication 2024 & 2032
- Figure 40: Europe UTI Treatment Drugs Industry Volume (K Unit), by Indication 2024 & 2032
- Figure 41: Europe UTI Treatment Drugs Industry Revenue Share (%), by Indication 2024 & 2032
- Figure 42: Europe UTI Treatment Drugs Industry Volume Share (%), by Indication 2024 & 2032
- Figure 43: Europe UTI Treatment Drugs Industry Revenue (Million), by Country 2024 & 2032
- Figure 44: Europe UTI Treatment Drugs Industry Volume (K Unit), by Country 2024 & 2032
- Figure 45: Europe UTI Treatment Drugs Industry Revenue Share (%), by Country 2024 & 2032
- Figure 46: Europe UTI Treatment Drugs Industry Volume Share (%), by Country 2024 & 2032
- Figure 47: Asia Pacific UTI Treatment Drugs Industry Revenue (Million), by Drug 2024 & 2032
- Figure 48: Asia Pacific UTI Treatment Drugs Industry Volume (K Unit), by Drug 2024 & 2032
- Figure 49: Asia Pacific UTI Treatment Drugs Industry Revenue Share (%), by Drug 2024 & 2032
- Figure 50: Asia Pacific UTI Treatment Drugs Industry Volume Share (%), by Drug 2024 & 2032
- Figure 51: Asia Pacific UTI Treatment Drugs Industry Revenue (Million), by Indication 2024 & 2032
- Figure 52: Asia Pacific UTI Treatment Drugs Industry Volume (K Unit), by Indication 2024 & 2032
- Figure 53: Asia Pacific UTI Treatment Drugs Industry Revenue Share (%), by Indication 2024 & 2032
- Figure 54: Asia Pacific UTI Treatment Drugs Industry Volume Share (%), by Indication 2024 & 2032
- Figure 55: Asia Pacific UTI Treatment Drugs Industry Revenue (Million), by Country 2024 & 2032
- Figure 56: Asia Pacific UTI Treatment Drugs Industry Volume (K Unit), by Country 2024 & 2032
- Figure 57: Asia Pacific UTI Treatment Drugs Industry Revenue Share (%), by Country 2024 & 2032
- Figure 58: Asia Pacific UTI Treatment Drugs Industry Volume Share (%), by Country 2024 & 2032
- Figure 59: Middle East and Africa UTI Treatment Drugs Industry Revenue (Million), by Drug 2024 & 2032
- Figure 60: Middle East and Africa UTI Treatment Drugs Industry Volume (K Unit), by Drug 2024 & 2032
- Figure 61: Middle East and Africa UTI Treatment Drugs Industry Revenue Share (%), by Drug 2024 & 2032
- Figure 62: Middle East and Africa UTI Treatment Drugs Industry Volume Share (%), by Drug 2024 & 2032
- Figure 63: Middle East and Africa UTI Treatment Drugs Industry Revenue (Million), by Indication 2024 & 2032
- Figure 64: Middle East and Africa UTI Treatment Drugs Industry Volume (K Unit), by Indication 2024 & 2032
- Figure 65: Middle East and Africa UTI Treatment Drugs Industry Revenue Share (%), by Indication 2024 & 2032
- Figure 66: Middle East and Africa UTI Treatment Drugs Industry Volume Share (%), by Indication 2024 & 2032
- Figure 67: Middle East and Africa UTI Treatment Drugs Industry Revenue (Million), by Country 2024 & 2032
- Figure 68: Middle East and Africa UTI Treatment Drugs Industry Volume (K Unit), by Country 2024 & 2032
- Figure 69: Middle East and Africa UTI Treatment Drugs Industry Revenue Share (%), by Country 2024 & 2032
- Figure 70: Middle East and Africa UTI Treatment Drugs Industry Volume Share (%), by Country 2024 & 2032
- Figure 71: South America UTI Treatment Drugs Industry Revenue (Million), by Drug 2024 & 2032
- Figure 72: South America UTI Treatment Drugs Industry Volume (K Unit), by Drug 2024 & 2032
- Figure 73: South America UTI Treatment Drugs Industry Revenue Share (%), by Drug 2024 & 2032
- Figure 74: South America UTI Treatment Drugs Industry Volume Share (%), by Drug 2024 & 2032
- Figure 75: South America UTI Treatment Drugs Industry Revenue (Million), by Indication 2024 & 2032
- Figure 76: South America UTI Treatment Drugs Industry Volume (K Unit), by Indication 2024 & 2032
- Figure 77: South America UTI Treatment Drugs Industry Revenue Share (%), by Indication 2024 & 2032
- Figure 78: South America UTI Treatment Drugs Industry Volume Share (%), by Indication 2024 & 2032
- Figure 79: South America UTI Treatment Drugs Industry Revenue (Million), by Country 2024 & 2032
- Figure 80: South America UTI Treatment Drugs Industry Volume (K Unit), by Country 2024 & 2032
- Figure 81: South America UTI Treatment Drugs Industry Revenue Share (%), by Country 2024 & 2032
- Figure 82: South America UTI Treatment Drugs Industry Volume Share (%), by Country 2024 & 2032
List of Tables
- Table 1: Global UTI Treatment Drugs Industry Revenue Million Forecast, by Region 2019 & 2032
- Table 2: Global UTI Treatment Drugs Industry Volume K Unit Forecast, by Region 2019 & 2032
- Table 3: Global UTI Treatment Drugs Industry Revenue Million Forecast, by Drug 2019 & 2032
- Table 4: Global UTI Treatment Drugs Industry Volume K Unit Forecast, by Drug 2019 & 2032
- Table 5: Global UTI Treatment Drugs Industry Revenue Million Forecast, by Indication 2019 & 2032
- Table 6: Global UTI Treatment Drugs Industry Volume K Unit Forecast, by Indication 2019 & 2032
- Table 7: Global UTI Treatment Drugs Industry Revenue Million Forecast, by Region 2019 & 2032
- Table 8: Global UTI Treatment Drugs Industry Volume K Unit Forecast, by Region 2019 & 2032
- Table 9: Global UTI Treatment Drugs Industry Revenue Million Forecast, by Country 2019 & 2032
- Table 10: Global UTI Treatment Drugs Industry Volume K Unit Forecast, by Country 2019 & 2032
- Table 11: Global UTI Treatment Drugs Industry Revenue Million Forecast, by Country 2019 & 2032
- Table 12: Global UTI Treatment Drugs Industry Volume K Unit Forecast, by Country 2019 & 2032
- Table 13: Global UTI Treatment Drugs Industry Revenue Million Forecast, by Country 2019 & 2032
- Table 14: Global UTI Treatment Drugs Industry Volume K Unit Forecast, by Country 2019 & 2032
- Table 15: Global UTI Treatment Drugs Industry Revenue Million Forecast, by Country 2019 & 2032
- Table 16: Global UTI Treatment Drugs Industry Volume K Unit Forecast, by Country 2019 & 2032
- Table 17: Global UTI Treatment Drugs Industry Revenue Million Forecast, by Country 2019 & 2032
- Table 18: Global UTI Treatment Drugs Industry Volume K Unit Forecast, by Country 2019 & 2032
- Table 19: Global UTI Treatment Drugs Industry Revenue Million Forecast, by Drug 2019 & 2032
- Table 20: Global UTI Treatment Drugs Industry Volume K Unit Forecast, by Drug 2019 & 2032
- Table 21: Global UTI Treatment Drugs Industry Revenue Million Forecast, by Indication 2019 & 2032
- Table 22: Global UTI Treatment Drugs Industry Volume K Unit Forecast, by Indication 2019 & 2032
- Table 23: Global UTI Treatment Drugs Industry Revenue Million Forecast, by Country 2019 & 2032
- Table 24: Global UTI Treatment Drugs Industry Volume K Unit Forecast, by Country 2019 & 2032
- Table 25: US UTI Treatment Drugs Industry Revenue (Million) Forecast, by Application 2019 & 2032
- Table 26: US UTI Treatment Drugs Industry Volume (K Unit) Forecast, by Application 2019 & 2032
- Table 27: Canada UTI Treatment Drugs Industry Revenue (Million) Forecast, by Application 2019 & 2032
- Table 28: Canada UTI Treatment Drugs Industry Volume (K Unit) Forecast, by Application 2019 & 2032
- Table 29: Mexico UTI Treatment Drugs Industry Revenue (Million) Forecast, by Application 2019 & 2032
- Table 30: Mexico UTI Treatment Drugs Industry Volume (K Unit) Forecast, by Application 2019 & 2032
- Table 31: Global UTI Treatment Drugs Industry Revenue Million Forecast, by Drug 2019 & 2032
- Table 32: Global UTI Treatment Drugs Industry Volume K Unit Forecast, by Drug 2019 & 2032
- Table 33: Global UTI Treatment Drugs Industry Revenue Million Forecast, by Indication 2019 & 2032
- Table 34: Global UTI Treatment Drugs Industry Volume K Unit Forecast, by Indication 2019 & 2032
- Table 35: Global UTI Treatment Drugs Industry Revenue Million Forecast, by Country 2019 & 2032
- Table 36: Global UTI Treatment Drugs Industry Volume K Unit Forecast, by Country 2019 & 2032
- Table 37: Germany UTI Treatment Drugs Industry Revenue (Million) Forecast, by Application 2019 & 2032
- Table 38: Germany UTI Treatment Drugs Industry Volume (K Unit) Forecast, by Application 2019 & 2032
- Table 39: UK UTI Treatment Drugs Industry Revenue (Million) Forecast, by Application 2019 & 2032
- Table 40: UK UTI Treatment Drugs Industry Volume (K Unit) Forecast, by Application 2019 & 2032
- Table 41: France UTI Treatment Drugs Industry Revenue (Million) Forecast, by Application 2019 & 2032
- Table 42: France UTI Treatment Drugs Industry Volume (K Unit) Forecast, by Application 2019 & 2032
- Table 43: Italy UTI Treatment Drugs Industry Revenue (Million) Forecast, by Application 2019 & 2032
- Table 44: Italy UTI Treatment Drugs Industry Volume (K Unit) Forecast, by Application 2019 & 2032
- Table 45: Spain UTI Treatment Drugs Industry Revenue (Million) Forecast, by Application 2019 & 2032
- Table 46: Spain UTI Treatment Drugs Industry Volume (K Unit) Forecast, by Application 2019 & 2032
- Table 47: Rest of Europe UTI Treatment Drugs Industry Revenue (Million) Forecast, by Application 2019 & 2032
- Table 48: Rest of Europe UTI Treatment Drugs Industry Volume (K Unit) Forecast, by Application 2019 & 2032
- Table 49: Global UTI Treatment Drugs Industry Revenue Million Forecast, by Drug 2019 & 2032
- Table 50: Global UTI Treatment Drugs Industry Volume K Unit Forecast, by Drug 2019 & 2032
- Table 51: Global UTI Treatment Drugs Industry Revenue Million Forecast, by Indication 2019 & 2032
- Table 52: Global UTI Treatment Drugs Industry Volume K Unit Forecast, by Indication 2019 & 2032
- Table 53: Global UTI Treatment Drugs Industry Revenue Million Forecast, by Country 2019 & 2032
- Table 54: Global UTI Treatment Drugs Industry Volume K Unit Forecast, by Country 2019 & 2032
- Table 55: China UTI Treatment Drugs Industry Revenue (Million) Forecast, by Application 2019 & 2032
- Table 56: China UTI Treatment Drugs Industry Volume (K Unit) Forecast, by Application 2019 & 2032
- Table 57: Japan UTI Treatment Drugs Industry Revenue (Million) Forecast, by Application 2019 & 2032
- Table 58: Japan UTI Treatment Drugs Industry Volume (K Unit) Forecast, by Application 2019 & 2032
- Table 59: India UTI Treatment Drugs Industry Revenue (Million) Forecast, by Application 2019 & 2032
- Table 60: India UTI Treatment Drugs Industry Volume (K Unit) Forecast, by Application 2019 & 2032
- Table 61: Australia UTI Treatment Drugs Industry Revenue (Million) Forecast, by Application 2019 & 2032
- Table 62: Australia UTI Treatment Drugs Industry Volume (K Unit) Forecast, by Application 2019 & 2032
- Table 63: South Korea UTI Treatment Drugs Industry Revenue (Million) Forecast, by Application 2019 & 2032
- Table 64: South Korea UTI Treatment Drugs Industry Volume (K Unit) Forecast, by Application 2019 & 2032
- Table 65: Rest of Asia Pacific UTI Treatment Drugs Industry Revenue (Million) Forecast, by Application 2019 & 2032
- Table 66: Rest of Asia Pacific UTI Treatment Drugs Industry Volume (K Unit) Forecast, by Application 2019 & 2032
- Table 67: Global UTI Treatment Drugs Industry Revenue Million Forecast, by Drug 2019 & 2032
- Table 68: Global UTI Treatment Drugs Industry Volume K Unit Forecast, by Drug 2019 & 2032
- Table 69: Global UTI Treatment Drugs Industry Revenue Million Forecast, by Indication 2019 & 2032
- Table 70: Global UTI Treatment Drugs Industry Volume K Unit Forecast, by Indication 2019 & 2032
- Table 71: Global UTI Treatment Drugs Industry Revenue Million Forecast, by Country 2019 & 2032
- Table 72: Global UTI Treatment Drugs Industry Volume K Unit Forecast, by Country 2019 & 2032
- Table 73: GCC UTI Treatment Drugs Industry Revenue (Million) Forecast, by Application 2019 & 2032
- Table 74: GCC UTI Treatment Drugs Industry Volume (K Unit) Forecast, by Application 2019 & 2032
- Table 75: South Africa UTI Treatment Drugs Industry Revenue (Million) Forecast, by Application 2019 & 2032
- Table 76: South Africa UTI Treatment Drugs Industry Volume (K Unit) Forecast, by Application 2019 & 2032
- Table 77: Rest of Middle East and Africa UTI Treatment Drugs Industry Revenue (Million) Forecast, by Application 2019 & 2032
- Table 78: Rest of Middle East and Africa UTI Treatment Drugs Industry Volume (K Unit) Forecast, by Application 2019 & 2032
- Table 79: Global UTI Treatment Drugs Industry Revenue Million Forecast, by Drug 2019 & 2032
- Table 80: Global UTI Treatment Drugs Industry Volume K Unit Forecast, by Drug 2019 & 2032
- Table 81: Global UTI Treatment Drugs Industry Revenue Million Forecast, by Indication 2019 & 2032
- Table 82: Global UTI Treatment Drugs Industry Volume K Unit Forecast, by Indication 2019 & 2032
- Table 83: Global UTI Treatment Drugs Industry Revenue Million Forecast, by Country 2019 & 2032
- Table 84: Global UTI Treatment Drugs Industry Volume K Unit Forecast, by Country 2019 & 2032
- Table 85: Brazil UTI Treatment Drugs Industry Revenue (Million) Forecast, by Application 2019 & 2032
- Table 86: Brazil UTI Treatment Drugs Industry Volume (K Unit) Forecast, by Application 2019 & 2032
- Table 87: Argentina UTI Treatment Drugs Industry Revenue (Million) Forecast, by Application 2019 & 2032
- Table 88: Argentina UTI Treatment Drugs Industry Volume (K Unit) Forecast, by Application 2019 & 2032
- Table 89: Rest of South America UTI Treatment Drugs Industry Revenue (Million) Forecast, by Application 2019 & 2032
- Table 90: Rest of South America UTI Treatment Drugs Industry Volume (K Unit) Forecast, by Application 2019 & 2032
Frequently Asked Questions
1. What is the projected Compound Annual Growth Rate (CAGR) of the UTI Treatment Drugs Industry?
The projected CAGR is approximately 2.77%.
2. Which companies are prominent players in the UTI Treatment Drugs Industry?
Key companies in the market include Pfizer, Allergan, Bayer AG, Novartis AG, Merck & Co Inc, Cipla Inc, Shionogi & Co Ltd, AstraZeneca, Almirall SA, Dr Reddys Laboratories Ltd, Bristol-Myers Squibb Company, GlaxoSmithKline PLC.
3. What are the main segments of the UTI Treatment Drugs Industry?
The market segments include Drug, Indication.
4. Can you provide details about the market size?
The market size is estimated to be USD 9.37 Million as of 2022.
5. What are some drivers contributing to market growth?
Increasing Prevalence of Diabetes and Kidney Stones; Launch of Combination Drugs.
6. What are the notable trends driving market growth?
Complicated UTIs Segment Expected to Hold a Major Share in the Urinary Tract Infection Therapeutics Market.
7. Are there any restraints impacting market growth?
Adverse Effects Associated with the Use of Medication; Lack of Awareness in Developing and Underdeveloped Countries.
8. Can you provide examples of recent developments in the market?
N/A
9. What pricing options are available for accessing the report?
Pricing options include single-user, multi-user, and enterprise licenses priced at USD 4750, USD 5250, and USD 8750 respectively.
10. Is the market size provided in terms of value or volume?
The market size is provided in terms of value, measured in Million and volume, measured in K Unit.
11. Are there any specific market keywords associated with the report?
Yes, the market keyword associated with the report is "UTI Treatment Drugs Industry," which aids in identifying and referencing the specific market segment covered.
12. How do I determine which pricing option suits my needs best?
The pricing options vary based on user requirements and access needs. Individual users may opt for single-user licenses, while businesses requiring broader access may choose multi-user or enterprise licenses for cost-effective access to the report.
13. Are there any additional resources or data provided in the UTI Treatment Drugs Industry report?
While the report offers comprehensive insights, it's advisable to review the specific contents or supplementary materials provided to ascertain if additional resources or data are available.
14. How can I stay updated on further developments or reports in the UTI Treatment Drugs Industry?
To stay informed about further developments, trends, and reports in the UTI Treatment Drugs Industry, consider subscribing to industry newsletters, following relevant companies and organizations, or regularly checking reputable industry news sources and publications.
Methodology
Step 1 - Identification of Relevant Samples Size from Population Database


Step 2 - Approaches for Defining Global Market Size (Value, Volume* & Price*)

Note*: In applicable scenarios
Step 3 - Data Sources
Primary Research
- Web Analytics
- Survey Reports
- Research Institute
- Latest Research Reports
- Opinion Leaders
Secondary Research
- Annual Reports
- White Paper
- Latest Press Release
- Industry Association
- Paid Database
- Investor Presentations

Step 4 - Data Triangulation
Involves using different sources of information in order to increase the validity of a study
These sources are likely to be stakeholders in a program - participants, other researchers, program staff, other community members, and so on.
Then we put all data in single framework & apply various statistical tools to find out the dynamic on the market.
During the analysis stage, feedback from the stakeholder groups would be compared to determine areas of agreement as well as areas of divergence


