
Key Insights
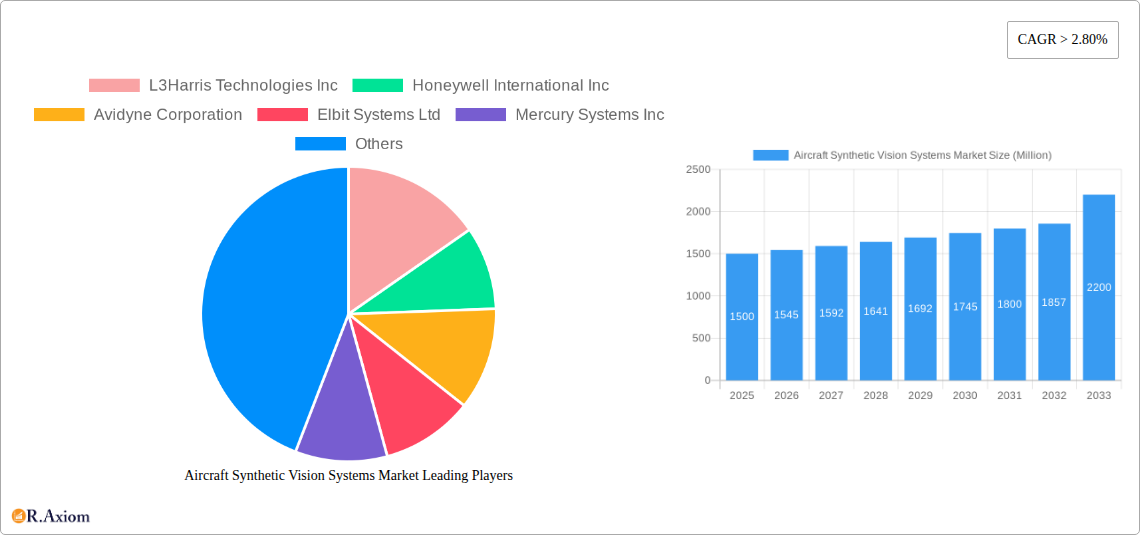
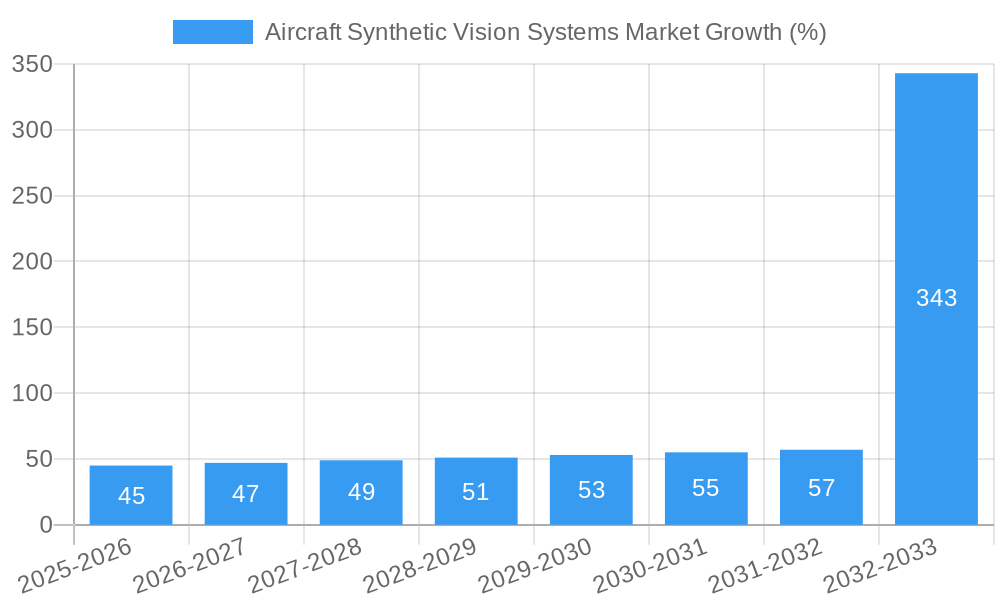
The Aircraft Synthetic Vision Systems (SVS) market is experiencing robust growth, driven by increasing demand for enhanced safety and situational awareness in aviation. The market, valued at approximately $1.5 billion in 2025, is projected to exhibit a compound annual growth rate (CAGR) exceeding 2.80% through 2033, reaching an estimated market size of over $2.2 billion. This growth is fueled by several key factors. Firstly, stringent regulatory mandates emphasizing improved flight safety are compelling airlines and aircraft manufacturers to adopt SVS technology. Secondly, advancements in display technology, leading to higher-resolution, more intuitive interfaces, are boosting market adoption. Furthermore, the integration of SVS with other advanced technologies, such as GPS and weather radar, provides pilots with a comprehensive view of their surroundings, enhancing operational efficiency and safety during challenging weather conditions and low-visibility scenarios. The increasing adoption of SVS in both commercial and military aircraft segments contributes significantly to overall market expansion. Growth is particularly strong in the Asia-Pacific region, driven by burgeoning air travel and infrastructure development. However, high initial investment costs and the need for specialized training for pilots can pose challenges to widespread adoption, particularly in smaller aviation segments.
The market segmentation reveals a diverse landscape. The Primary Flight Display (PFD) segment currently holds the largest market share, followed by the Navigation Display segment. However, the Heads-up and Helmet-mounted Display (HUD/HMD) segment is expected to witness significant growth, propelled by advancements in augmented reality technology and increasing demand for enhanced situational awareness during complex flight maneuvers. Within end-users, the commercial aviation sector dominates, but the military segment shows promising growth potential, driven by the need for advanced navigation and targeting systems in military operations. Key players such as L3Harris Technologies, Honeywell, and Garmin are strategically investing in R&D and collaborations to enhance their product offerings and consolidate their market positions. The competitive landscape is characterized by technological advancements, strategic partnerships, and mergers & acquisitions, shaping the future trajectory of the Aircraft Synthetic Vision Systems market.
Aircraft Synthetic Vision Systems Market: A Comprehensive Report (2019-2033)
This in-depth report provides a comprehensive analysis of the Aircraft Synthetic Vision Systems Market, offering invaluable insights for industry stakeholders, investors, and strategic decision-makers. The study period covers 2019-2033, with 2025 as the base and estimated year, and a forecast period of 2025-2033. The report leverages extensive primary and secondary research to deliver a granular understanding of market dynamics, including market size estimations (in Millions), growth drivers, challenges, and emerging opportunities. Key players such as L3Harris Technologies Inc, Honeywell International Inc, and others are profiled, highlighting their strategic initiatives and market positioning.
Aircraft Synthetic Vision Systems Market Market Concentration & Innovation
The Aircraft Synthetic Vision Systems market exhibits a moderately concentrated landscape, with a few dominant players holding significant market share. However, the market is witnessing increased competition from smaller, specialized companies focusing on niche segments and innovative technologies. Market concentration is influenced by factors including R&D investments, technological advancements, regulatory compliance, and M&A activities. Key metrics like market share (precise figures unavailable for this report description, estimated at xx% for top 3 players) and M&A deal values (estimated at xx Million for the last 5 years) reflect this dynamic interplay.
- Innovation Drivers: Continuous improvements in display technology (e.g., higher resolution, improved clarity), enhanced processing capabilities, and integration with other avionics systems are major innovation drivers.
- Regulatory Frameworks: Stringent safety regulations and certifications (e.g., FAA approvals) significantly impact market growth and product development.
- Product Substitutes: While no direct substitutes exist, traditional navigation methods pose a competitive challenge, particularly in less advanced aviation segments.
- End-User Trends: Growing demand for enhanced situational awareness and improved safety, particularly in challenging weather conditions, fuels market growth across military and commercial segments.
- M&A Activities: Consolidation through mergers and acquisitions allows larger companies to expand their product portfolio, enhance technological capabilities, and broaden their market reach.
Aircraft Synthetic Vision Systems Market Industry Trends & Insights
The Aircraft Synthetic Vision Systems Market is experiencing robust growth, driven by factors such as increasing air travel, rising demand for enhanced safety features, and technological advancements. The market is projected to exhibit a CAGR of xx% during the forecast period (2025-2033). Market penetration remains relatively high in commercial and military aviation, but significant growth potential exists in general aviation. Technological disruptions, such as the integration of artificial intelligence and machine learning, are transforming the market by improving system accuracy and functionality. Consumer preferences increasingly favor systems that offer seamless integration with existing avionics, enhanced user-friendliness, and cost-effective solutions. Competitive dynamics are characterized by intense innovation and strategic partnerships aimed at securing market share and delivering superior value propositions.
Dominant Markets & Segments in Aircraft Synthetic Vision Systems Market
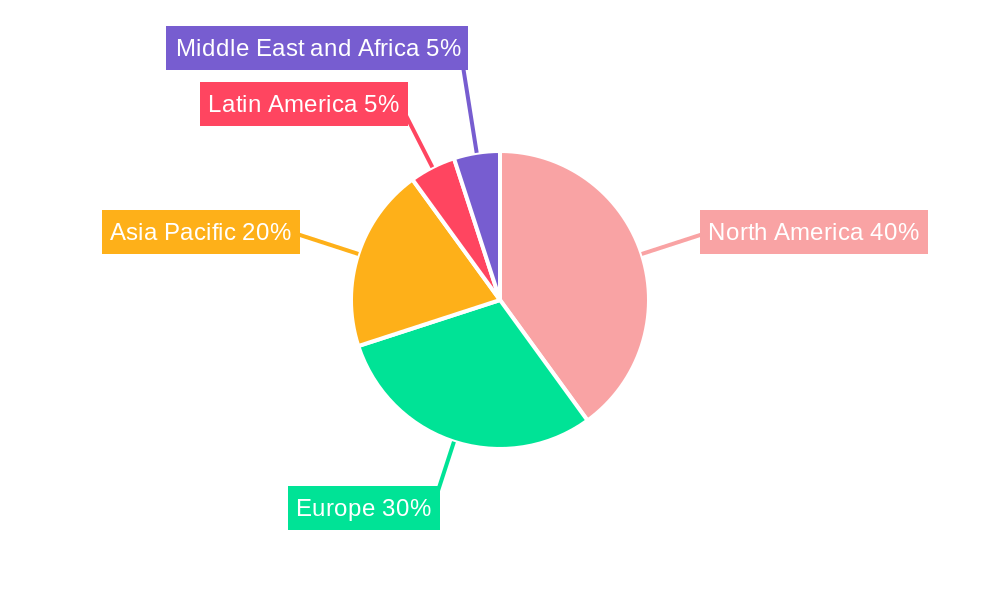
The North American region currently holds a dominant position in the Aircraft Synthetic Vision Systems market, driven by factors such as a large and well-established aviation industry, robust regulatory support, and substantial investments in technological advancements. However, the Asia-Pacific region is projected to witness significant growth during the forecast period, fueled by rising air travel demand and infrastructure development.
By Type:
- Primary Flight Display: This segment holds a substantial market share due to its critical role in providing primary flight information. Key drivers include increased demand for high-resolution displays and enhanced situational awareness capabilities.
- Navigation Display: This segment is experiencing steady growth, driven by the need for precise navigation information and integration with other avionics systems.
- Heads-up and Helmet-mounted Display: This segment exhibits strong growth potential, particularly in military applications, due to its ability to enhance pilot situational awareness and reduce workload.
- Other Types: This segment encompasses a diverse range of specialized systems, including synthetic vision systems for helicopters and unmanned aerial vehicles (UAVs).
By End User:
- Military: This segment represents a substantial market share, driven by the need for enhanced safety and situational awareness in military operations. Stringent requirements and high technological standards influence market dynamics.
- Commercial: This segment is characterized by strong growth, driven by the increasing demand for enhanced safety features and technological advancements. Economic factors and regulatory compliance significantly impact market development.
- General Aviation: This segment presents considerable growth potential, driven by increasing adoption of advanced technologies and improvements in aircraft design. Price considerations and user-friendliness are crucial factors.
Aircraft Synthetic Vision Systems Market Product Developments
Recent product innovations focus on enhancing system accuracy, improving user interfaces, and integrating artificial intelligence (AI) capabilities. These advancements are aimed at providing pilots with a more comprehensive and intuitive understanding of their surroundings, even in challenging weather conditions. The competitive advantage lies in delivering systems that offer superior performance, reliability, and ease of integration with existing avionics infrastructure. Key trends include miniaturization, reduced power consumption, and increased processing power, driving better market fit.
Report Scope & Segmentation Analysis
This report provides a detailed segmentation analysis of the Aircraft Synthetic Vision Systems market, categorized by type (Primary Flight Display, Navigation Display, Heads-up and Helmet-mounted Display, Other Types) and end-user (Military, Commercial, General Aviation). Each segment's growth projections, market size, and competitive dynamics are thoroughly examined. The report analyzes the market across various regions, identifying key growth drivers and competitive landscapes for each segment and geographic area.
Key Drivers of Aircraft Synthetic Vision Systems Market Growth
Several factors contribute to the market's growth:
- Enhanced Safety and Situational Awareness: Synthetic vision systems significantly improve pilot awareness, reducing accidents and improving flight safety.
- Technological Advancements: Continuous improvements in display technology, processing power, and integration capabilities drive innovation.
- Stringent Safety Regulations: Government regulations mandating enhanced safety features fuel market growth.
- Rising Air Travel: The global increase in air travel necessitates improved navigation and safety systems.
Challenges in the Aircraft Synthetic Vision Systems Market Sector
Despite the robust growth potential, challenges exist:
- High Initial Investment Costs: The high cost of implementation can hinder adoption, particularly in smaller aviation segments.
- Complexity of Integration: Integrating synthetic vision systems with existing avionics infrastructure can be complex and time-consuming.
- Maintenance and Support Costs: Ongoing maintenance and support can add to the overall operational expenses.
Emerging Opportunities in Aircraft Synthetic Vision Systems Market
Emerging opportunities include:
- Expansion into General Aviation: The increasing adoption of advanced technologies in general aviation offers substantial growth potential.
- Integration of AI and Machine Learning: AI-powered systems can enhance accuracy, decision-making, and automation capabilities.
- Development of Next-Generation Display Technologies: Advances in display technology, such as augmented reality and holographic projections, can revolutionize the user experience.
Leading Players in the Aircraft Synthetic Vision Systems Market Market
- L3Harris Technologies Inc
- Honeywell International Inc
- Avidyne Corporation
- Elbit Systems Ltd
- Mercury Systems Inc
- Garmin Ltd
- Cobham Limited
- Safran SA
- Thales Group
- ENSCO Inc
- Aspen Avionics Inc
- Collins Aerospace (Raytheon Technologies Corporation)
Key Developments in Aircraft Synthetic Vision Systems Market Industry
- October 2022: Collins Aerospace achieves TSO for its combined vision system (CVS) for business aviation aircraft.
- October 2022: Garmin International Inc. announces STC for the GI 275 electronic flight instrument in the Dassault Falcon 7X business jet.
- October 2021: Honeywell unveils the Anthem flight deck, a cloud-connected cockpit system.
Strategic Outlook for Aircraft Synthetic Vision Systems Market Market
The Aircraft Synthetic Vision Systems market is poised for sustained growth, driven by ongoing technological advancements, increasing demand for enhanced safety, and the expansion into new market segments. The strategic focus will be on developing cost-effective, user-friendly systems with seamless integration capabilities. The integration of AI and machine learning will further enhance system performance and expand market applications. The market holds significant potential for innovation and growth in the coming years.
Aircraft Synthetic Vision Systems Market Segmentation
-
1. Type
- 1.1. Primary Flight Display
- 1.2. Navigation Display
- 1.3. Heads-up and Helmet-mounted Display
- 1.4. Other Types
-
2. End User
- 2.1. Military
- 2.2. Commercial
- 2.3. General Aviation
Aircraft Synthetic Vision Systems Market Segmentation By Geography
-
1. North America
- 1.1. United States
- 1.2. Canada
-
2. Europe
- 2.1. Germany
- 2.2. United Kingdom
- 2.3. France
- 2.4. Russia
- 2.5. Rest of Europe
-
3. Asia Pacific
- 3.1. China
- 3.2. Japan
- 3.3. India
- 3.4. South Korea
- 3.5. Rest of Asia Pacific
-
4. Latin America
- 4.1. Brazil
- 4.2. Mexico
- 4.3. Rest of Latin America
-
5. Middle East and Africa
- 5.1. United Arab Emirates
- 5.2. Saudi Arabia
- 5.3. Egypt
- 5.4. Rest of Middle East and Africa
Aircraft Synthetic Vision Systems Market REPORT HIGHLIGHTS
| Aspects | Details |
|---|---|
| Study Period | 2019-2033 |
| Base Year | 2024 |
| Estimated Year | 2025 |
| Forecast Period | 2025-2033 |
| Historical Period | 2019-2024 |
| Growth Rate | CAGR of > 2.80% from 2019-2033 |
| Segmentation |
|
Table of Contents
- 1. Introduction
- 1.1. Research Scope
- 1.2. Market Segmentation
- 1.3. Research Methodology
- 1.4. Definitions and Assumptions
- 2. Executive Summary
- 2.1. Introduction
- 3. Market Dynamics
- 3.1. Introduction
- 3.2. Market Drivers
- 3.3. Market Restrains
- 3.4. Market Trends
- 3.4.1. Military End-user to Witness Higher Growth During the Forecast Period
- 4. Market Factor Analysis
- 4.1. Porters Five Forces
- 4.2. Supply/Value Chain
- 4.3. PESTEL analysis
- 4.4. Market Entropy
- 4.5. Patent/Trademark Analysis
- 5. Global Aircraft Synthetic Vision Systems Market Analysis, Insights and Forecast, 2019-2031
- 5.1. Market Analysis, Insights and Forecast - by Type
- 5.1.1. Primary Flight Display
- 5.1.2. Navigation Display
- 5.1.3. Heads-up and Helmet-mounted Display
- 5.1.4. Other Types
- 5.2. Market Analysis, Insights and Forecast - by End User
- 5.2.1. Military
- 5.2.2. Commercial
- 5.2.3. General Aviation
- 5.3. Market Analysis, Insights and Forecast - by Region
- 5.3.1. North America
- 5.3.2. Europe
- 5.3.3. Asia Pacific
- 5.3.4. Latin America
- 5.3.5. Middle East and Africa
- 5.1. Market Analysis, Insights and Forecast - by Type
- 6. North America Aircraft Synthetic Vision Systems Market Analysis, Insights and Forecast, 2019-2031
- 6.1. Market Analysis, Insights and Forecast - by Type
- 6.1.1. Primary Flight Display
- 6.1.2. Navigation Display
- 6.1.3. Heads-up and Helmet-mounted Display
- 6.1.4. Other Types
- 6.2. Market Analysis, Insights and Forecast - by End User
- 6.2.1. Military
- 6.2.2. Commercial
- 6.2.3. General Aviation
- 6.1. Market Analysis, Insights and Forecast - by Type
- 7. Europe Aircraft Synthetic Vision Systems Market Analysis, Insights and Forecast, 2019-2031
- 7.1. Market Analysis, Insights and Forecast - by Type
- 7.1.1. Primary Flight Display
- 7.1.2. Navigation Display
- 7.1.3. Heads-up and Helmet-mounted Display
- 7.1.4. Other Types
- 7.2. Market Analysis, Insights and Forecast - by End User
- 7.2.1. Military
- 7.2.2. Commercial
- 7.2.3. General Aviation
- 7.1. Market Analysis, Insights and Forecast - by Type
- 8. Asia Pacific Aircraft Synthetic Vision Systems Market Analysis, Insights and Forecast, 2019-2031
- 8.1. Market Analysis, Insights and Forecast - by Type
- 8.1.1. Primary Flight Display
- 8.1.2. Navigation Display
- 8.1.3. Heads-up and Helmet-mounted Display
- 8.1.4. Other Types
- 8.2. Market Analysis, Insights and Forecast - by End User
- 8.2.1. Military
- 8.2.2. Commercial
- 8.2.3. General Aviation
- 8.1. Market Analysis, Insights and Forecast - by Type
- 9. Latin America Aircraft Synthetic Vision Systems Market Analysis, Insights and Forecast, 2019-2031
- 9.1. Market Analysis, Insights and Forecast - by Type
- 9.1.1. Primary Flight Display
- 9.1.2. Navigation Display
- 9.1.3. Heads-up and Helmet-mounted Display
- 9.1.4. Other Types
- 9.2. Market Analysis, Insights and Forecast - by End User
- 9.2.1. Military
- 9.2.2. Commercial
- 9.2.3. General Aviation
- 9.1. Market Analysis, Insights and Forecast - by Type
- 10. Middle East and Africa Aircraft Synthetic Vision Systems Market Analysis, Insights and Forecast, 2019-2031
- 10.1. Market Analysis, Insights and Forecast - by Type
- 10.1.1. Primary Flight Display
- 10.1.2. Navigation Display
- 10.1.3. Heads-up and Helmet-mounted Display
- 10.1.4. Other Types
- 10.2. Market Analysis, Insights and Forecast - by End User
- 10.2.1. Military
- 10.2.2. Commercial
- 10.2.3. General Aviation
- 10.1. Market Analysis, Insights and Forecast - by Type
- 11. North America Aircraft Synthetic Vision Systems Market Analysis, Insights and Forecast, 2019-2031
- 11.1. Market Analysis, Insights and Forecast - By Country/Sub-region
- 11.1.1 United States
- 11.1.2 Canada
- 12. Europe Aircraft Synthetic Vision Systems Market Analysis, Insights and Forecast, 2019-2031
- 12.1. Market Analysis, Insights and Forecast - By Country/Sub-region
- 12.1.1 Germany
- 12.1.2 United Kingdom
- 12.1.3 France
- 12.1.4 Russia
- 12.1.5 Rest of Europe
- 13. Asia Pacific Aircraft Synthetic Vision Systems Market Analysis, Insights and Forecast, 2019-2031
- 13.1. Market Analysis, Insights and Forecast - By Country/Sub-region
- 13.1.1 China
- 13.1.2 Japan
- 13.1.3 India
- 13.1.4 South Korea
- 13.1.5 Rest of Asia Pacific
- 14. Latin America Aircraft Synthetic Vision Systems Market Analysis, Insights and Forecast, 2019-2031
- 14.1. Market Analysis, Insights and Forecast - By Country/Sub-region
- 14.1.1 Brazil
- 14.1.2 Mexico
- 14.1.3 Rest of Latin America
- 15. Middle East and Africa Aircraft Synthetic Vision Systems Market Analysis, Insights and Forecast, 2019-2031
- 15.1. Market Analysis, Insights and Forecast - By Country/Sub-region
- 15.1.1 United Arab Emirates
- 15.1.2 Saudi Arabia
- 15.1.3 Egypt
- 15.1.4 Rest of Middle East and Africa
- 16. Competitive Analysis
- 16.1. Global Market Share Analysis 2024
- 16.2. Company Profiles
- 16.2.1 L3Harris Technologies Inc
- 16.2.1.1. Overview
- 16.2.1.2. Products
- 16.2.1.3. SWOT Analysis
- 16.2.1.4. Recent Developments
- 16.2.1.5. Financials (Based on Availability)
- 16.2.2 Honeywell International Inc
- 16.2.2.1. Overview
- 16.2.2.2. Products
- 16.2.2.3. SWOT Analysis
- 16.2.2.4. Recent Developments
- 16.2.2.5. Financials (Based on Availability)
- 16.2.3 Avidyne Corporation
- 16.2.3.1. Overview
- 16.2.3.2. Products
- 16.2.3.3. SWOT Analysis
- 16.2.3.4. Recent Developments
- 16.2.3.5. Financials (Based on Availability)
- 16.2.4 Elbit Systems Ltd
- 16.2.4.1. Overview
- 16.2.4.2. Products
- 16.2.4.3. SWOT Analysis
- 16.2.4.4. Recent Developments
- 16.2.4.5. Financials (Based on Availability)
- 16.2.5 Mercury Systems Inc
- 16.2.5.1. Overview
- 16.2.5.2. Products
- 16.2.5.3. SWOT Analysis
- 16.2.5.4. Recent Developments
- 16.2.5.5. Financials (Based on Availability)
- 16.2.6 Garmin Ltd
- 16.2.6.1. Overview
- 16.2.6.2. Products
- 16.2.6.3. SWOT Analysis
- 16.2.6.4. Recent Developments
- 16.2.6.5. Financials (Based on Availability)
- 16.2.7 Cobham Limited
- 16.2.7.1. Overview
- 16.2.7.2. Products
- 16.2.7.3. SWOT Analysis
- 16.2.7.4. Recent Developments
- 16.2.7.5. Financials (Based on Availability)
- 16.2.8 Safran SA
- 16.2.8.1. Overview
- 16.2.8.2. Products
- 16.2.8.3. SWOT Analysis
- 16.2.8.4. Recent Developments
- 16.2.8.5. Financials (Based on Availability)
- 16.2.9 Thales Group
- 16.2.9.1. Overview
- 16.2.9.2. Products
- 16.2.9.3. SWOT Analysis
- 16.2.9.4. Recent Developments
- 16.2.9.5. Financials (Based on Availability)
- 16.2.10 ENSCO Inc
- 16.2.10.1. Overview
- 16.2.10.2. Products
- 16.2.10.3. SWOT Analysis
- 16.2.10.4. Recent Developments
- 16.2.10.5. Financials (Based on Availability)
- 16.2.11 Aspen Avionics Inc
- 16.2.11.1. Overview
- 16.2.11.2. Products
- 16.2.11.3. SWOT Analysis
- 16.2.11.4. Recent Developments
- 16.2.11.5. Financials (Based on Availability)
- 16.2.12 Collins Aerospace (Raytheon Technologies Corporation)
- 16.2.12.1. Overview
- 16.2.12.2. Products
- 16.2.12.3. SWOT Analysis
- 16.2.12.4. Recent Developments
- 16.2.12.5. Financials (Based on Availability)
- 16.2.1 L3Harris Technologies Inc
List of Figures
- Figure 1: Global Aircraft Synthetic Vision Systems Market Revenue Breakdown (Million, %) by Region 2024 & 2032
- Figure 2: North America Aircraft Synthetic Vision Systems Market Revenue (Million), by Country 2024 & 2032
- Figure 3: North America Aircraft Synthetic Vision Systems Market Revenue Share (%), by Country 2024 & 2032
- Figure 4: Europe Aircraft Synthetic Vision Systems Market Revenue (Million), by Country 2024 & 2032
- Figure 5: Europe Aircraft Synthetic Vision Systems Market Revenue Share (%), by Country 2024 & 2032
- Figure 6: Asia Pacific Aircraft Synthetic Vision Systems Market Revenue (Million), by Country 2024 & 2032
- Figure 7: Asia Pacific Aircraft Synthetic Vision Systems Market Revenue Share (%), by Country 2024 & 2032
- Figure 8: Latin America Aircraft Synthetic Vision Systems Market Revenue (Million), by Country 2024 & 2032
- Figure 9: Latin America Aircraft Synthetic Vision Systems Market Revenue Share (%), by Country 2024 & 2032
- Figure 10: Middle East and Africa Aircraft Synthetic Vision Systems Market Revenue (Million), by Country 2024 & 2032
- Figure 11: Middle East and Africa Aircraft Synthetic Vision Systems Market Revenue Share (%), by Country 2024 & 2032
- Figure 12: North America Aircraft Synthetic Vision Systems Market Revenue (Million), by Type 2024 & 2032
- Figure 13: North America Aircraft Synthetic Vision Systems Market Revenue Share (%), by Type 2024 & 2032
- Figure 14: North America Aircraft Synthetic Vision Systems Market Revenue (Million), by End User 2024 & 2032
- Figure 15: North America Aircraft Synthetic Vision Systems Market Revenue Share (%), by End User 2024 & 2032
- Figure 16: North America Aircraft Synthetic Vision Systems Market Revenue (Million), by Country 2024 & 2032
- Figure 17: North America Aircraft Synthetic Vision Systems Market Revenue Share (%), by Country 2024 & 2032
- Figure 18: Europe Aircraft Synthetic Vision Systems Market Revenue (Million), by Type 2024 & 2032
- Figure 19: Europe Aircraft Synthetic Vision Systems Market Revenue Share (%), by Type 2024 & 2032
- Figure 20: Europe Aircraft Synthetic Vision Systems Market Revenue (Million), by End User 2024 & 2032
- Figure 21: Europe Aircraft Synthetic Vision Systems Market Revenue Share (%), by End User 2024 & 2032
- Figure 22: Europe Aircraft Synthetic Vision Systems Market Revenue (Million), by Country 2024 & 2032
- Figure 23: Europe Aircraft Synthetic Vision Systems Market Revenue Share (%), by Country 2024 & 2032
- Figure 24: Asia Pacific Aircraft Synthetic Vision Systems Market Revenue (Million), by Type 2024 & 2032
- Figure 25: Asia Pacific Aircraft Synthetic Vision Systems Market Revenue Share (%), by Type 2024 & 2032
- Figure 26: Asia Pacific Aircraft Synthetic Vision Systems Market Revenue (Million), by End User 2024 & 2032
- Figure 27: Asia Pacific Aircraft Synthetic Vision Systems Market Revenue Share (%), by End User 2024 & 2032
- Figure 28: Asia Pacific Aircraft Synthetic Vision Systems Market Revenue (Million), by Country 2024 & 2032
- Figure 29: Asia Pacific Aircraft Synthetic Vision Systems Market Revenue Share (%), by Country 2024 & 2032
- Figure 30: Latin America Aircraft Synthetic Vision Systems Market Revenue (Million), by Type 2024 & 2032
- Figure 31: Latin America Aircraft Synthetic Vision Systems Market Revenue Share (%), by Type 2024 & 2032
- Figure 32: Latin America Aircraft Synthetic Vision Systems Market Revenue (Million), by End User 2024 & 2032
- Figure 33: Latin America Aircraft Synthetic Vision Systems Market Revenue Share (%), by End User 2024 & 2032
- Figure 34: Latin America Aircraft Synthetic Vision Systems Market Revenue (Million), by Country 2024 & 2032
- Figure 35: Latin America Aircraft Synthetic Vision Systems Market Revenue Share (%), by Country 2024 & 2032
- Figure 36: Middle East and Africa Aircraft Synthetic Vision Systems Market Revenue (Million), by Type 2024 & 2032
- Figure 37: Middle East and Africa Aircraft Synthetic Vision Systems Market Revenue Share (%), by Type 2024 & 2032
- Figure 38: Middle East and Africa Aircraft Synthetic Vision Systems Market Revenue (Million), by End User 2024 & 2032
- Figure 39: Middle East and Africa Aircraft Synthetic Vision Systems Market Revenue Share (%), by End User 2024 & 2032
- Figure 40: Middle East and Africa Aircraft Synthetic Vision Systems Market Revenue (Million), by Country 2024 & 2032
- Figure 41: Middle East and Africa Aircraft Synthetic Vision Systems Market Revenue Share (%), by Country 2024 & 2032
List of Tables
- Table 1: Global Aircraft Synthetic Vision Systems Market Revenue Million Forecast, by Region 2019 & 2032
- Table 2: Global Aircraft Synthetic Vision Systems Market Revenue Million Forecast, by Type 2019 & 2032
- Table 3: Global Aircraft Synthetic Vision Systems Market Revenue Million Forecast, by End User 2019 & 2032
- Table 4: Global Aircraft Synthetic Vision Systems Market Revenue Million Forecast, by Region 2019 & 2032
- Table 5: Global Aircraft Synthetic Vision Systems Market Revenue Million Forecast, by Country 2019 & 2032
- Table 6: United States Aircraft Synthetic Vision Systems Market Revenue (Million) Forecast, by Application 2019 & 2032
- Table 7: Canada Aircraft Synthetic Vision Systems Market Revenue (Million) Forecast, by Application 2019 & 2032
- Table 8: Global Aircraft Synthetic Vision Systems Market Revenue Million Forecast, by Country 2019 & 2032
- Table 9: Germany Aircraft Synthetic Vision Systems Market Revenue (Million) Forecast, by Application 2019 & 2032
- Table 10: United Kingdom Aircraft Synthetic Vision Systems Market Revenue (Million) Forecast, by Application 2019 & 2032
- Table 11: France Aircraft Synthetic Vision Systems Market Revenue (Million) Forecast, by Application 2019 & 2032
- Table 12: Russia Aircraft Synthetic Vision Systems Market Revenue (Million) Forecast, by Application 2019 & 2032
- Table 13: Rest of Europe Aircraft Synthetic Vision Systems Market Revenue (Million) Forecast, by Application 2019 & 2032
- Table 14: Global Aircraft Synthetic Vision Systems Market Revenue Million Forecast, by Country 2019 & 2032
- Table 15: China Aircraft Synthetic Vision Systems Market Revenue (Million) Forecast, by Application 2019 & 2032
- Table 16: Japan Aircraft Synthetic Vision Systems Market Revenue (Million) Forecast, by Application 2019 & 2032
- Table 17: India Aircraft Synthetic Vision Systems Market Revenue (Million) Forecast, by Application 2019 & 2032
- Table 18: South Korea Aircraft Synthetic Vision Systems Market Revenue (Million) Forecast, by Application 2019 & 2032
- Table 19: Rest of Asia Pacific Aircraft Synthetic Vision Systems Market Revenue (Million) Forecast, by Application 2019 & 2032
- Table 20: Global Aircraft Synthetic Vision Systems Market Revenue Million Forecast, by Country 2019 & 2032
- Table 21: Brazil Aircraft Synthetic Vision Systems Market Revenue (Million) Forecast, by Application 2019 & 2032
- Table 22: Mexico Aircraft Synthetic Vision Systems Market Revenue (Million) Forecast, by Application 2019 & 2032
- Table 23: Rest of Latin America Aircraft Synthetic Vision Systems Market Revenue (Million) Forecast, by Application 2019 & 2032
- Table 24: Global Aircraft Synthetic Vision Systems Market Revenue Million Forecast, by Country 2019 & 2032
- Table 25: United Arab Emirates Aircraft Synthetic Vision Systems Market Revenue (Million) Forecast, by Application 2019 & 2032
- Table 26: Saudi Arabia Aircraft Synthetic Vision Systems Market Revenue (Million) Forecast, by Application 2019 & 2032
- Table 27: Egypt Aircraft Synthetic Vision Systems Market Revenue (Million) Forecast, by Application 2019 & 2032
- Table 28: Rest of Middle East and Africa Aircraft Synthetic Vision Systems Market Revenue (Million) Forecast, by Application 2019 & 2032
- Table 29: Global Aircraft Synthetic Vision Systems Market Revenue Million Forecast, by Type 2019 & 2032
- Table 30: Global Aircraft Synthetic Vision Systems Market Revenue Million Forecast, by End User 2019 & 2032
- Table 31: Global Aircraft Synthetic Vision Systems Market Revenue Million Forecast, by Country 2019 & 2032
- Table 32: United States Aircraft Synthetic Vision Systems Market Revenue (Million) Forecast, by Application 2019 & 2032
- Table 33: Canada Aircraft Synthetic Vision Systems Market Revenue (Million) Forecast, by Application 2019 & 2032
- Table 34: Global Aircraft Synthetic Vision Systems Market Revenue Million Forecast, by Type 2019 & 2032
- Table 35: Global Aircraft Synthetic Vision Systems Market Revenue Million Forecast, by End User 2019 & 2032
- Table 36: Global Aircraft Synthetic Vision Systems Market Revenue Million Forecast, by Country 2019 & 2032
- Table 37: Germany Aircraft Synthetic Vision Systems Market Revenue (Million) Forecast, by Application 2019 & 2032
- Table 38: United Kingdom Aircraft Synthetic Vision Systems Market Revenue (Million) Forecast, by Application 2019 & 2032
- Table 39: France Aircraft Synthetic Vision Systems Market Revenue (Million) Forecast, by Application 2019 & 2032
- Table 40: Russia Aircraft Synthetic Vision Systems Market Revenue (Million) Forecast, by Application 2019 & 2032
- Table 41: Rest of Europe Aircraft Synthetic Vision Systems Market Revenue (Million) Forecast, by Application 2019 & 2032
- Table 42: Global Aircraft Synthetic Vision Systems Market Revenue Million Forecast, by Type 2019 & 2032
- Table 43: Global Aircraft Synthetic Vision Systems Market Revenue Million Forecast, by End User 2019 & 2032
- Table 44: Global Aircraft Synthetic Vision Systems Market Revenue Million Forecast, by Country 2019 & 2032
- Table 45: China Aircraft Synthetic Vision Systems Market Revenue (Million) Forecast, by Application 2019 & 2032
- Table 46: Japan Aircraft Synthetic Vision Systems Market Revenue (Million) Forecast, by Application 2019 & 2032
- Table 47: India Aircraft Synthetic Vision Systems Market Revenue (Million) Forecast, by Application 2019 & 2032
- Table 48: South Korea Aircraft Synthetic Vision Systems Market Revenue (Million) Forecast, by Application 2019 & 2032
- Table 49: Rest of Asia Pacific Aircraft Synthetic Vision Systems Market Revenue (Million) Forecast, by Application 2019 & 2032
- Table 50: Global Aircraft Synthetic Vision Systems Market Revenue Million Forecast, by Type 2019 & 2032
- Table 51: Global Aircraft Synthetic Vision Systems Market Revenue Million Forecast, by End User 2019 & 2032
- Table 52: Global Aircraft Synthetic Vision Systems Market Revenue Million Forecast, by Country 2019 & 2032
- Table 53: Brazil Aircraft Synthetic Vision Systems Market Revenue (Million) Forecast, by Application 2019 & 2032
- Table 54: Mexico Aircraft Synthetic Vision Systems Market Revenue (Million) Forecast, by Application 2019 & 2032
- Table 55: Rest of Latin America Aircraft Synthetic Vision Systems Market Revenue (Million) Forecast, by Application 2019 & 2032
- Table 56: Global Aircraft Synthetic Vision Systems Market Revenue Million Forecast, by Type 2019 & 2032
- Table 57: Global Aircraft Synthetic Vision Systems Market Revenue Million Forecast, by End User 2019 & 2032
- Table 58: Global Aircraft Synthetic Vision Systems Market Revenue Million Forecast, by Country 2019 & 2032
- Table 59: United Arab Emirates Aircraft Synthetic Vision Systems Market Revenue (Million) Forecast, by Application 2019 & 2032
- Table 60: Saudi Arabia Aircraft Synthetic Vision Systems Market Revenue (Million) Forecast, by Application 2019 & 2032
- Table 61: Egypt Aircraft Synthetic Vision Systems Market Revenue (Million) Forecast, by Application 2019 & 2032
- Table 62: Rest of Middle East and Africa Aircraft Synthetic Vision Systems Market Revenue (Million) Forecast, by Application 2019 & 2032
Frequently Asked Questions
1. What is the projected Compound Annual Growth Rate (CAGR) of the Aircraft Synthetic Vision Systems Market?
The projected CAGR is approximately > 2.80%.
2. Which companies are prominent players in the Aircraft Synthetic Vision Systems Market?
Key companies in the market include L3Harris Technologies Inc, Honeywell International Inc, Avidyne Corporation, Elbit Systems Ltd, Mercury Systems Inc, Garmin Ltd, Cobham Limited, Safran SA, Thales Group, ENSCO Inc, Aspen Avionics Inc, Collins Aerospace (Raytheon Technologies Corporation).
3. What are the main segments of the Aircraft Synthetic Vision Systems Market?
The market segments include Type, End User.
4. Can you provide details about the market size?
The market size is estimated to be USD XX Million as of 2022.
5. What are some drivers contributing to market growth?
N/A
6. What are the notable trends driving market growth?
Military End-user to Witness Higher Growth During the Forecast Period.
7. Are there any restraints impacting market growth?
N/A
8. Can you provide examples of recent developments in the market?
In October 2022, Collins Aerospace achieved a technical standard order (TSO) for its combined vision system (CVS) for business aviation aircraft. The CVS provides clarity to pilots in all types of weather to confidently and securely navigate aircraft through low visibility situations.
9. What pricing options are available for accessing the report?
Pricing options include single-user, multi-user, and enterprise licenses priced at USD 4750, USD 5250, and USD 8750 respectively.
10. Is the market size provided in terms of value or volume?
The market size is provided in terms of value, measured in Million.
11. Are there any specific market keywords associated with the report?
Yes, the market keyword associated with the report is "Aircraft Synthetic Vision Systems Market," which aids in identifying and referencing the specific market segment covered.
12. How do I determine which pricing option suits my needs best?
The pricing options vary based on user requirements and access needs. Individual users may opt for single-user licenses, while businesses requiring broader access may choose multi-user or enterprise licenses for cost-effective access to the report.
13. Are there any additional resources or data provided in the Aircraft Synthetic Vision Systems Market report?
While the report offers comprehensive insights, it's advisable to review the specific contents or supplementary materials provided to ascertain if additional resources or data are available.
14. How can I stay updated on further developments or reports in the Aircraft Synthetic Vision Systems Market?
To stay informed about further developments, trends, and reports in the Aircraft Synthetic Vision Systems Market, consider subscribing to industry newsletters, following relevant companies and organizations, or regularly checking reputable industry news sources and publications.
Methodology
Step 1 - Identification of Relevant Samples Size from Population Database


Step 2 - Approaches for Defining Global Market Size (Value, Volume* & Price*)

Note*: In applicable scenarios
Step 3 - Data Sources
Primary Research
- Web Analytics
- Survey Reports
- Research Institute
- Latest Research Reports
- Opinion Leaders
Secondary Research
- Annual Reports
- White Paper
- Latest Press Release
- Industry Association
- Paid Database
- Investor Presentations

Step 4 - Data Triangulation
Involves using different sources of information in order to increase the validity of a study
These sources are likely to be stakeholders in a program - participants, other researchers, program staff, other community members, and so on.
Then we put all data in single framework & apply various statistical tools to find out the dynamic on the market.
During the analysis stage, feedback from the stakeholder groups would be compared to determine areas of agreement as well as areas of divergence


