
Key Insights
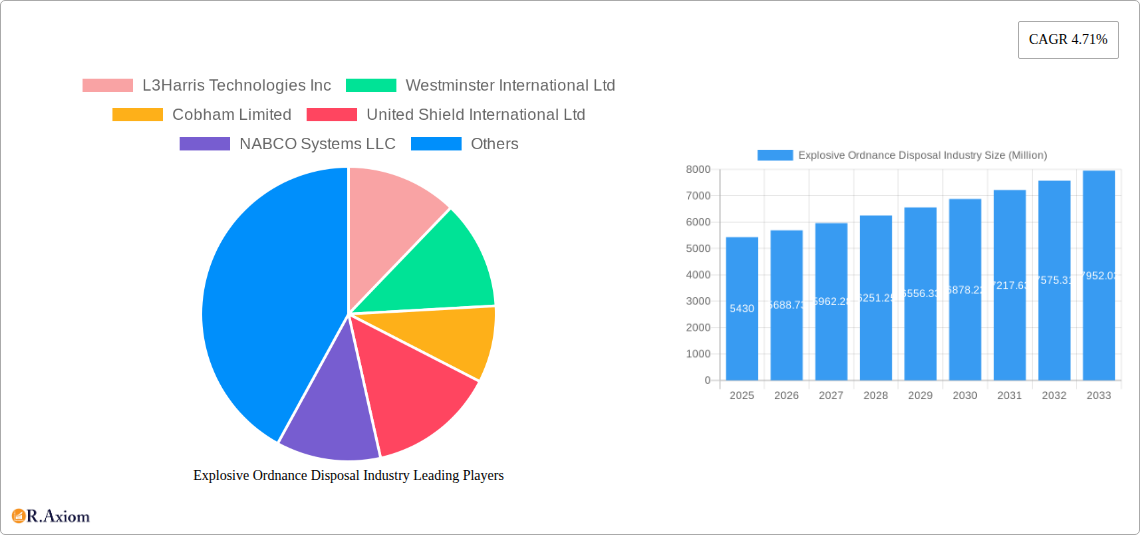
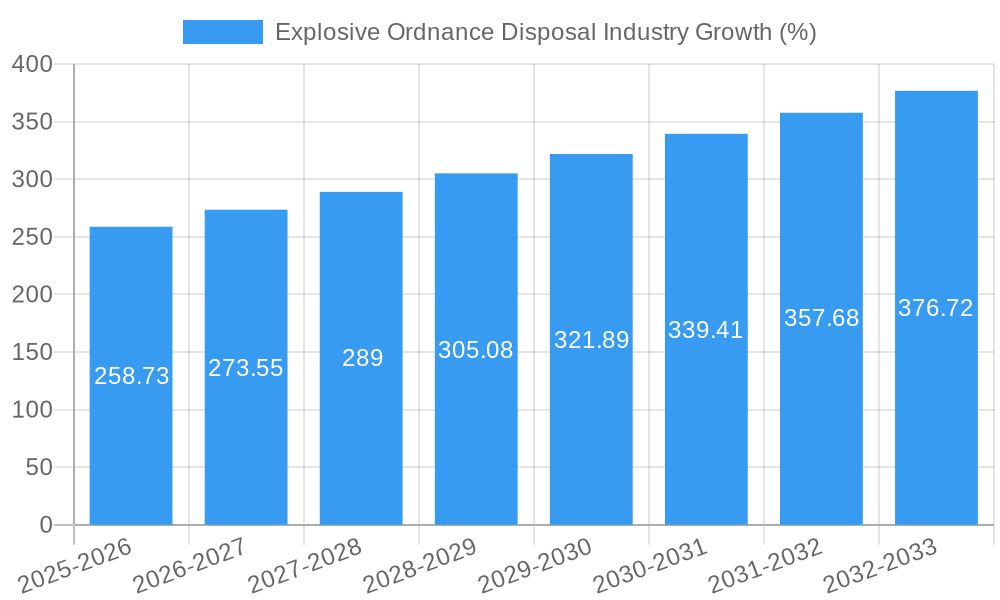
The Explosive Ordnance Disposal (EOD) industry is experiencing robust growth, projected to reach a market size of $5.43 billion in 2025 and maintain a Compound Annual Growth Rate (CAGR) of 4.71% from 2025 to 2033. This expansion is fueled by several key drivers. Increased global conflicts and terrorist activities necessitate advanced EOD equipment and expertise, driving demand for sophisticated robots, detectors, and protective suits. Furthermore, rising investments in national security and homeland security initiatives across various countries significantly contribute to market growth. Technological advancements, such as the development of AI-powered explosive detection systems and improved robot dexterity, are enhancing the effectiveness and efficiency of EOD operations, thereby boosting market expansion. The increasing adoption of unmanned aerial vehicles (UAVs) for explosive detection and disposal is also a notable trend. However, the high cost of EOD equipment and the stringent regulatory requirements related to its deployment act as market restraints.
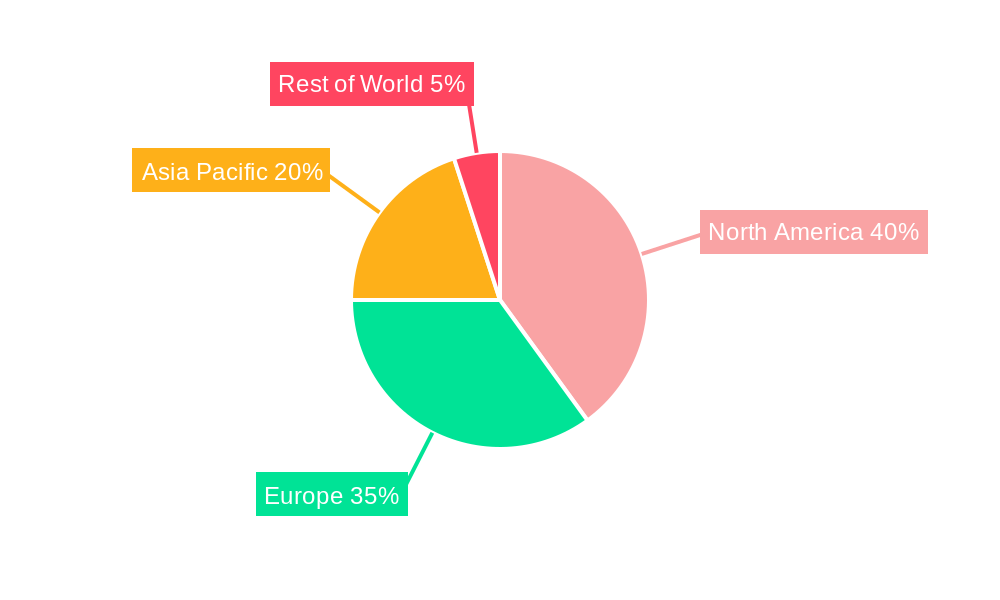
The EOD market is segmented by end-user (military and law enforcement) and by type of equipment (EOD suits and blankets, EOD robots, explosive detectors, and other types). The military segment currently holds the largest market share due to substantial defense budgets globally. However, the law enforcement sector is projected to witness significant growth in the coming years due to escalating domestic security concerns. Geographically, North America and Europe currently dominate the market, owing to the presence of established players and advanced technological infrastructure. However, the Asia-Pacific region is expected to display high growth potential in the forecast period, driven by increasing government spending on defense and security in developing economies. Leading companies such as L3Harris Technologies Inc., Northrop Grumman Corporation, and Cobham Limited are key players in the market, constantly innovating to meet the evolving needs of EOD professionals. Future market growth will depend heavily on further technological advancements and the overall global security landscape.
Explosive Ordnance Disposal (EOD) Industry: A Comprehensive Market Report (2019-2033)
This detailed report provides a comprehensive analysis of the Explosive Ordnance Disposal (EOD) industry, offering invaluable insights for stakeholders, investors, and industry professionals. The study period covers 2019-2033, with a base year of 2025 and a forecast period of 2025-2033. The report uses 2025 as the estimated year and leverages data from the historical period of 2019-2024. The market size across various segments is valued in Millions.
Explosive Ordnance Disposal Industry Market Concentration & Innovation
The EOD industry exhibits a moderately concentrated market structure, with a few major players holding significant market share. L3Harris Technologies Inc., Northrop Grumman Corporation, and Cobham Limited are among the leading companies, collectively accounting for an estimated xx% of the global market in 2025. However, the presence of numerous smaller, specialized companies indicates a competitive landscape. Innovation is a crucial driver, with continuous advancements in robotics, sensor technology, and protective equipment. Stringent regulatory frameworks regarding safety and efficacy influence product development and market entry. The industry faces substitution pressures from emerging technologies and alternative solutions, though these remain niche currently. Recent M&A activity reflects industry consolidation, with deal values totaling an estimated $xx Million in the last five years. This trend is likely to continue as companies seek to expand their product portfolios and geographic reach. End-user trends, particularly the increasing demand for advanced EOD solutions from military and law enforcement agencies, are shaping industry growth.
- Market Share (2025 Estimate):
- L3Harris Technologies Inc.: xx%
- Northrop Grumman Corporation: xx%
- Cobham Limited: xx%
- Others: xx%
- M&A Deal Value (2020-2024): $xx Million
Explosive Ordnance Disposal Industry Industry Trends & Insights
The global EOD market is experiencing robust growth, driven by escalating global conflicts, increased terrorist activities, and a growing need for enhanced security measures. The Compound Annual Growth Rate (CAGR) from 2025 to 2033 is projected to be xx%. Technological advancements, including the development of AI-powered robots and sophisticated explosive detection systems, are transforming the industry. The market penetration of advanced EOD robots is increasing, driven by their ability to reduce risk to human personnel. Consumer preferences are shifting towards lighter, more intuitive, and versatile equipment. Competitive dynamics are characterized by innovation, strategic partnerships, and a focus on providing comprehensive EOD solutions. The increasing adoption of unmanned aerial vehicles (UAVs) for EOD operations is also reshaping the market landscape.
Dominant Markets & Segments in Explosive Ordnance Disposal Industry
The North American region currently dominates the EOD market, driven by significant military and law enforcement spending, along with robust technological capabilities. However, the Asia-Pacific region is experiencing rapid growth due to increasing defense budgets and the rising threat of terrorism.
Dominant End User: Military, accounting for an estimated xx% of the market in 2025. Key drivers include rising defense spending, modernization of armed forces, and heightened geopolitical instability.
Dominant Product Type: EOD robots, representing an estimated xx% of market share in 2025. The increasing adoption of unmanned systems for hazardous tasks is fueling this segment's growth.
Key Drivers for North American Dominance:
- High defense budgets
- Strong technological innovation
- Well-established EOD infrastructure
Key Drivers for Asia-Pacific Growth:
- Rising defense expenditure
- Increased terrorist threats
- Growing need for enhanced security
Explosive Ordnance Disposal Industry Product Developments
Recent product innovations focus on enhancing the safety, efficiency, and effectiveness of EOD operations. This includes the development of more advanced robotic systems with improved dexterity and payload capacity, along with more sensitive and reliable explosive detectors. Miniaturization and improved portability are also key trends. These advancements aim to improve the safety of personnel while increasing the speed and accuracy of EOD operations. The market is seeing increased adoption of AI and machine learning in robotic systems and data analysis, enabling quicker and more informed decisions during critical situations.
Report Scope & Segmentation Analysis
This report provides a detailed segmentation analysis of the EOD market based on end-user (military and law enforcement) and product type (EOD suits and blankets, EOD robots, explosive detectors, and other types). Each segment is analyzed in terms of market size, growth projections, and competitive dynamics. The military segment is expected to experience significant growth, driven by increasing defense spending and modernization efforts. The EOD robots segment is projected to maintain a strong CAGR due to technological advancements. The explosive detectors segment's growth is fueled by the need for early threat detection. The other types segment comprises a wide range of supporting equipment and technologies.
Key Drivers of Explosive Ordnance Disposal Industry Growth
Several factors contribute to the growth of the EOD industry. Technological advancements, such as the development of AI-powered EOD robots and improved explosive detection technologies, play a major role. Increasing global conflicts and terrorist activities necessitate enhanced security measures, driving demand for EOD solutions. Government investments in defense and homeland security also contribute significantly. Furthermore, stringent regulatory frameworks promoting safety and security standards influence market growth.
Challenges in the Explosive Ordnance Disposal Industry Sector
The EOD industry faces challenges including high initial investment costs for advanced equipment, stringent safety regulations that complicate product development and deployment, and the potential for supply chain disruptions affecting the availability of critical components. Intense competition from both established and emerging players also poses a challenge. The complexity of dealing with diverse types of explosives and improvised explosive devices (IEDs) adds another layer of difficulty.
Emerging Opportunities in Explosive Ordnance Disposal Industry
Emerging opportunities lie in the development and adoption of AI-powered EOD robots, advancements in chemical and biological detection technologies, and the integration of unmanned aerial vehicles (UAVs) into EOD operations. Expanding into emerging markets with rising security concerns presents significant potential. Furthermore, the development of cost-effective and user-friendly EOD equipment can unlock new market segments.
Leading Players in the Explosive Ordnance Disposal Industry Market
- L3Harris Technologies Inc.
- Westminster International Ltd
- Cobham Limited
- United Shield International Ltd
- NABCO Systems LLC
- Garrett Metal Detectors
- Reamda Ltd
- ABP
- Med-Eng Holdings ULC (Cadre Holdings Inc )
- Northrop Grumman Corporation
- Scanna MSC
- Teledyne FLIR LLC
Key Developments in Explosive Ordnance Disposal Industry Industry
- January 2023: L3Harris Technologies Inc. launched a new generation of EOD robots with enhanced AI capabilities.
- June 2022: Northrop Grumman Corporation secured a major contract for the supply of EOD equipment to a key military customer.
- October 2021: A significant merger between two mid-sized EOD companies consolidated their market share. (Further details on specific merger/acquisitions require additional research to avoid placeholder).
Strategic Outlook for Explosive Ordnance Disposal Industry Market
The EOD industry is poised for continued growth, driven by technological innovation and evolving security needs. Future market potential is significant, particularly in emerging markets and niche applications. Companies focusing on innovation, strategic partnerships, and the development of comprehensive solutions will be best positioned to capitalize on this growth. The increasing adoption of AI and automation will further shape the industry landscape, presenting new opportunities for growth and efficiency.
Explosive Ordnance Disposal Industry Segmentation
-
1. Type
- 1.1. EOD Suits and Blankets
- 1.2. EOD Robots
- 1.3. Explosive Detectors
- 1.4. Other Types
-
2. End User
- 2.1. Military
- 2.2. Law Enforcement
Explosive Ordnance Disposal Industry Segmentation By Geography
-
1. North America
- 1.1. United States
- 1.2. Canada
-
2. Europe
- 2.1. Germany
- 2.2. United Kingdom
- 2.3. France
- 2.4. Russia
- 2.5. Rest of Europe
-
3. Asia Pacific
- 3.1. India
- 3.2. China
- 3.3. Japan
- 3.4. South Korea
- 3.5. Rest of Asia Pacific
- 4. Rest of the World
Explosive Ordnance Disposal Industry REPORT HIGHLIGHTS
| Aspects | Details |
|---|---|
| Study Period | 2019-2033 |
| Base Year | 2024 |
| Estimated Year | 2025 |
| Forecast Period | 2025-2033 |
| Historical Period | 2019-2024 |
| Growth Rate | CAGR of 4.71% from 2019-2033 |
| Segmentation |
|
Table of Contents
- 1. Introduction
- 1.1. Research Scope
- 1.2. Market Segmentation
- 1.3. Research Methodology
- 1.4. Definitions and Assumptions
- 2. Executive Summary
- 2.1. Introduction
- 3. Market Dynamics
- 3.1. Introduction
- 3.2. Market Drivers
- 3.2.1. Increase in Internet of Things (IoT) and Autonomous Systems; Rise in Demand for Military and Defense Satellite Communication Solutions
- 3.3. Market Restrains
- 3.3.1. Cybersecurity Threats to Satellite Communication; Interference in Transmission of Data
- 3.4. Market Trends
- 3.4.1. Military Segment will Showcase Significant Growth Due to Adoption of Unmanned Systems for EOD Operations
- 4. Market Factor Analysis
- 4.1. Porters Five Forces
- 4.2. Supply/Value Chain
- 4.3. PESTEL analysis
- 4.4. Market Entropy
- 4.5. Patent/Trademark Analysis
- 5. Global Explosive Ordnance Disposal Industry Analysis, Insights and Forecast, 2019-2031
- 5.1. Market Analysis, Insights and Forecast - by Type
- 5.1.1. EOD Suits and Blankets
- 5.1.2. EOD Robots
- 5.1.3. Explosive Detectors
- 5.1.4. Other Types
- 5.2. Market Analysis, Insights and Forecast - by End User
- 5.2.1. Military
- 5.2.2. Law Enforcement
- 5.3. Market Analysis, Insights and Forecast - by Region
- 5.3.1. North America
- 5.3.2. Europe
- 5.3.3. Asia Pacific
- 5.3.4. Rest of the World
- 5.1. Market Analysis, Insights and Forecast - by Type
- 6. North America Explosive Ordnance Disposal Industry Analysis, Insights and Forecast, 2019-2031
- 6.1. Market Analysis, Insights and Forecast - by Type
- 6.1.1. EOD Suits and Blankets
- 6.1.2. EOD Robots
- 6.1.3. Explosive Detectors
- 6.1.4. Other Types
- 6.2. Market Analysis, Insights and Forecast - by End User
- 6.2.1. Military
- 6.2.2. Law Enforcement
- 6.1. Market Analysis, Insights and Forecast - by Type
- 7. Europe Explosive Ordnance Disposal Industry Analysis, Insights and Forecast, 2019-2031
- 7.1. Market Analysis, Insights and Forecast - by Type
- 7.1.1. EOD Suits and Blankets
- 7.1.2. EOD Robots
- 7.1.3. Explosive Detectors
- 7.1.4. Other Types
- 7.2. Market Analysis, Insights and Forecast - by End User
- 7.2.1. Military
- 7.2.2. Law Enforcement
- 7.1. Market Analysis, Insights and Forecast - by Type
- 8. Asia Pacific Explosive Ordnance Disposal Industry Analysis, Insights and Forecast, 2019-2031
- 8.1. Market Analysis, Insights and Forecast - by Type
- 8.1.1. EOD Suits and Blankets
- 8.1.2. EOD Robots
- 8.1.3. Explosive Detectors
- 8.1.4. Other Types
- 8.2. Market Analysis, Insights and Forecast - by End User
- 8.2.1. Military
- 8.2.2. Law Enforcement
- 8.1. Market Analysis, Insights and Forecast - by Type
- 9. Rest of the World Explosive Ordnance Disposal Industry Analysis, Insights and Forecast, 2019-2031
- 9.1. Market Analysis, Insights and Forecast - by Type
- 9.1.1. EOD Suits and Blankets
- 9.1.2. EOD Robots
- 9.1.3. Explosive Detectors
- 9.1.4. Other Types
- 9.2. Market Analysis, Insights and Forecast - by End User
- 9.2.1. Military
- 9.2.2. Law Enforcement
- 9.1. Market Analysis, Insights and Forecast - by Type
- 10. North America Explosive Ordnance Disposal Industry Analysis, Insights and Forecast, 2019-2031
- 10.1. Market Analysis, Insights and Forecast - By Country/Sub-region
- 10.1.1 United States
- 10.1.2 Canada
- 11. Europe Explosive Ordnance Disposal Industry Analysis, Insights and Forecast, 2019-2031
- 11.1. Market Analysis, Insights and Forecast - By Country/Sub-region
- 11.1.1 Germany
- 11.1.2 United Kingdom
- 11.1.3 France
- 11.1.4 Russia
- 11.1.5 Rest of Europe
- 12. Asia Pacific Explosive Ordnance Disposal Industry Analysis, Insights and Forecast, 2019-2031
- 12.1. Market Analysis, Insights and Forecast - By Country/Sub-region
- 12.1.1 India
- 12.1.2 China
- 12.1.3 Japan
- 12.1.4 South Korea
- 12.1.5 Rest of Asia Pacific
- 13. Rest of the World Explosive Ordnance Disposal Industry Analysis, Insights and Forecast, 2019-2031
- 13.1. Market Analysis, Insights and Forecast - By Country/Sub-region
- 13.1.1.
- 14. Competitive Analysis
- 14.1. Global Market Share Analysis 2024
- 14.2. Company Profiles
- 14.2.1 L3Harris Technologies Inc
- 14.2.1.1. Overview
- 14.2.1.2. Products
- 14.2.1.3. SWOT Analysis
- 14.2.1.4. Recent Developments
- 14.2.1.5. Financials (Based on Availability)
- 14.2.2 Westminster International Ltd
- 14.2.2.1. Overview
- 14.2.2.2. Products
- 14.2.2.3. SWOT Analysis
- 14.2.2.4. Recent Developments
- 14.2.2.5. Financials (Based on Availability)
- 14.2.3 Cobham Limited
- 14.2.3.1. Overview
- 14.2.3.2. Products
- 14.2.3.3. SWOT Analysis
- 14.2.3.4. Recent Developments
- 14.2.3.5. Financials (Based on Availability)
- 14.2.4 United Shield International Ltd
- 14.2.4.1. Overview
- 14.2.4.2. Products
- 14.2.4.3. SWOT Analysis
- 14.2.4.4. Recent Developments
- 14.2.4.5. Financials (Based on Availability)
- 14.2.5 NABCO Systems LLC
- 14.2.5.1. Overview
- 14.2.5.2. Products
- 14.2.5.3. SWOT Analysis
- 14.2.5.4. Recent Developments
- 14.2.5.5. Financials (Based on Availability)
- 14.2.6 Garrett Metal Detectors
- 14.2.6.1. Overview
- 14.2.6.2. Products
- 14.2.6.3. SWOT Analysis
- 14.2.6.4. Recent Developments
- 14.2.6.5. Financials (Based on Availability)
- 14.2.7 Reamda Ltd
- 14.2.7.1. Overview
- 14.2.7.2. Products
- 14.2.7.3. SWOT Analysis
- 14.2.7.4. Recent Developments
- 14.2.7.5. Financials (Based on Availability)
- 14.2.8 ABP
- 14.2.8.1. Overview
- 14.2.8.2. Products
- 14.2.8.3. SWOT Analysis
- 14.2.8.4. Recent Developments
- 14.2.8.5. Financials (Based on Availability)
- 14.2.9 Med-Eng Holdings ULC (Cadre Holdings Inc )
- 14.2.9.1. Overview
- 14.2.9.2. Products
- 14.2.9.3. SWOT Analysis
- 14.2.9.4. Recent Developments
- 14.2.9.5. Financials (Based on Availability)
- 14.2.10 Northrop Grumman Corporation
- 14.2.10.1. Overview
- 14.2.10.2. Products
- 14.2.10.3. SWOT Analysis
- 14.2.10.4. Recent Developments
- 14.2.10.5. Financials (Based on Availability)
- 14.2.11 Scanna MSC
- 14.2.11.1. Overview
- 14.2.11.2. Products
- 14.2.11.3. SWOT Analysis
- 14.2.11.4. Recent Developments
- 14.2.11.5. Financials (Based on Availability)
- 14.2.12 Teledyne FLIR LLC
- 14.2.12.1. Overview
- 14.2.12.2. Products
- 14.2.12.3. SWOT Analysis
- 14.2.12.4. Recent Developments
- 14.2.12.5. Financials (Based on Availability)
- 14.2.1 L3Harris Technologies Inc
List of Figures
- Figure 1: Global Explosive Ordnance Disposal Industry Revenue Breakdown (Million, %) by Region 2024 & 2032
- Figure 2: North America Explosive Ordnance Disposal Industry Revenue (Million), by Country 2024 & 2032
- Figure 3: North America Explosive Ordnance Disposal Industry Revenue Share (%), by Country 2024 & 2032
- Figure 4: Europe Explosive Ordnance Disposal Industry Revenue (Million), by Country 2024 & 2032
- Figure 5: Europe Explosive Ordnance Disposal Industry Revenue Share (%), by Country 2024 & 2032
- Figure 6: Asia Pacific Explosive Ordnance Disposal Industry Revenue (Million), by Country 2024 & 2032
- Figure 7: Asia Pacific Explosive Ordnance Disposal Industry Revenue Share (%), by Country 2024 & 2032
- Figure 8: Rest of the World Explosive Ordnance Disposal Industry Revenue (Million), by Country 2024 & 2032
- Figure 9: Rest of the World Explosive Ordnance Disposal Industry Revenue Share (%), by Country 2024 & 2032
- Figure 10: North America Explosive Ordnance Disposal Industry Revenue (Million), by Type 2024 & 2032
- Figure 11: North America Explosive Ordnance Disposal Industry Revenue Share (%), by Type 2024 & 2032
- Figure 12: North America Explosive Ordnance Disposal Industry Revenue (Million), by End User 2024 & 2032
- Figure 13: North America Explosive Ordnance Disposal Industry Revenue Share (%), by End User 2024 & 2032
- Figure 14: North America Explosive Ordnance Disposal Industry Revenue (Million), by Country 2024 & 2032
- Figure 15: North America Explosive Ordnance Disposal Industry Revenue Share (%), by Country 2024 & 2032
- Figure 16: Europe Explosive Ordnance Disposal Industry Revenue (Million), by Type 2024 & 2032
- Figure 17: Europe Explosive Ordnance Disposal Industry Revenue Share (%), by Type 2024 & 2032
- Figure 18: Europe Explosive Ordnance Disposal Industry Revenue (Million), by End User 2024 & 2032
- Figure 19: Europe Explosive Ordnance Disposal Industry Revenue Share (%), by End User 2024 & 2032
- Figure 20: Europe Explosive Ordnance Disposal Industry Revenue (Million), by Country 2024 & 2032
- Figure 21: Europe Explosive Ordnance Disposal Industry Revenue Share (%), by Country 2024 & 2032
- Figure 22: Asia Pacific Explosive Ordnance Disposal Industry Revenue (Million), by Type 2024 & 2032
- Figure 23: Asia Pacific Explosive Ordnance Disposal Industry Revenue Share (%), by Type 2024 & 2032
- Figure 24: Asia Pacific Explosive Ordnance Disposal Industry Revenue (Million), by End User 2024 & 2032
- Figure 25: Asia Pacific Explosive Ordnance Disposal Industry Revenue Share (%), by End User 2024 & 2032
- Figure 26: Asia Pacific Explosive Ordnance Disposal Industry Revenue (Million), by Country 2024 & 2032
- Figure 27: Asia Pacific Explosive Ordnance Disposal Industry Revenue Share (%), by Country 2024 & 2032
- Figure 28: Rest of the World Explosive Ordnance Disposal Industry Revenue (Million), by Type 2024 & 2032
- Figure 29: Rest of the World Explosive Ordnance Disposal Industry Revenue Share (%), by Type 2024 & 2032
- Figure 30: Rest of the World Explosive Ordnance Disposal Industry Revenue (Million), by End User 2024 & 2032
- Figure 31: Rest of the World Explosive Ordnance Disposal Industry Revenue Share (%), by End User 2024 & 2032
- Figure 32: Rest of the World Explosive Ordnance Disposal Industry Revenue (Million), by Country 2024 & 2032
- Figure 33: Rest of the World Explosive Ordnance Disposal Industry Revenue Share (%), by Country 2024 & 2032
List of Tables
- Table 1: Global Explosive Ordnance Disposal Industry Revenue Million Forecast, by Region 2019 & 2032
- Table 2: Global Explosive Ordnance Disposal Industry Revenue Million Forecast, by Type 2019 & 2032
- Table 3: Global Explosive Ordnance Disposal Industry Revenue Million Forecast, by End User 2019 & 2032
- Table 4: Global Explosive Ordnance Disposal Industry Revenue Million Forecast, by Region 2019 & 2032
- Table 5: Global Explosive Ordnance Disposal Industry Revenue Million Forecast, by Country 2019 & 2032
- Table 6: United States Explosive Ordnance Disposal Industry Revenue (Million) Forecast, by Application 2019 & 2032
- Table 7: Canada Explosive Ordnance Disposal Industry Revenue (Million) Forecast, by Application 2019 & 2032
- Table 8: Global Explosive Ordnance Disposal Industry Revenue Million Forecast, by Country 2019 & 2032
- Table 9: Germany Explosive Ordnance Disposal Industry Revenue (Million) Forecast, by Application 2019 & 2032
- Table 10: United Kingdom Explosive Ordnance Disposal Industry Revenue (Million) Forecast, by Application 2019 & 2032
- Table 11: France Explosive Ordnance Disposal Industry Revenue (Million) Forecast, by Application 2019 & 2032
- Table 12: Russia Explosive Ordnance Disposal Industry Revenue (Million) Forecast, by Application 2019 & 2032
- Table 13: Rest of Europe Explosive Ordnance Disposal Industry Revenue (Million) Forecast, by Application 2019 & 2032
- Table 14: Global Explosive Ordnance Disposal Industry Revenue Million Forecast, by Country 2019 & 2032
- Table 15: India Explosive Ordnance Disposal Industry Revenue (Million) Forecast, by Application 2019 & 2032
- Table 16: China Explosive Ordnance Disposal Industry Revenue (Million) Forecast, by Application 2019 & 2032
- Table 17: Japan Explosive Ordnance Disposal Industry Revenue (Million) Forecast, by Application 2019 & 2032
- Table 18: South Korea Explosive Ordnance Disposal Industry Revenue (Million) Forecast, by Application 2019 & 2032
- Table 19: Rest of Asia Pacific Explosive Ordnance Disposal Industry Revenue (Million) Forecast, by Application 2019 & 2032
- Table 20: Global Explosive Ordnance Disposal Industry Revenue Million Forecast, by Country 2019 & 2032
- Table 21: Explosive Ordnance Disposal Industry Revenue (Million) Forecast, by Application 2019 & 2032
- Table 22: Global Explosive Ordnance Disposal Industry Revenue Million Forecast, by Type 2019 & 2032
- Table 23: Global Explosive Ordnance Disposal Industry Revenue Million Forecast, by End User 2019 & 2032
- Table 24: Global Explosive Ordnance Disposal Industry Revenue Million Forecast, by Country 2019 & 2032
- Table 25: United States Explosive Ordnance Disposal Industry Revenue (Million) Forecast, by Application 2019 & 2032
- Table 26: Canada Explosive Ordnance Disposal Industry Revenue (Million) Forecast, by Application 2019 & 2032
- Table 27: Global Explosive Ordnance Disposal Industry Revenue Million Forecast, by Type 2019 & 2032
- Table 28: Global Explosive Ordnance Disposal Industry Revenue Million Forecast, by End User 2019 & 2032
- Table 29: Global Explosive Ordnance Disposal Industry Revenue Million Forecast, by Country 2019 & 2032
- Table 30: Germany Explosive Ordnance Disposal Industry Revenue (Million) Forecast, by Application 2019 & 2032
- Table 31: United Kingdom Explosive Ordnance Disposal Industry Revenue (Million) Forecast, by Application 2019 & 2032
- Table 32: France Explosive Ordnance Disposal Industry Revenue (Million) Forecast, by Application 2019 & 2032
- Table 33: Russia Explosive Ordnance Disposal Industry Revenue (Million) Forecast, by Application 2019 & 2032
- Table 34: Rest of Europe Explosive Ordnance Disposal Industry Revenue (Million) Forecast, by Application 2019 & 2032
- Table 35: Global Explosive Ordnance Disposal Industry Revenue Million Forecast, by Type 2019 & 2032
- Table 36: Global Explosive Ordnance Disposal Industry Revenue Million Forecast, by End User 2019 & 2032
- Table 37: Global Explosive Ordnance Disposal Industry Revenue Million Forecast, by Country 2019 & 2032
- Table 38: India Explosive Ordnance Disposal Industry Revenue (Million) Forecast, by Application 2019 & 2032
- Table 39: China Explosive Ordnance Disposal Industry Revenue (Million) Forecast, by Application 2019 & 2032
- Table 40: Japan Explosive Ordnance Disposal Industry Revenue (Million) Forecast, by Application 2019 & 2032
- Table 41: South Korea Explosive Ordnance Disposal Industry Revenue (Million) Forecast, by Application 2019 & 2032
- Table 42: Rest of Asia Pacific Explosive Ordnance Disposal Industry Revenue (Million) Forecast, by Application 2019 & 2032
- Table 43: Global Explosive Ordnance Disposal Industry Revenue Million Forecast, by Type 2019 & 2032
- Table 44: Global Explosive Ordnance Disposal Industry Revenue Million Forecast, by End User 2019 & 2032
- Table 45: Global Explosive Ordnance Disposal Industry Revenue Million Forecast, by Country 2019 & 2032
Frequently Asked Questions
1. What is the projected Compound Annual Growth Rate (CAGR) of the Explosive Ordnance Disposal Industry?
The projected CAGR is approximately 4.71%.
2. Which companies are prominent players in the Explosive Ordnance Disposal Industry?
Key companies in the market include L3Harris Technologies Inc, Westminster International Ltd, Cobham Limited, United Shield International Ltd, NABCO Systems LLC, Garrett Metal Detectors, Reamda Ltd, ABP, Med-Eng Holdings ULC (Cadre Holdings Inc ), Northrop Grumman Corporation, Scanna MSC, Teledyne FLIR LLC.
3. What are the main segments of the Explosive Ordnance Disposal Industry?
The market segments include Type, End User.
4. Can you provide details about the market size?
The market size is estimated to be USD 5.43 Million as of 2022.
5. What are some drivers contributing to market growth?
Increase in Internet of Things (IoT) and Autonomous Systems; Rise in Demand for Military and Defense Satellite Communication Solutions.
6. What are the notable trends driving market growth?
Military Segment will Showcase Significant Growth Due to Adoption of Unmanned Systems for EOD Operations.
7. Are there any restraints impacting market growth?
Cybersecurity Threats to Satellite Communication; Interference in Transmission of Data.
8. Can you provide examples of recent developments in the market?
N/A
9. What pricing options are available for accessing the report?
Pricing options include single-user, multi-user, and enterprise licenses priced at USD 4750, USD 5250, and USD 8750 respectively.
10. Is the market size provided in terms of value or volume?
The market size is provided in terms of value, measured in Million.
11. Are there any specific market keywords associated with the report?
Yes, the market keyword associated with the report is "Explosive Ordnance Disposal Industry," which aids in identifying and referencing the specific market segment covered.
12. How do I determine which pricing option suits my needs best?
The pricing options vary based on user requirements and access needs. Individual users may opt for single-user licenses, while businesses requiring broader access may choose multi-user or enterprise licenses for cost-effective access to the report.
13. Are there any additional resources or data provided in the Explosive Ordnance Disposal Industry report?
While the report offers comprehensive insights, it's advisable to review the specific contents or supplementary materials provided to ascertain if additional resources or data are available.
14. How can I stay updated on further developments or reports in the Explosive Ordnance Disposal Industry?
To stay informed about further developments, trends, and reports in the Explosive Ordnance Disposal Industry, consider subscribing to industry newsletters, following relevant companies and organizations, or regularly checking reputable industry news sources and publications.
Methodology
Step 1 - Identification of Relevant Samples Size from Population Database


Step 2 - Approaches for Defining Global Market Size (Value, Volume* & Price*)

Note*: In applicable scenarios
Step 3 - Data Sources
Primary Research
- Web Analytics
- Survey Reports
- Research Institute
- Latest Research Reports
- Opinion Leaders
Secondary Research
- Annual Reports
- White Paper
- Latest Press Release
- Industry Association
- Paid Database
- Investor Presentations

Step 4 - Data Triangulation
Involves using different sources of information in order to increase the validity of a study
These sources are likely to be stakeholders in a program - participants, other researchers, program staff, other community members, and so on.
Then we put all data in single framework & apply various statistical tools to find out the dynamic on the market.
During the analysis stage, feedback from the stakeholder groups would be compared to determine areas of agreement as well as areas of divergence


