
Key Insights
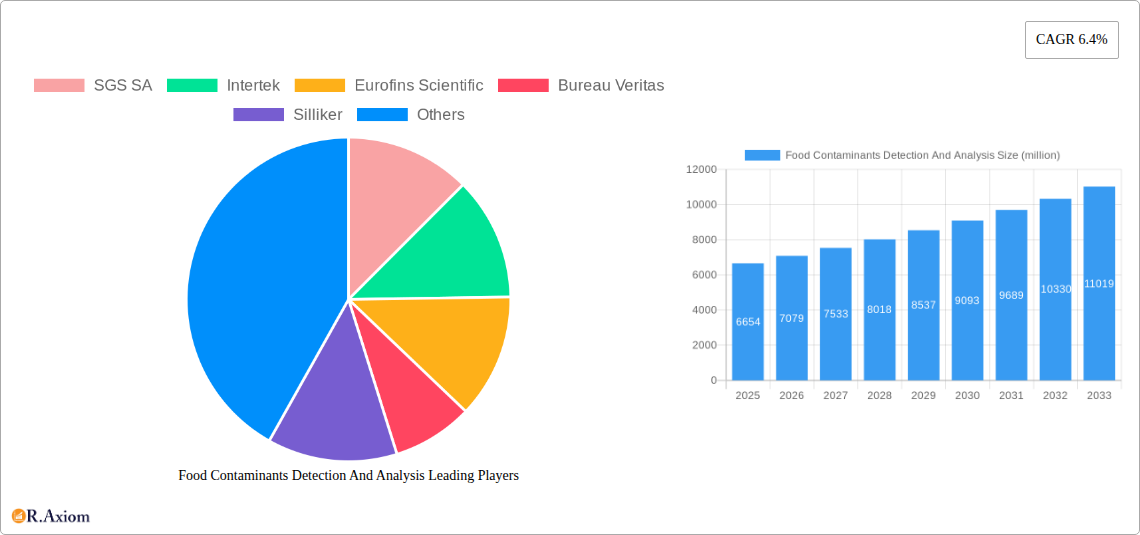
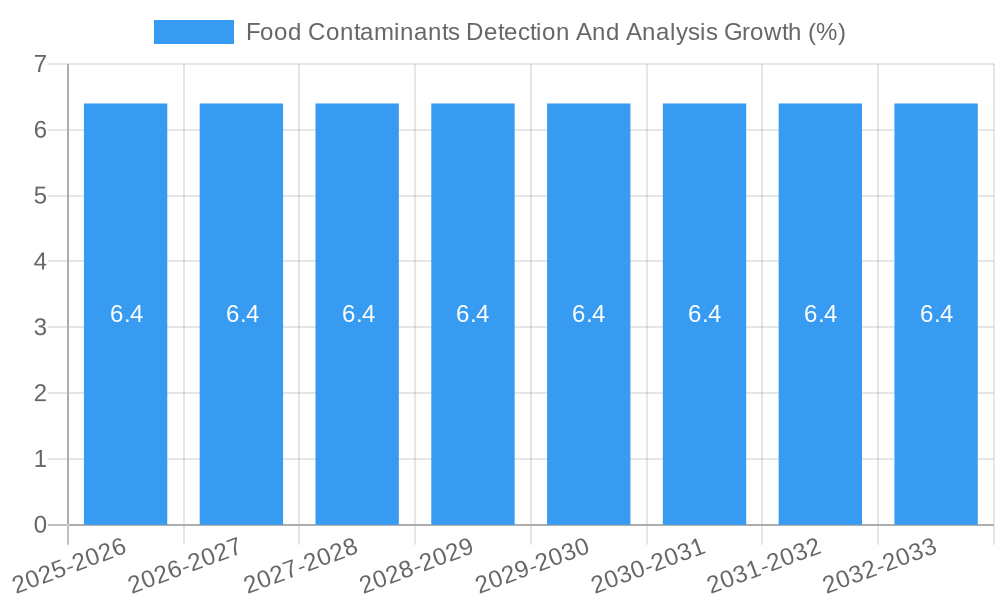
The global Food Contaminants Detection and Analysis market is poised for significant expansion, with an estimated market size of USD 6,654 million in 2025. This robust growth is projected to continue at a Compound Annual Growth Rate (CAGR) of 6.4% through 2033, indicating a dynamic and evolving industry. Key drivers fueling this expansion include the ever-increasing consumer demand for safe and high-quality food products, coupled with stringent regulatory frameworks established by governments worldwide to ensure food integrity. The growing awareness of foodborne illnesses and the long-term health implications of consuming contaminated food are also propelling the market forward. Furthermore, advancements in analytical technologies, such as sophisticated mass spectrometry, chromatography, and immunoassay techniques, are enabling more precise, rapid, and cost-effective detection of a wider range of contaminants, thereby bolstering market confidence and adoption. The market is segmented into distinct types of analyses, with Pesticide Residue Detection and Analysis and Mold Residue Detection and Analysis emerging as critical areas due to their widespread impact on agricultural produce and processed foods.
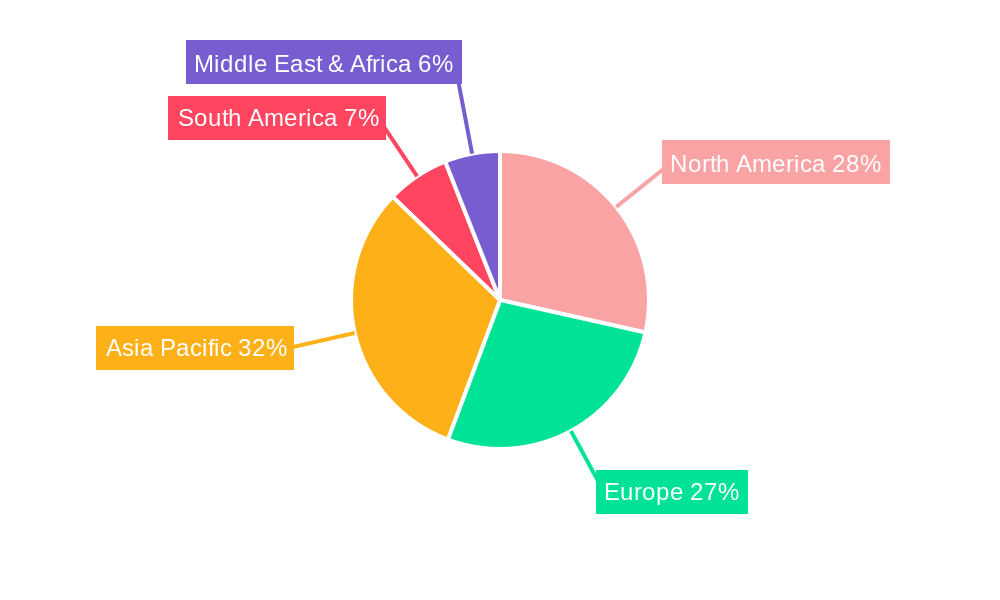
The market's trajectory is further shaped by key trends, including the rising adoption of rapid testing kits and on-site detection solutions, catering to the need for immediate results in diverse food supply chain environments. The increasing prevalence of food processing plants and the growing complexity of global food supply chains also contribute to the heightened demand for comprehensive contaminant analysis services. Leading companies such as SGS SA, Intertek, Eurofins Scientific, and Bureau Veritas are at the forefront of this market, investing heavily in research and development and expanding their service portfolios to meet evolving industry needs. While the market exhibits strong growth potential, certain restraints, such as the high cost of advanced detection equipment and the need for skilled personnel to operate them, might pose challenges. Nevertheless, the overarching commitment to food safety and the continuous drive for innovation are expected to outweigh these limitations, ensuring sustained market expansion. The Asia Pacific region, driven by rapid industrialization and a burgeoning population, is anticipated to be a significant growth engine, alongside established markets in North America and Europe.
This in-depth report offers a comprehensive analysis of the global Food Contaminants Detection and Analysis market, providing critical insights for stakeholders across the food industry supply chain. With a focus on detailed segmentation, emerging trends, and strategic outlooks, this report is designed to equip businesses with the knowledge needed to navigate this dynamic and essential sector. The study period spans from 2019 to 2033, with a base year of 2025, and a forecast period of 2025–2033, building upon historical data from 2019–2024.
Food Contaminants Detection And Analysis Market Concentration & Innovation
The global Food Contaminants Detection and Analysis market exhibits a moderate to high level of concentration, characterized by the presence of several large, established players alongside a growing number of specialized niche providers. Key market participants like SGS SA, Intertek, Eurofins Scientific, Bureau Veritas, Silliker, and ALS Ltd. hold significant market share, driven by their extensive service portfolios, global reach, and strong regulatory compliance expertise. Innovation within the sector is primarily fueled by advancements in analytical technologies, including mass spectrometry, chromatography, and molecular diagnostics, enabling faster, more sensitive, and more accurate detection of a wider range of contaminants. Regulatory frameworks, such as those from the FDA, EFSA, and Codex Alimentarius, play a pivotal role in shaping market dynamics, driving demand for sophisticated testing solutions. The increasing awareness of foodborne illnesses and the rising consumer demand for safe, transparent food sources are significant end-user trends. Product substitutes are limited, as direct testing and analysis remain the gold standard for ensuring food safety. Merger and acquisition (M&A) activities are present, with companies strategically acquiring smaller entities to expand their technological capabilities or geographical footprint. Notable M&A deal values are estimated to be in the range of several million to hundreds of millions.
Food Contaminants Detection And Analysis Industry Trends & Insights
The Food Contaminants Detection and Analysis industry is experiencing robust growth, driven by a confluence of escalating global food safety concerns, increasingly stringent regulatory landscapes, and a burgeoning consumer demand for transparency and assurance. The Compound Annual Growth Rate (CAGR) for the market is projected to be between 6.5% and 8.0% over the forecast period. Market penetration is steadily increasing as more food processing plants and food safety institutions recognize the indispensable nature of advanced testing methodologies. Technological disruptions are at the forefront of industry evolution, with the adoption of high-throughput screening techniques, portable and on-site testing devices, and advanced data analytics platforms. These innovations are significantly enhancing the speed, accuracy, and cost-effectiveness of contaminant detection.
Consumer preferences are a powerful catalyst, with a growing segment of the population actively seeking information about the origin and safety of their food, thereby pressuring brands to invest more heavily in rigorous testing. This heightened consumer awareness directly translates into increased demand for sophisticated analysis of pesticides, mycotoxins, heavy metals, allergens, and other chemical and biological contaminants. The competitive dynamics are characterized by intense innovation and strategic partnerships. Companies are investing heavily in research and development to stay ahead of emerging contaminants and evolving regulatory requirements. Furthermore, there is a discernible trend towards consolidation, with larger players acquiring smaller, specialized firms to broaden their service offerings and enhance their market position. The integration of artificial intelligence (AI) and machine learning (ML) in data interpretation and predictive analysis is also emerging as a key trend, promising to revolutionize how food safety data is managed and utilized. The global market size is estimated to be in the range of several billion.
Dominant Markets & Segments in Food Contaminants Detection And Analysis
The Food Processing Plants segment stands as the dominant force within the Food Contaminants Detection and Analysis market, driven by the continuous need for routine quality control, compliance with stringent food safety regulations, and proactive risk management throughout the production lifecycle. This segment accounts for an estimated 60% of the total market revenue.
- Key Drivers for Food Processing Plants:
- Regulatory Compliance: Strict adherence to international and national food safety standards (e.g., HACCP, ISO 22000) necessitates comprehensive testing.
- Brand Reputation: Preventing recalls and ensuring consumer trust is paramount for maintaining brand loyalty and market share.
- Supply Chain Integrity: Verifying the safety of raw ingredients and finished products from farm to fork.
- Technological Adoption: Increased investment in advanced analytical instrumentation and laboratory services to meet growing testing demands.
The Pesticide Residue Detection and Analysis type is also a leading segment, accounting for approximately 45% of the market. This dominance is attributed to the widespread use of pesticides in agriculture and the persistent concerns regarding their potential health impacts and environmental contamination. The global agricultural sector's reliance on crop protection chemicals ensures a consistent demand for sophisticated pesticide residue testing across a wide array of food commodities.
- Key Drivers for Pesticide Residue Detection and Analysis:
- Global Trade: Harmonization of international MRLs (Maximum Residue Limits) requires robust testing to facilitate cross-border food trade.
- Consumer Health Concerns: Public awareness of the potential long-term health effects of pesticide exposure drives demand for low-residue produce.
- Government Regulations: Stricter enforcement of pesticide residue limits by regulatory bodies worldwide.
- Advancements in Analytical Techniques: Development of more sensitive and faster methods for detecting a broader spectrum of pesticides.
Regionally, North America and Europe currently dominate the market, representing a combined share of over 60%. This leadership is underpinned by mature economies with highly developed food industries, strong regulatory frameworks, and a high level of consumer awareness regarding food safety. Advanced infrastructure for testing laboratories and a significant presence of major food manufacturers and testing service providers further solidify their positions.
Food Contaminants Detection And Analysis Product Developments
Product development in Food Contaminants Detection and Analysis is characterized by a drive towards greater sensitivity, specificity, and speed. Innovations include the introduction of advanced chromatography-mass spectrometry (LC-MS/MS, GC-MS/MS) systems for more comprehensive analysis of complex matrices, alongside rapid immunoassay kits and biosensors for on-site screening. These developments aim to reduce turnaround times, lower detection limits for emerging contaminants, and improve the overall efficiency of food safety testing. Competitive advantages are being gained through the development of multiplex assays capable of detecting multiple contaminants simultaneously and the integration of AI-powered software for data analysis and interpretation. The market fit for these innovations lies in their ability to address evolving regulatory requirements and growing consumer demand for safer food.
Report Scope & Segmentation Analysis
This report segments the Food Contaminants Detection and Analysis market by Application and Type.
Application Segments:
- Food Processing Plants: This segment focuses on testing conducted within manufacturing facilities to ensure product safety and compliance. Projected market size is in the range of several billion, with a CAGR of approximately 7.0% to 8.5%. Competitive dynamics are driven by technological innovation and service quality.
- Food Safety Institutions: This includes government bodies, research institutions, and third-party testing laboratories. Projected market size is in the range of several hundred million to a billion, with a CAGR of approximately 6.0% to 7.5%. Driven by regulatory mandates and scientific research.
- Others: This encompasses segments such as retail, food service, and export/import inspection. Projected market size is in the range of several hundred million, with a CAGR of approximately 5.5% to 7.0%.
Type Segments:
- Pesticide Residue Detection and Analysis: Focuses on identifying and quantifying pesticide residues. Projected market size is in the range of several billion, with a CAGR of approximately 7.0% to 8.5%.
- Mold Residue Detection and Analysis: Addresses the detection of mycotoxins and other fungal contaminants. Projected market size is in the range of several hundred million to a billion, with a CAGR of approximately 6.0% to 7.5%.
- Others: Includes analysis for heavy metals, allergens, pathogens, adulterants, and more. Projected market size is in the range of several billion, with a CAGR of approximately 6.5% to 8.0%.
Key Drivers of Food Contaminants Detection And Analysis Growth
The growth of the Food Contaminants Detection and Analysis market is propelled by several critical factors. Technological advancements in analytical instrumentation, such as next-generation sequencing and advanced mass spectrometry, are enabling more precise and rapid detection of a wider array of contaminants, including novel and emerging threats. Increasing regulatory stringency worldwide, with governments implementing stricter limits for contaminants and mandating more frequent testing, is a significant driver. For instance, the EU's expansion of its list of restricted substances directly influences testing requirements. Rising consumer awareness and demand for food safety and transparency are compelling food businesses to invest more in robust testing protocols to maintain consumer trust and brand reputation. Furthermore, globalization of the food supply chain necessitates standardized and reliable testing methods to ensure compliance across diverse markets.
Challenges in the Food Contaminants Detection And Analysis Sector
Despite robust growth, the Food Contaminants Detection and Analysis sector faces several challenges. High cost of advanced analytical equipment and specialized reagents can be a barrier, especially for smaller businesses. Shortage of skilled personnel with expertise in analytical chemistry and food science can also impede laboratory operations and expansion. Evolving nature of contaminants and the emergence of new threats require continuous adaptation and investment in new testing methodologies, posing a significant R&D challenge. Variability in international regulatory standards can create complexities for companies operating in global markets, necessitating tailored testing strategies. Maintaining rapid turnaround times while ensuring accuracy in complex sample matrices is another ongoing challenge.
Emerging Opportunities in Food Contaminants Detection And Analysis
The Food Contaminants Detection and Analysis market presents numerous emerging opportunities. The increasing focus on traceability and transparency in the food supply chain opens avenues for blockchain-integrated testing solutions and advanced data analytics platforms. The growing demand for plant-based and alternative proteins is creating new testing challenges and opportunities, particularly concerning novel contaminants and allergens. The development and adoption of portable and field-deployable testing devices are expanding the scope of analysis beyond traditional laboratory settings, enabling faster, on-site detection. Furthermore, the growing concern over microplastics in food is emerging as a significant area for future research and testing solutions. The expansion of the halal and kosher food markets also drives demand for specialized testing to ensure compliance with religious dietary laws.
Leading Players in the Food Contaminants Detection And Analysis Market
- SGS SA
- Intertek
- Eurofins Scientific
- Bureau Veritas
- Silliker
- ALS Ltd
- Asure Quality Limited
- Microbac Laboratories
- Covance Inc
- DTS Food Laboratories
- Bio-Rad Laboratories
- ALS Limited
- TUV SUD
- AsureQuality Ltd.
- DNV GL
- Centre Testing International Group
- Merieux Nutrisciences
- AsureQuality
- PONY
- Jiangxi Zodolabs Biotechnology
- Shanhai Yuanben
Key Developments in Food Contaminants Detection And Analysis Industry
- 2023/Ongoing: Increased adoption of AI and machine learning for predictive analysis of contaminant risks and optimized testing strategies.
- 2023: Launch of new multiplex assays for simultaneous detection of multiple allergens and pathogens, improving efficiency for food producers.
- 2022/2023: Significant investment in R&D for developing rapid on-site testing solutions for emerging contaminants like microplastics.
- 2022: Several major players announced strategic partnerships or acquisitions to expand their capabilities in areas like environmental monitoring for food safety.
- 2021/2022: Enhanced focus on validating and implementing advanced techniques for the detection of novel food fraud indicators.
- 2020/2021: Introduction of more sensitive LC-MS/MS and GC-MS/MS systems with lower detection limits for pesticide residues and veterinary drugs.
- 2019 onwards: Growing emphasis on the detection of per- and polyfluoroalkyl substances (PFAS) in food packaging and agricultural products.
Strategic Outlook for Food Contaminants Detection And Analysis Market
The strategic outlook for the Food Contaminants Detection and Analysis market is highly positive, characterized by sustained growth and evolving opportunities. Key growth catalysts include the continuous innovation in analytical technologies, the increasing global harmonization of food safety regulations, and the persistent consumer demand for safe and transparent food products. Companies that invest in expanding their service portfolios to include emerging contaminants, adopt advanced digital solutions for data management and reporting, and strategically forge partnerships will be best positioned for success. The market will continue to witness consolidation as larger entities seek to acquire specialized expertise and broaden their geographical reach. The focus on sustainability and ethical sourcing will also influence testing demands, creating new niches for specialized analysis.
Food Contaminants Detection And Analysis Segmentation
-
1. Application
- 1.1. Food Processing Plants
- 1.2. Food Safety Institutions
- 1.3. Others
-
2. Type
- 2.1. Pesticide Residue Detection and Analysis
- 2.2. Mold Residue Detection and Analysis
- 2.3. Others
Food Contaminants Detection And Analysis Segmentation By Geography
-
1. North America
- 1.1. United States
- 1.2. Canada
- 1.3. Mexico
-
2. South America
- 2.1. Brazil
- 2.2. Argentina
- 2.3. Rest of South America
-
3. Europe
- 3.1. United Kingdom
- 3.2. Germany
- 3.3. France
- 3.4. Italy
- 3.5. Spain
- 3.6. Russia
- 3.7. Benelux
- 3.8. Nordics
- 3.9. Rest of Europe
-
4. Middle East & Africa
- 4.1. Turkey
- 4.2. Israel
- 4.3. GCC
- 4.4. North Africa
- 4.5. South Africa
- 4.6. Rest of Middle East & Africa
-
5. Asia Pacific
- 5.1. China
- 5.2. India
- 5.3. Japan
- 5.4. South Korea
- 5.5. ASEAN
- 5.6. Oceania
- 5.7. Rest of Asia Pacific
Food Contaminants Detection And Analysis REPORT HIGHLIGHTS
| Aspects | Details |
|---|---|
| Study Period | 2019-2033 |
| Base Year | 2024 |
| Estimated Year | 2025 |
| Forecast Period | 2025-2033 |
| Historical Period | 2019-2024 |
| Growth Rate | CAGR of 6.4% from 2019-2033 |
| Segmentation |
|
Table of Contents
- 1. Introduction
- 1.1. Research Scope
- 1.2. Market Segmentation
- 1.3. Research Methodology
- 1.4. Definitions and Assumptions
- 2. Executive Summary
- 2.1. Introduction
- 3. Market Dynamics
- 3.1. Introduction
- 3.2. Market Drivers
- 3.3. Market Restrains
- 3.4. Market Trends
- 4. Market Factor Analysis
- 4.1. Porters Five Forces
- 4.2. Supply/Value Chain
- 4.3. PESTEL analysis
- 4.4. Market Entropy
- 4.5. Patent/Trademark Analysis
- 5. Global Food Contaminants Detection And Analysis Analysis, Insights and Forecast, 2019-2031
- 5.1. Market Analysis, Insights and Forecast - by Application
- 5.1.1. Food Processing Plants
- 5.1.2. Food Safety Institutions
- 5.1.3. Others
- 5.2. Market Analysis, Insights and Forecast - by Type
- 5.2.1. Pesticide Residue Detection and Analysis
- 5.2.2. Mold Residue Detection and Analysis
- 5.2.3. Others
- 5.3. Market Analysis, Insights and Forecast - by Region
- 5.3.1. North America
- 5.3.2. South America
- 5.3.3. Europe
- 5.3.4. Middle East & Africa
- 5.3.5. Asia Pacific
- 5.1. Market Analysis, Insights and Forecast - by Application
- 6. North America Food Contaminants Detection And Analysis Analysis, Insights and Forecast, 2019-2031
- 6.1. Market Analysis, Insights and Forecast - by Application
- 6.1.1. Food Processing Plants
- 6.1.2. Food Safety Institutions
- 6.1.3. Others
- 6.2. Market Analysis, Insights and Forecast - by Type
- 6.2.1. Pesticide Residue Detection and Analysis
- 6.2.2. Mold Residue Detection and Analysis
- 6.2.3. Others
- 6.1. Market Analysis, Insights and Forecast - by Application
- 7. South America Food Contaminants Detection And Analysis Analysis, Insights and Forecast, 2019-2031
- 7.1. Market Analysis, Insights and Forecast - by Application
- 7.1.1. Food Processing Plants
- 7.1.2. Food Safety Institutions
- 7.1.3. Others
- 7.2. Market Analysis, Insights and Forecast - by Type
- 7.2.1. Pesticide Residue Detection and Analysis
- 7.2.2. Mold Residue Detection and Analysis
- 7.2.3. Others
- 7.1. Market Analysis, Insights and Forecast - by Application
- 8. Europe Food Contaminants Detection And Analysis Analysis, Insights and Forecast, 2019-2031
- 8.1. Market Analysis, Insights and Forecast - by Application
- 8.1.1. Food Processing Plants
- 8.1.2. Food Safety Institutions
- 8.1.3. Others
- 8.2. Market Analysis, Insights and Forecast - by Type
- 8.2.1. Pesticide Residue Detection and Analysis
- 8.2.2. Mold Residue Detection and Analysis
- 8.2.3. Others
- 8.1. Market Analysis, Insights and Forecast - by Application
- 9. Middle East & Africa Food Contaminants Detection And Analysis Analysis, Insights and Forecast, 2019-2031
- 9.1. Market Analysis, Insights and Forecast - by Application
- 9.1.1. Food Processing Plants
- 9.1.2. Food Safety Institutions
- 9.1.3. Others
- 9.2. Market Analysis, Insights and Forecast - by Type
- 9.2.1. Pesticide Residue Detection and Analysis
- 9.2.2. Mold Residue Detection and Analysis
- 9.2.3. Others
- 9.1. Market Analysis, Insights and Forecast - by Application
- 10. Asia Pacific Food Contaminants Detection And Analysis Analysis, Insights and Forecast, 2019-2031
- 10.1. Market Analysis, Insights and Forecast - by Application
- 10.1.1. Food Processing Plants
- 10.1.2. Food Safety Institutions
- 10.1.3. Others
- 10.2. Market Analysis, Insights and Forecast - by Type
- 10.2.1. Pesticide Residue Detection and Analysis
- 10.2.2. Mold Residue Detection and Analysis
- 10.2.3. Others
- 10.1. Market Analysis, Insights and Forecast - by Application
- 11. Competitive Analysis
- 11.1. Global Market Share Analysis 2024
- 11.2. Company Profiles
- 11.2.1 SGS SA
- 11.2.1.1. Overview
- 11.2.1.2. Products
- 11.2.1.3. SWOT Analysis
- 11.2.1.4. Recent Developments
- 11.2.1.5. Financials (Based on Availability)
- 11.2.2 Intertek
- 11.2.2.1. Overview
- 11.2.2.2. Products
- 11.2.2.3. SWOT Analysis
- 11.2.2.4. Recent Developments
- 11.2.2.5. Financials (Based on Availability)
- 11.2.3 Eurofins Scientific
- 11.2.3.1. Overview
- 11.2.3.2. Products
- 11.2.3.3. SWOT Analysis
- 11.2.3.4. Recent Developments
- 11.2.3.5. Financials (Based on Availability)
- 11.2.4 Bureau Veritas
- 11.2.4.1. Overview
- 11.2.4.2. Products
- 11.2.4.3. SWOT Analysis
- 11.2.4.4. Recent Developments
- 11.2.4.5. Financials (Based on Availability)
- 11.2.5 Silliker
- 11.2.5.1. Overview
- 11.2.5.2. Products
- 11.2.5.3. SWOT Analysis
- 11.2.5.4. Recent Developments
- 11.2.5.5. Financials (Based on Availability)
- 11.2.6 ALS Ltd
- 11.2.6.1. Overview
- 11.2.6.2. Products
- 11.2.6.3. SWOT Analysis
- 11.2.6.4. Recent Developments
- 11.2.6.5. Financials (Based on Availability)
- 11.2.7 Asure Quality Limited
- 11.2.7.1. Overview
- 11.2.7.2. Products
- 11.2.7.3. SWOT Analysis
- 11.2.7.4. Recent Developments
- 11.2.7.5. Financials (Based on Availability)
- 11.2.8 Microbac Laboratories
- 11.2.8.1. Overview
- 11.2.8.2. Products
- 11.2.8.3. SWOT Analysis
- 11.2.8.4. Recent Developments
- 11.2.8.5. Financials (Based on Availability)
- 11.2.9 Covance Inc
- 11.2.9.1. Overview
- 11.2.9.2. Products
- 11.2.9.3. SWOT Analysis
- 11.2.9.4. Recent Developments
- 11.2.9.5. Financials (Based on Availability)
- 11.2.10 DTS Food Laboratories
- 11.2.10.1. Overview
- 11.2.10.2. Products
- 11.2.10.3. SWOT Analysis
- 11.2.10.4. Recent Developments
- 11.2.10.5. Financials (Based on Availability)
- 11.2.11 Bio-Rad Laboratories
- 11.2.11.1. Overview
- 11.2.11.2. Products
- 11.2.11.3. SWOT Analysis
- 11.2.11.4. Recent Developments
- 11.2.11.5. Financials (Based on Availability)
- 11.2.12 ALS Limited
- 11.2.12.1. Overview
- 11.2.12.2. Products
- 11.2.12.3. SWOT Analysis
- 11.2.12.4. Recent Developments
- 11.2.12.5. Financials (Based on Availability)
- 11.2.13 TUV SUD
- 11.2.13.1. Overview
- 11.2.13.2. Products
- 11.2.13.3. SWOT Analysis
- 11.2.13.4. Recent Developments
- 11.2.13.5. Financials (Based on Availability)
- 11.2.14 AsureQuality Ltd.
- 11.2.14.1. Overview
- 11.2.14.2. Products
- 11.2.14.3. SWOT Analysis
- 11.2.14.4. Recent Developments
- 11.2.14.5. Financials (Based on Availability)
- 11.2.15 DNV GL
- 11.2.15.1. Overview
- 11.2.15.2. Products
- 11.2.15.3. SWOT Analysis
- 11.2.15.4. Recent Developments
- 11.2.15.5. Financials (Based on Availability)
- 11.2.16 Centre Testing International Group
- 11.2.16.1. Overview
- 11.2.16.2. Products
- 11.2.16.3. SWOT Analysis
- 11.2.16.4. Recent Developments
- 11.2.16.5. Financials (Based on Availability)
- 11.2.17 Merieux Nutrisciences
- 11.2.17.1. Overview
- 11.2.17.2. Products
- 11.2.17.3. SWOT Analysis
- 11.2.17.4. Recent Developments
- 11.2.17.5. Financials (Based on Availability)
- 11.2.18 AsureQuality
- 11.2.18.1. Overview
- 11.2.18.2. Products
- 11.2.18.3. SWOT Analysis
- 11.2.18.4. Recent Developments
- 11.2.18.5. Financials (Based on Availability)
- 11.2.19 PONY
- 11.2.19.1. Overview
- 11.2.19.2. Products
- 11.2.19.3. SWOT Analysis
- 11.2.19.4. Recent Developments
- 11.2.19.5. Financials (Based on Availability)
- 11.2.20 Jiangxi Zodolabs Biotechnology
- 11.2.20.1. Overview
- 11.2.20.2. Products
- 11.2.20.3. SWOT Analysis
- 11.2.20.4. Recent Developments
- 11.2.20.5. Financials (Based on Availability)
- 11.2.21 Shanhai Yuanben
- 11.2.21.1. Overview
- 11.2.21.2. Products
- 11.2.21.3. SWOT Analysis
- 11.2.21.4. Recent Developments
- 11.2.21.5. Financials (Based on Availability)
- 11.2.1 SGS SA
List of Figures
- Figure 1: Global Food Contaminants Detection And Analysis Revenue Breakdown (million, %) by Region 2024 & 2032
- Figure 2: North America Food Contaminants Detection And Analysis Revenue (million), by Application 2024 & 2032
- Figure 3: North America Food Contaminants Detection And Analysis Revenue Share (%), by Application 2024 & 2032
- Figure 4: North America Food Contaminants Detection And Analysis Revenue (million), by Type 2024 & 2032
- Figure 5: North America Food Contaminants Detection And Analysis Revenue Share (%), by Type 2024 & 2032
- Figure 6: North America Food Contaminants Detection And Analysis Revenue (million), by Country 2024 & 2032
- Figure 7: North America Food Contaminants Detection And Analysis Revenue Share (%), by Country 2024 & 2032
- Figure 8: South America Food Contaminants Detection And Analysis Revenue (million), by Application 2024 & 2032
- Figure 9: South America Food Contaminants Detection And Analysis Revenue Share (%), by Application 2024 & 2032
- Figure 10: South America Food Contaminants Detection And Analysis Revenue (million), by Type 2024 & 2032
- Figure 11: South America Food Contaminants Detection And Analysis Revenue Share (%), by Type 2024 & 2032
- Figure 12: South America Food Contaminants Detection And Analysis Revenue (million), by Country 2024 & 2032
- Figure 13: South America Food Contaminants Detection And Analysis Revenue Share (%), by Country 2024 & 2032
- Figure 14: Europe Food Contaminants Detection And Analysis Revenue (million), by Application 2024 & 2032
- Figure 15: Europe Food Contaminants Detection And Analysis Revenue Share (%), by Application 2024 & 2032
- Figure 16: Europe Food Contaminants Detection And Analysis Revenue (million), by Type 2024 & 2032
- Figure 17: Europe Food Contaminants Detection And Analysis Revenue Share (%), by Type 2024 & 2032
- Figure 18: Europe Food Contaminants Detection And Analysis Revenue (million), by Country 2024 & 2032
- Figure 19: Europe Food Contaminants Detection And Analysis Revenue Share (%), by Country 2024 & 2032
- Figure 20: Middle East & Africa Food Contaminants Detection And Analysis Revenue (million), by Application 2024 & 2032
- Figure 21: Middle East & Africa Food Contaminants Detection And Analysis Revenue Share (%), by Application 2024 & 2032
- Figure 22: Middle East & Africa Food Contaminants Detection And Analysis Revenue (million), by Type 2024 & 2032
- Figure 23: Middle East & Africa Food Contaminants Detection And Analysis Revenue Share (%), by Type 2024 & 2032
- Figure 24: Middle East & Africa Food Contaminants Detection And Analysis Revenue (million), by Country 2024 & 2032
- Figure 25: Middle East & Africa Food Contaminants Detection And Analysis Revenue Share (%), by Country 2024 & 2032
- Figure 26: Asia Pacific Food Contaminants Detection And Analysis Revenue (million), by Application 2024 & 2032
- Figure 27: Asia Pacific Food Contaminants Detection And Analysis Revenue Share (%), by Application 2024 & 2032
- Figure 28: Asia Pacific Food Contaminants Detection And Analysis Revenue (million), by Type 2024 & 2032
- Figure 29: Asia Pacific Food Contaminants Detection And Analysis Revenue Share (%), by Type 2024 & 2032
- Figure 30: Asia Pacific Food Contaminants Detection And Analysis Revenue (million), by Country 2024 & 2032
- Figure 31: Asia Pacific Food Contaminants Detection And Analysis Revenue Share (%), by Country 2024 & 2032
List of Tables
- Table 1: Global Food Contaminants Detection And Analysis Revenue million Forecast, by Region 2019 & 2032
- Table 2: Global Food Contaminants Detection And Analysis Revenue million Forecast, by Application 2019 & 2032
- Table 3: Global Food Contaminants Detection And Analysis Revenue million Forecast, by Type 2019 & 2032
- Table 4: Global Food Contaminants Detection And Analysis Revenue million Forecast, by Region 2019 & 2032
- Table 5: Global Food Contaminants Detection And Analysis Revenue million Forecast, by Application 2019 & 2032
- Table 6: Global Food Contaminants Detection And Analysis Revenue million Forecast, by Type 2019 & 2032
- Table 7: Global Food Contaminants Detection And Analysis Revenue million Forecast, by Country 2019 & 2032
- Table 8: United States Food Contaminants Detection And Analysis Revenue (million) Forecast, by Application 2019 & 2032
- Table 9: Canada Food Contaminants Detection And Analysis Revenue (million) Forecast, by Application 2019 & 2032
- Table 10: Mexico Food Contaminants Detection And Analysis Revenue (million) Forecast, by Application 2019 & 2032
- Table 11: Global Food Contaminants Detection And Analysis Revenue million Forecast, by Application 2019 & 2032
- Table 12: Global Food Contaminants Detection And Analysis Revenue million Forecast, by Type 2019 & 2032
- Table 13: Global Food Contaminants Detection And Analysis Revenue million Forecast, by Country 2019 & 2032
- Table 14: Brazil Food Contaminants Detection And Analysis Revenue (million) Forecast, by Application 2019 & 2032
- Table 15: Argentina Food Contaminants Detection And Analysis Revenue (million) Forecast, by Application 2019 & 2032
- Table 16: Rest of South America Food Contaminants Detection And Analysis Revenue (million) Forecast, by Application 2019 & 2032
- Table 17: Global Food Contaminants Detection And Analysis Revenue million Forecast, by Application 2019 & 2032
- Table 18: Global Food Contaminants Detection And Analysis Revenue million Forecast, by Type 2019 & 2032
- Table 19: Global Food Contaminants Detection And Analysis Revenue million Forecast, by Country 2019 & 2032
- Table 20: United Kingdom Food Contaminants Detection And Analysis Revenue (million) Forecast, by Application 2019 & 2032
- Table 21: Germany Food Contaminants Detection And Analysis Revenue (million) Forecast, by Application 2019 & 2032
- Table 22: France Food Contaminants Detection And Analysis Revenue (million) Forecast, by Application 2019 & 2032
- Table 23: Italy Food Contaminants Detection And Analysis Revenue (million) Forecast, by Application 2019 & 2032
- Table 24: Spain Food Contaminants Detection And Analysis Revenue (million) Forecast, by Application 2019 & 2032
- Table 25: Russia Food Contaminants Detection And Analysis Revenue (million) Forecast, by Application 2019 & 2032
- Table 26: Benelux Food Contaminants Detection And Analysis Revenue (million) Forecast, by Application 2019 & 2032
- Table 27: Nordics Food Contaminants Detection And Analysis Revenue (million) Forecast, by Application 2019 & 2032
- Table 28: Rest of Europe Food Contaminants Detection And Analysis Revenue (million) Forecast, by Application 2019 & 2032
- Table 29: Global Food Contaminants Detection And Analysis Revenue million Forecast, by Application 2019 & 2032
- Table 30: Global Food Contaminants Detection And Analysis Revenue million Forecast, by Type 2019 & 2032
- Table 31: Global Food Contaminants Detection And Analysis Revenue million Forecast, by Country 2019 & 2032
- Table 32: Turkey Food Contaminants Detection And Analysis Revenue (million) Forecast, by Application 2019 & 2032
- Table 33: Israel Food Contaminants Detection And Analysis Revenue (million) Forecast, by Application 2019 & 2032
- Table 34: GCC Food Contaminants Detection And Analysis Revenue (million) Forecast, by Application 2019 & 2032
- Table 35: North Africa Food Contaminants Detection And Analysis Revenue (million) Forecast, by Application 2019 & 2032
- Table 36: South Africa Food Contaminants Detection And Analysis Revenue (million) Forecast, by Application 2019 & 2032
- Table 37: Rest of Middle East & Africa Food Contaminants Detection And Analysis Revenue (million) Forecast, by Application 2019 & 2032
- Table 38: Global Food Contaminants Detection And Analysis Revenue million Forecast, by Application 2019 & 2032
- Table 39: Global Food Contaminants Detection And Analysis Revenue million Forecast, by Type 2019 & 2032
- Table 40: Global Food Contaminants Detection And Analysis Revenue million Forecast, by Country 2019 & 2032
- Table 41: China Food Contaminants Detection And Analysis Revenue (million) Forecast, by Application 2019 & 2032
- Table 42: India Food Contaminants Detection And Analysis Revenue (million) Forecast, by Application 2019 & 2032
- Table 43: Japan Food Contaminants Detection And Analysis Revenue (million) Forecast, by Application 2019 & 2032
- Table 44: South Korea Food Contaminants Detection And Analysis Revenue (million) Forecast, by Application 2019 & 2032
- Table 45: ASEAN Food Contaminants Detection And Analysis Revenue (million) Forecast, by Application 2019 & 2032
- Table 46: Oceania Food Contaminants Detection And Analysis Revenue (million) Forecast, by Application 2019 & 2032
- Table 47: Rest of Asia Pacific Food Contaminants Detection And Analysis Revenue (million) Forecast, by Application 2019 & 2032
Frequently Asked Questions
1. What is the projected Compound Annual Growth Rate (CAGR) of the Food Contaminants Detection And Analysis?
The projected CAGR is approximately 6.4%.
2. Which companies are prominent players in the Food Contaminants Detection And Analysis?
Key companies in the market include SGS SA, Intertek, Eurofins Scientific, Bureau Veritas, Silliker, ALS Ltd, Asure Quality Limited, Microbac Laboratories, Covance Inc, DTS Food Laboratories, Bio-Rad Laboratories, ALS Limited, TUV SUD, AsureQuality Ltd., DNV GL, Centre Testing International Group, Merieux Nutrisciences, AsureQuality, PONY, Jiangxi Zodolabs Biotechnology, Shanhai Yuanben.
3. What are the main segments of the Food Contaminants Detection And Analysis?
The market segments include Application, Type.
4. Can you provide details about the market size?
The market size is estimated to be USD 6654 million as of 2022.
5. What are some drivers contributing to market growth?
N/A
6. What are the notable trends driving market growth?
N/A
7. Are there any restraints impacting market growth?
N/A
8. Can you provide examples of recent developments in the market?
N/A
9. What pricing options are available for accessing the report?
Pricing options include single-user, multi-user, and enterprise licenses priced at USD 2900.00, USD 4350.00, and USD 5800.00 respectively.
10. Is the market size provided in terms of value or volume?
The market size is provided in terms of value, measured in million.
11. Are there any specific market keywords associated with the report?
Yes, the market keyword associated with the report is "Food Contaminants Detection And Analysis," which aids in identifying and referencing the specific market segment covered.
12. How do I determine which pricing option suits my needs best?
The pricing options vary based on user requirements and access needs. Individual users may opt for single-user licenses, while businesses requiring broader access may choose multi-user or enterprise licenses for cost-effective access to the report.
13. Are there any additional resources or data provided in the Food Contaminants Detection And Analysis report?
While the report offers comprehensive insights, it's advisable to review the specific contents or supplementary materials provided to ascertain if additional resources or data are available.
14. How can I stay updated on further developments or reports in the Food Contaminants Detection And Analysis?
To stay informed about further developments, trends, and reports in the Food Contaminants Detection And Analysis, consider subscribing to industry newsletters, following relevant companies and organizations, or regularly checking reputable industry news sources and publications.
Methodology
Step 1 - Identification of Relevant Samples Size from Population Database


Step 2 - Approaches for Defining Global Market Size (Value, Volume* & Price*)

Note*: In applicable scenarios
Step 3 - Data Sources
Primary Research
- Web Analytics
- Survey Reports
- Research Institute
- Latest Research Reports
- Opinion Leaders
Secondary Research
- Annual Reports
- White Paper
- Latest Press Release
- Industry Association
- Paid Database
- Investor Presentations

Step 4 - Data Triangulation
Involves using different sources of information in order to increase the validity of a study
These sources are likely to be stakeholders in a program - participants, other researchers, program staff, other community members, and so on.
Then we put all data in single framework & apply various statistical tools to find out the dynamic on the market.
During the analysis stage, feedback from the stakeholder groups would be compared to determine areas of agreement as well as areas of divergence


