

Key Insights
The global natural baby food market is poised for substantial growth, projected at a Compound Annual Growth Rate (CAGR) of 16.3% from 2025 to 2033. The market size was valued at approximately 8.62 billion in the base year 2025. This expansion is fueled by heightened parental awareness of the health benefits associated with organic and natural ingredients, alongside increasing disposable incomes in developing economies. The demand for minimally processed foods, free from artificial additives and preservatives, is a key driver, especially among health-conscious millennial parents. Product segmentation includes milk formula, prepared baby food, and dried baby food, catering to diverse dietary requirements. Distribution channels encompass supermarkets, convenience stores, and the rapidly growing online retail sector, with traditional retail maintaining a significant presence. Leading companies such as Nestlé, Abbott Laboratories, and Danone are actively engaged in product innovation and strategic acquisitions. Market growth may be constrained by fluctuating raw material prices and stringent regulatory compliance.
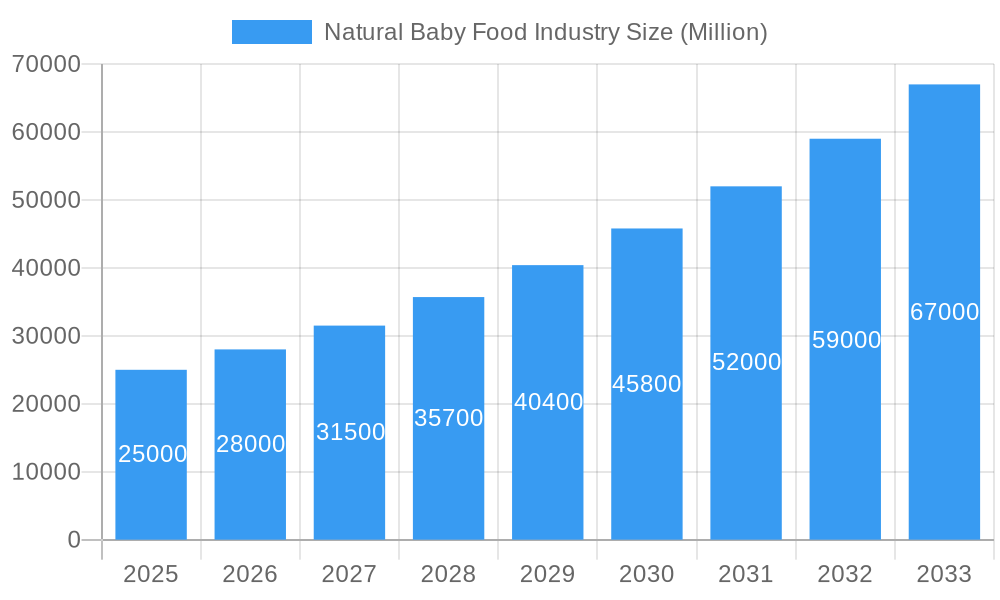
Natural Baby Food Industry Market Size (In Billion)
Despite these challenges, the long-term outlook for the natural baby food market remains highly positive. Developed markets like North America and Europe are expected to experience steady expansion, while emerging economies in Asia-Pacific and South America are anticipated to witness accelerated growth due to increasing urbanization and a rising middle class. Continuous innovation, focusing on sustainable and ethically sourced ingredients, will be crucial for competitive advantage. Tailored marketing strategies targeting specific demographic segments and cultural food preferences will further augment growth. The market is expected to see consolidation through acquisitions of smaller niche brands by larger players, leading to increased market concentration.
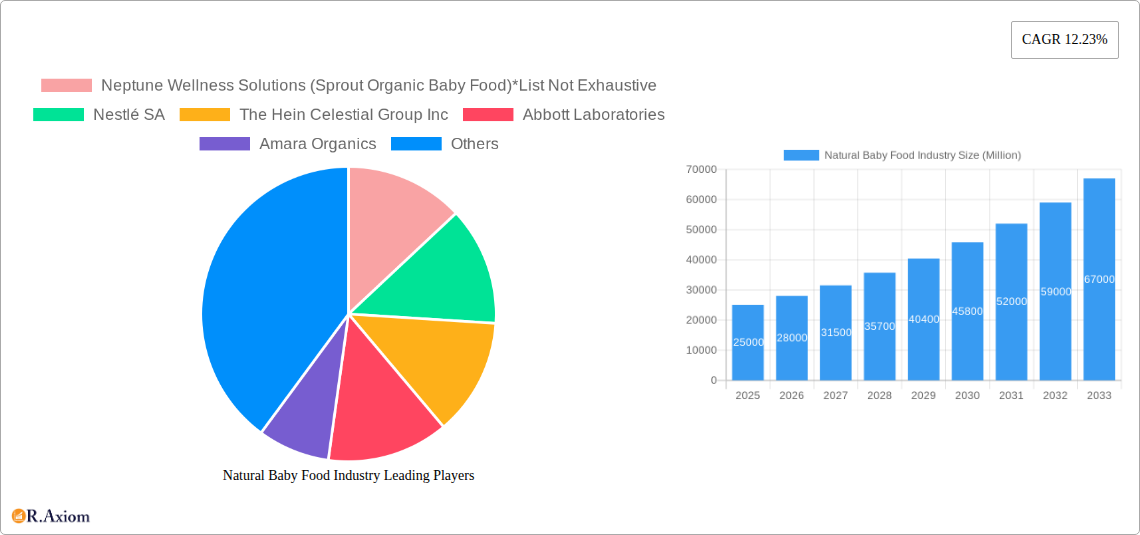
Natural Baby Food Industry Company Market Share
This report offers an in-depth analysis of the global natural baby food industry, providing actionable insights for stakeholders, investors, and market entrants. The forecast period covers 2025-2033, with a base year valuation of 8.62 billion. The report meticulously examines market trends, competitive dynamics, and emerging opportunities within this rapidly evolving sector.
Natural Baby Food Industry Market Concentration & Innovation
The natural baby food market exhibits a moderately concentrated landscape, with several multinational corporations holding significant market share alongside smaller, specialized players. Nestlé SA and Danone SA are prominent global players, commanding a considerable portion of the market. However, smaller organic brands, like Neptune Wellness Solutions (Sprout Organic Baby Food), are rapidly gaining traction due to increasing consumer demand for healthier, ethically sourced products.
Market concentration is influenced by factors such as brand recognition, distribution networks, and innovation capabilities. The industry witnesses continuous innovation driven by consumer preferences towards organic, non-GMO, and sustainably produced baby food. Stringent regulatory frameworks governing food safety and labeling influence product formulations and marketing strategies. Furthermore, the presence of substitute products, like homemade baby food, poses a competitive challenge. The industry also sees substantial M&A activity, as evidenced by recent acquisitions (detailed later in this report), driving consolidation and shaping market dynamics. For example, Sun-Maid Growers of California’s acquisition of Plum Organics in March 2021 significantly boosted its presence in the premium organic baby food segment. The average M&A deal value in the sector over the historical period (2019-2024) was approximately $XX Million, reflecting significant investment and consolidation efforts. Market share dynamics are also shaped by end-user trends, including growing awareness of the importance of nutrition and the increasing adoption of online retail channels.
Natural Baby Food Industry Industry Trends & Insights
The natural baby food industry is characterized by robust growth, driven by several key factors. The rising awareness among parents regarding the health benefits of organic and natural food for infants fuels significant market expansion. This trend is complemented by increasing disposable incomes, particularly in developing economies, allowing parents to invest in premium baby food options. The industry is witnessing significant technological disruptions, including advancements in packaging technologies (e.g., pouches and recyclable containers) enhancing product shelf life and sustainability. Consumer preferences are shifting towards convenient, ready-to-eat options and specialized products catering to dietary needs and allergies. The market exhibits intense competitive dynamics, with established players continually innovating and introducing new product lines, while smaller companies leverage niche markets and online distribution to gain market share. We project a compound annual growth rate (CAGR) of XX% during the forecast period (2025-2033), with market penetration reaching XX% by 2033.
Dominant Markets & Segments in Natural Baby Food Industry
The North American market currently dominates the global natural baby food industry, driven by high consumer awareness, strong regulatory frameworks, and a well-established distribution network. Within the product segments, prepared baby food holds the largest market share, followed by milk formula and dried baby food.
- Key Drivers for North American Dominance:
- High disposable incomes
- Strong regulatory environment promoting organic and natural products
- Well-developed retail infrastructure
- Increased consumer awareness of health and nutrition
- Type Segment Analysis: Prepared baby food benefits from convenience, while milk formula maintains a strong position due to its traditional use. Dried baby food is gaining traction for its longer shelf life and portability.
- Distribution Channel Segment Analysis: Supermarkets/hypermarkets remain the dominant distribution channel, offering wide reach and established consumer habits. However, online retail channels are experiencing rapid growth, driven by increasing e-commerce penetration and convenience for parents. Convenience stores are experiencing a small but growing segment.
Natural Baby Food Industry Product Developments
Recent product innovations focus on plant-based options, organic certifications, and sustainable packaging. Gerber’s Plant-tastic line highlights the move towards plant-based protein sources, while other companies emphasize organic ingredients and eco-friendly materials. These innovations cater to growing consumer demand for healthier and more sustainable products, offering competitive advantages through differentiated product offerings and enhanced brand positioning.
Report Scope & Segmentation Analysis
This report segments the natural baby food market based on product type (Milk Formula, Prepared Baby Food, Dried Baby Food) and distribution channel (Supermarkets/Hypermarkets, Convenience Stores, Online Retail Stores, Other Distribution Channels). Each segment's growth projections, market size, and competitive dynamics are analyzed in detail. For instance, the prepared baby food segment is anticipated to exhibit robust growth due to its convenience, while online retail channels are expected to witness rapid expansion, driven by increased e-commerce adoption. The competitive landscape within each segment varies, with some characterized by intense competition from established players, while others provide opportunities for smaller, niche brands to thrive.
Key Drivers of Natural Baby Food Industry Growth
The natural baby food industry's growth is propelled by several key factors, including rising consumer awareness of the health benefits of organic food for infants, increasing disposable incomes in developing economies, and the growing preference for convenient, ready-to-eat options. Government regulations promoting organic farming and labeling further fuel market expansion. Technological advancements in packaging and processing enhance product shelf life and sustainability, attracting environmentally conscious consumers.
Challenges in the Natural Baby Food Industry Sector
The natural baby food industry faces challenges such as stringent regulatory compliance requirements, which involve high costs and complex procedures. Supply chain vulnerabilities and fluctuations in the cost of raw materials also impact profitability. Intense competition from established and emerging players necessitates continuous innovation and effective marketing strategies to maintain market share. These challenges, if not effectively managed, can significantly impact market growth, particularly for smaller businesses.
Emerging Opportunities in Natural Baby Food Industry
Emerging opportunities include expanding into new geographical markets, particularly in developing economies with growing middle classes. There is considerable potential for innovation in product formulations to address specific dietary needs and allergies. Leveraging digital marketing channels to reach target consumers and building strong brand loyalty are crucial for success in this increasingly competitive market.
Leading Players in the Natural Baby Food Industry Market
- Neptune Wellness Solutions (Sprout Organic Baby Food)
- Nestlé SA
- The Hain Celestial Group Inc
- Abbott Laboratories
- Amara Organics
- Danone SA
- Sun-Maid Growers of California
- Hero Group
- North Castle Partners LLC
- Hipp Gmbh & Co
- Groupe Lactalis
Key Developments in Natural Baby Food Industry Industry
- April 2022: Gerber launched its Plant-tastic line, a fully organic plant-based range, certified carbon neutral by The Carbon Trust. This significantly impacts the market by introducing a major competitor in the plant-based baby food segment.
- March 2021: Sun-Maid Growers of California acquired Plum Organics, enhancing its portfolio in premium organic baby food. This acquisition signifies consolidation within the industry and strengthens Sun-Maid's market position.
- January 2021: Hero Group acquired Baby Gourmet, expanding its presence in the Canadian organic baby food market. This acquisition showcases the ongoing M&A activity driving market consolidation and expansion.
Strategic Outlook for Natural Baby Food Industry Market
The natural baby food industry is poised for continued growth, driven by evolving consumer preferences for health and convenience. Strategic investments in research and development, sustainable sourcing practices, and robust distribution networks are crucial for success. Companies focusing on innovation, brand building, and strategic partnerships will be best positioned to capitalize on the industry’s long-term growth potential.
Natural Baby Food Industry Segmentation
-
1. Type
- 1.1. Milk Formula
- 1.2. Prepared Baby Food
- 1.3. Dried Baby Food
-
2. Distribution Channel
- 2.1. Supermarkets/Hypermarkets
- 2.2. Convenience Stores
- 2.3. Online Retail Stores
- 2.4. Other Distribution Channels
Natural Baby Food Industry Segmentation By Geography
-
1. North America
- 1.1. United States
- 1.2. Canada
- 1.3. Mexico
- 1.4. Rest of North America
-
2. Europe
- 2.1. United Kingdom
- 2.2. Germany
- 2.3. France
- 2.4. Russia
- 2.5. Italy
- 2.6. Spain
- 2.7. Rest of Europe
-
3. Asia Pacific
- 3.1. India
- 3.2. China
- 3.3. Japan
- 3.4. Australia
- 3.5. Rest of Asia Pacific
-
4. South America
- 4.1. Brazil
- 4.2. Argentina
- 4.3. Rest of South America
-
5. Middle East and Africa
- 5.1. South Africa
- 5.2. Saudi Arabia
- 5.3. Rest of Middle East and Africa
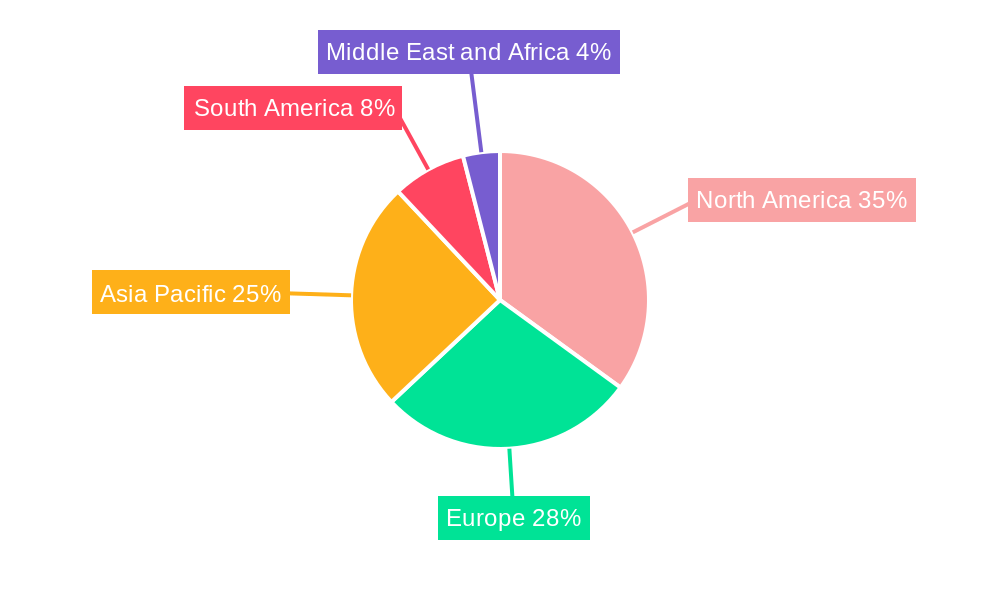
Natural Baby Food Industry Regional Market Share
Geographic Coverage of Natural Baby Food Industry
Natural Baby Food Industry REPORT HIGHLIGHTS
| Aspects | Details |
|---|---|
| Study Period | 2020-2034 |
| Base Year | 2025 |
| Estimated Year | 2026 |
| Forecast Period | 2026-2034 |
| Historical Period | 2020-2025 |
| Growth Rate | CAGR of 16.3% from 2020-2034 |
| Segmentation |
|
Table of Contents
- 1. Introduction
- 1.1. Research Scope
- 1.2. Market Segmentation
- 1.3. Research Methodology
- 1.4. Definitions and Assumptions
- 2. Executive Summary
- 2.1. Introduction
- 3. Market Dynamics
- 3.1. Introduction
- 3.2. Market Drivers
- 3.2.1. Increasing Focus on Maintaining Health and Well-Being; Launching Supplements For Specific Purposes and Targeted Population
- 3.3. Market Restrains
- 3.3.1. Supplement Consumption and Their Side-effects; Inclination Towards Substitute Products
- 3.4. Market Trends
- 3.4.1. Escalating Strategic Investments in Organic Baby Food
- 4. Market Factor Analysis
- 4.1. Porters Five Forces
- 4.2. Supply/Value Chain
- 4.3. PESTEL analysis
- 4.4. Market Entropy
- 4.5. Patent/Trademark Analysis
- 5. Global Natural Baby Food Industry Analysis, Insights and Forecast, 2020-2032
- 5.1. Market Analysis, Insights and Forecast - by Type
- 5.1.1. Milk Formula
- 5.1.2. Prepared Baby Food
- 5.1.3. Dried Baby Food
- 5.2. Market Analysis, Insights and Forecast - by Distribution Channel
- 5.2.1. Supermarkets/Hypermarkets
- 5.2.2. Convenience Stores
- 5.2.3. Online Retail Stores
- 5.2.4. Other Distribution Channels
- 5.3. Market Analysis, Insights and Forecast - by Region
- 5.3.1. North America
- 5.3.2. Europe
- 5.3.3. Asia Pacific
- 5.3.4. South America
- 5.3.5. Middle East and Africa
- 5.1. Market Analysis, Insights and Forecast - by Type
- 6. North America Natural Baby Food Industry Analysis, Insights and Forecast, 2020-2032
- 6.1. Market Analysis, Insights and Forecast - by Type
- 6.1.1. Milk Formula
- 6.1.2. Prepared Baby Food
- 6.1.3. Dried Baby Food
- 6.2. Market Analysis, Insights and Forecast - by Distribution Channel
- 6.2.1. Supermarkets/Hypermarkets
- 6.2.2. Convenience Stores
- 6.2.3. Online Retail Stores
- 6.2.4. Other Distribution Channels
- 6.1. Market Analysis, Insights and Forecast - by Type
- 7. Europe Natural Baby Food Industry Analysis, Insights and Forecast, 2020-2032
- 7.1. Market Analysis, Insights and Forecast - by Type
- 7.1.1. Milk Formula
- 7.1.2. Prepared Baby Food
- 7.1.3. Dried Baby Food
- 7.2. Market Analysis, Insights and Forecast - by Distribution Channel
- 7.2.1. Supermarkets/Hypermarkets
- 7.2.2. Convenience Stores
- 7.2.3. Online Retail Stores
- 7.2.4. Other Distribution Channels
- 7.1. Market Analysis, Insights and Forecast - by Type
- 8. Asia Pacific Natural Baby Food Industry Analysis, Insights and Forecast, 2020-2032
- 8.1. Market Analysis, Insights and Forecast - by Type
- 8.1.1. Milk Formula
- 8.1.2. Prepared Baby Food
- 8.1.3. Dried Baby Food
- 8.2. Market Analysis, Insights and Forecast - by Distribution Channel
- 8.2.1. Supermarkets/Hypermarkets
- 8.2.2. Convenience Stores
- 8.2.3. Online Retail Stores
- 8.2.4. Other Distribution Channels
- 8.1. Market Analysis, Insights and Forecast - by Type
- 9. South America Natural Baby Food Industry Analysis, Insights and Forecast, 2020-2032
- 9.1. Market Analysis, Insights and Forecast - by Type
- 9.1.1. Milk Formula
- 9.1.2. Prepared Baby Food
- 9.1.3. Dried Baby Food
- 9.2. Market Analysis, Insights and Forecast - by Distribution Channel
- 9.2.1. Supermarkets/Hypermarkets
- 9.2.2. Convenience Stores
- 9.2.3. Online Retail Stores
- 9.2.4. Other Distribution Channels
- 9.1. Market Analysis, Insights and Forecast - by Type
- 10. Middle East and Africa Natural Baby Food Industry Analysis, Insights and Forecast, 2020-2032
- 10.1. Market Analysis, Insights and Forecast - by Type
- 10.1.1. Milk Formula
- 10.1.2. Prepared Baby Food
- 10.1.3. Dried Baby Food
- 10.2. Market Analysis, Insights and Forecast - by Distribution Channel
- 10.2.1. Supermarkets/Hypermarkets
- 10.2.2. Convenience Stores
- 10.2.3. Online Retail Stores
- 10.2.4. Other Distribution Channels
- 10.1. Market Analysis, Insights and Forecast - by Type
- 11. Competitive Analysis
- 11.1. Global Market Share Analysis 2025
- 11.2. Company Profiles
- 11.2.1 Neptune Wellness Solutions (Sprout Organic Baby Food)*List Not Exhaustive
- 11.2.1.1. Overview
- 11.2.1.2. Products
- 11.2.1.3. SWOT Analysis
- 11.2.1.4. Recent Developments
- 11.2.1.5. Financials (Based on Availability)
- 11.2.2 Nestlé SA
- 11.2.2.1. Overview
- 11.2.2.2. Products
- 11.2.2.3. SWOT Analysis
- 11.2.2.4. Recent Developments
- 11.2.2.5. Financials (Based on Availability)
- 11.2.3 The Hein Celestial Group Inc
- 11.2.3.1. Overview
- 11.2.3.2. Products
- 11.2.3.3. SWOT Analysis
- 11.2.3.4. Recent Developments
- 11.2.3.5. Financials (Based on Availability)
- 11.2.4 Abbott Laboratories
- 11.2.4.1. Overview
- 11.2.4.2. Products
- 11.2.4.3. SWOT Analysis
- 11.2.4.4. Recent Developments
- 11.2.4.5. Financials (Based on Availability)
- 11.2.5 Amara Organics
- 11.2.5.1. Overview
- 11.2.5.2. Products
- 11.2.5.3. SWOT Analysis
- 11.2.5.4. Recent Developments
- 11.2.5.5. Financials (Based on Availability)
- 11.2.6 Danone SA
- 11.2.6.1. Overview
- 11.2.6.2. Products
- 11.2.6.3. SWOT Analysis
- 11.2.6.4. Recent Developments
- 11.2.6.5. Financials (Based on Availability)
- 11.2.7 Sun-Maid Growers of California
- 11.2.7.1. Overview
- 11.2.7.2. Products
- 11.2.7.3. SWOT Analysis
- 11.2.7.4. Recent Developments
- 11.2.7.5. Financials (Based on Availability)
- 11.2.8 Hero Group
- 11.2.8.1. Overview
- 11.2.8.2. Products
- 11.2.8.3. SWOT Analysis
- 11.2.8.4. Recent Developments
- 11.2.8.5. Financials (Based on Availability)
- 11.2.9 North Castle Partners LLC
- 11.2.9.1. Overview
- 11.2.9.2. Products
- 11.2.9.3. SWOT Analysis
- 11.2.9.4. Recent Developments
- 11.2.9.5. Financials (Based on Availability)
- 11.2.10 Hipp Gmbh & Co
- 11.2.10.1. Overview
- 11.2.10.2. Products
- 11.2.10.3. SWOT Analysis
- 11.2.10.4. Recent Developments
- 11.2.10.5. Financials (Based on Availability)
- 11.2.11 Groupe Lactalis
- 11.2.11.1. Overview
- 11.2.11.2. Products
- 11.2.11.3. SWOT Analysis
- 11.2.11.4. Recent Developments
- 11.2.11.5. Financials (Based on Availability)
- 11.2.1 Neptune Wellness Solutions (Sprout Organic Baby Food)*List Not Exhaustive
List of Figures
- Figure 1: Global Natural Baby Food Industry Revenue Breakdown (billion, %) by Region 2025 & 2033
- Figure 2: Global Natural Baby Food Industry Volume Breakdown (K Units , %) by Region 2025 & 2033
- Figure 3: North America Natural Baby Food Industry Revenue (billion), by Type 2025 & 2033
- Figure 4: North America Natural Baby Food Industry Volume (K Units ), by Type 2025 & 2033
- Figure 5: North America Natural Baby Food Industry Revenue Share (%), by Type 2025 & 2033
- Figure 6: North America Natural Baby Food Industry Volume Share (%), by Type 2025 & 2033
- Figure 7: North America Natural Baby Food Industry Revenue (billion), by Distribution Channel 2025 & 2033
- Figure 8: North America Natural Baby Food Industry Volume (K Units ), by Distribution Channel 2025 & 2033
- Figure 9: North America Natural Baby Food Industry Revenue Share (%), by Distribution Channel 2025 & 2033
- Figure 10: North America Natural Baby Food Industry Volume Share (%), by Distribution Channel 2025 & 2033
- Figure 11: North America Natural Baby Food Industry Revenue (billion), by Country 2025 & 2033
- Figure 12: North America Natural Baby Food Industry Volume (K Units ), by Country 2025 & 2033
- Figure 13: North America Natural Baby Food Industry Revenue Share (%), by Country 2025 & 2033
- Figure 14: North America Natural Baby Food Industry Volume Share (%), by Country 2025 & 2033
- Figure 15: Europe Natural Baby Food Industry Revenue (billion), by Type 2025 & 2033
- Figure 16: Europe Natural Baby Food Industry Volume (K Units ), by Type 2025 & 2033
- Figure 17: Europe Natural Baby Food Industry Revenue Share (%), by Type 2025 & 2033
- Figure 18: Europe Natural Baby Food Industry Volume Share (%), by Type 2025 & 2033
- Figure 19: Europe Natural Baby Food Industry Revenue (billion), by Distribution Channel 2025 & 2033
- Figure 20: Europe Natural Baby Food Industry Volume (K Units ), by Distribution Channel 2025 & 2033
- Figure 21: Europe Natural Baby Food Industry Revenue Share (%), by Distribution Channel 2025 & 2033
- Figure 22: Europe Natural Baby Food Industry Volume Share (%), by Distribution Channel 2025 & 2033
- Figure 23: Europe Natural Baby Food Industry Revenue (billion), by Country 2025 & 2033
- Figure 24: Europe Natural Baby Food Industry Volume (K Units ), by Country 2025 & 2033
- Figure 25: Europe Natural Baby Food Industry Revenue Share (%), by Country 2025 & 2033
- Figure 26: Europe Natural Baby Food Industry Volume Share (%), by Country 2025 & 2033
- Figure 27: Asia Pacific Natural Baby Food Industry Revenue (billion), by Type 2025 & 2033
- Figure 28: Asia Pacific Natural Baby Food Industry Volume (K Units ), by Type 2025 & 2033
- Figure 29: Asia Pacific Natural Baby Food Industry Revenue Share (%), by Type 2025 & 2033
- Figure 30: Asia Pacific Natural Baby Food Industry Volume Share (%), by Type 2025 & 2033
- Figure 31: Asia Pacific Natural Baby Food Industry Revenue (billion), by Distribution Channel 2025 & 2033
- Figure 32: Asia Pacific Natural Baby Food Industry Volume (K Units ), by Distribution Channel 2025 & 2033
- Figure 33: Asia Pacific Natural Baby Food Industry Revenue Share (%), by Distribution Channel 2025 & 2033
- Figure 34: Asia Pacific Natural Baby Food Industry Volume Share (%), by Distribution Channel 2025 & 2033
- Figure 35: Asia Pacific Natural Baby Food Industry Revenue (billion), by Country 2025 & 2033
- Figure 36: Asia Pacific Natural Baby Food Industry Volume (K Units ), by Country 2025 & 2033
- Figure 37: Asia Pacific Natural Baby Food Industry Revenue Share (%), by Country 2025 & 2033
- Figure 38: Asia Pacific Natural Baby Food Industry Volume Share (%), by Country 2025 & 2033
- Figure 39: South America Natural Baby Food Industry Revenue (billion), by Type 2025 & 2033
- Figure 40: South America Natural Baby Food Industry Volume (K Units ), by Type 2025 & 2033
- Figure 41: South America Natural Baby Food Industry Revenue Share (%), by Type 2025 & 2033
- Figure 42: South America Natural Baby Food Industry Volume Share (%), by Type 2025 & 2033
- Figure 43: South America Natural Baby Food Industry Revenue (billion), by Distribution Channel 2025 & 2033
- Figure 44: South America Natural Baby Food Industry Volume (K Units ), by Distribution Channel 2025 & 2033
- Figure 45: South America Natural Baby Food Industry Revenue Share (%), by Distribution Channel 2025 & 2033
- Figure 46: South America Natural Baby Food Industry Volume Share (%), by Distribution Channel 2025 & 2033
- Figure 47: South America Natural Baby Food Industry Revenue (billion), by Country 2025 & 2033
- Figure 48: South America Natural Baby Food Industry Volume (K Units ), by Country 2025 & 2033
- Figure 49: South America Natural Baby Food Industry Revenue Share (%), by Country 2025 & 2033
- Figure 50: South America Natural Baby Food Industry Volume Share (%), by Country 2025 & 2033
- Figure 51: Middle East and Africa Natural Baby Food Industry Revenue (billion), by Type 2025 & 2033
- Figure 52: Middle East and Africa Natural Baby Food Industry Volume (K Units ), by Type 2025 & 2033
- Figure 53: Middle East and Africa Natural Baby Food Industry Revenue Share (%), by Type 2025 & 2033
- Figure 54: Middle East and Africa Natural Baby Food Industry Volume Share (%), by Type 2025 & 2033
- Figure 55: Middle East and Africa Natural Baby Food Industry Revenue (billion), by Distribution Channel 2025 & 2033
- Figure 56: Middle East and Africa Natural Baby Food Industry Volume (K Units ), by Distribution Channel 2025 & 2033
- Figure 57: Middle East and Africa Natural Baby Food Industry Revenue Share (%), by Distribution Channel 2025 & 2033
- Figure 58: Middle East and Africa Natural Baby Food Industry Volume Share (%), by Distribution Channel 2025 & 2033
- Figure 59: Middle East and Africa Natural Baby Food Industry Revenue (billion), by Country 2025 & 2033
- Figure 60: Middle East and Africa Natural Baby Food Industry Volume (K Units ), by Country 2025 & 2033
- Figure 61: Middle East and Africa Natural Baby Food Industry Revenue Share (%), by Country 2025 & 2033
- Figure 62: Middle East and Africa Natural Baby Food Industry Volume Share (%), by Country 2025 & 2033
List of Tables
- Table 1: Global Natural Baby Food Industry Revenue billion Forecast, by Type 2020 & 2033
- Table 2: Global Natural Baby Food Industry Volume K Units Forecast, by Type 2020 & 2033
- Table 3: Global Natural Baby Food Industry Revenue billion Forecast, by Distribution Channel 2020 & 2033
- Table 4: Global Natural Baby Food Industry Volume K Units Forecast, by Distribution Channel 2020 & 2033
- Table 5: Global Natural Baby Food Industry Revenue billion Forecast, by Region 2020 & 2033
- Table 6: Global Natural Baby Food Industry Volume K Units Forecast, by Region 2020 & 2033
- Table 7: Global Natural Baby Food Industry Revenue billion Forecast, by Type 2020 & 2033
- Table 8: Global Natural Baby Food Industry Volume K Units Forecast, by Type 2020 & 2033
- Table 9: Global Natural Baby Food Industry Revenue billion Forecast, by Distribution Channel 2020 & 2033
- Table 10: Global Natural Baby Food Industry Volume K Units Forecast, by Distribution Channel 2020 & 2033
- Table 11: Global Natural Baby Food Industry Revenue billion Forecast, by Country 2020 & 2033
- Table 12: Global Natural Baby Food Industry Volume K Units Forecast, by Country 2020 & 2033
- Table 13: United States Natural Baby Food Industry Revenue (billion) Forecast, by Application 2020 & 2033
- Table 14: United States Natural Baby Food Industry Volume (K Units ) Forecast, by Application 2020 & 2033
- Table 15: Canada Natural Baby Food Industry Revenue (billion) Forecast, by Application 2020 & 2033
- Table 16: Canada Natural Baby Food Industry Volume (K Units ) Forecast, by Application 2020 & 2033
- Table 17: Mexico Natural Baby Food Industry Revenue (billion) Forecast, by Application 2020 & 2033
- Table 18: Mexico Natural Baby Food Industry Volume (K Units ) Forecast, by Application 2020 & 2033
- Table 19: Rest of North America Natural Baby Food Industry Revenue (billion) Forecast, by Application 2020 & 2033
- Table 20: Rest of North America Natural Baby Food Industry Volume (K Units ) Forecast, by Application 2020 & 2033
- Table 21: Global Natural Baby Food Industry Revenue billion Forecast, by Type 2020 & 2033
- Table 22: Global Natural Baby Food Industry Volume K Units Forecast, by Type 2020 & 2033
- Table 23: Global Natural Baby Food Industry Revenue billion Forecast, by Distribution Channel 2020 & 2033
- Table 24: Global Natural Baby Food Industry Volume K Units Forecast, by Distribution Channel 2020 & 2033
- Table 25: Global Natural Baby Food Industry Revenue billion Forecast, by Country 2020 & 2033
- Table 26: Global Natural Baby Food Industry Volume K Units Forecast, by Country 2020 & 2033
- Table 27: United Kingdom Natural Baby Food Industry Revenue (billion) Forecast, by Application 2020 & 2033
- Table 28: United Kingdom Natural Baby Food Industry Volume (K Units ) Forecast, by Application 2020 & 2033
- Table 29: Germany Natural Baby Food Industry Revenue (billion) Forecast, by Application 2020 & 2033
- Table 30: Germany Natural Baby Food Industry Volume (K Units ) Forecast, by Application 2020 & 2033
- Table 31: France Natural Baby Food Industry Revenue (billion) Forecast, by Application 2020 & 2033
- Table 32: France Natural Baby Food Industry Volume (K Units ) Forecast, by Application 2020 & 2033
- Table 33: Russia Natural Baby Food Industry Revenue (billion) Forecast, by Application 2020 & 2033
- Table 34: Russia Natural Baby Food Industry Volume (K Units ) Forecast, by Application 2020 & 2033
- Table 35: Italy Natural Baby Food Industry Revenue (billion) Forecast, by Application 2020 & 2033
- Table 36: Italy Natural Baby Food Industry Volume (K Units ) Forecast, by Application 2020 & 2033
- Table 37: Spain Natural Baby Food Industry Revenue (billion) Forecast, by Application 2020 & 2033
- Table 38: Spain Natural Baby Food Industry Volume (K Units ) Forecast, by Application 2020 & 2033
- Table 39: Rest of Europe Natural Baby Food Industry Revenue (billion) Forecast, by Application 2020 & 2033
- Table 40: Rest of Europe Natural Baby Food Industry Volume (K Units ) Forecast, by Application 2020 & 2033
- Table 41: Global Natural Baby Food Industry Revenue billion Forecast, by Type 2020 & 2033
- Table 42: Global Natural Baby Food Industry Volume K Units Forecast, by Type 2020 & 2033
- Table 43: Global Natural Baby Food Industry Revenue billion Forecast, by Distribution Channel 2020 & 2033
- Table 44: Global Natural Baby Food Industry Volume K Units Forecast, by Distribution Channel 2020 & 2033
- Table 45: Global Natural Baby Food Industry Revenue billion Forecast, by Country 2020 & 2033
- Table 46: Global Natural Baby Food Industry Volume K Units Forecast, by Country 2020 & 2033
- Table 47: India Natural Baby Food Industry Revenue (billion) Forecast, by Application 2020 & 2033
- Table 48: India Natural Baby Food Industry Volume (K Units ) Forecast, by Application 2020 & 2033
- Table 49: China Natural Baby Food Industry Revenue (billion) Forecast, by Application 2020 & 2033
- Table 50: China Natural Baby Food Industry Volume (K Units ) Forecast, by Application 2020 & 2033
- Table 51: Japan Natural Baby Food Industry Revenue (billion) Forecast, by Application 2020 & 2033
- Table 52: Japan Natural Baby Food Industry Volume (K Units ) Forecast, by Application 2020 & 2033
- Table 53: Australia Natural Baby Food Industry Revenue (billion) Forecast, by Application 2020 & 2033
- Table 54: Australia Natural Baby Food Industry Volume (K Units ) Forecast, by Application 2020 & 2033
- Table 55: Rest of Asia Pacific Natural Baby Food Industry Revenue (billion) Forecast, by Application 2020 & 2033
- Table 56: Rest of Asia Pacific Natural Baby Food Industry Volume (K Units ) Forecast, by Application 2020 & 2033
- Table 57: Global Natural Baby Food Industry Revenue billion Forecast, by Type 2020 & 2033
- Table 58: Global Natural Baby Food Industry Volume K Units Forecast, by Type 2020 & 2033
- Table 59: Global Natural Baby Food Industry Revenue billion Forecast, by Distribution Channel 2020 & 2033
- Table 60: Global Natural Baby Food Industry Volume K Units Forecast, by Distribution Channel 2020 & 2033
- Table 61: Global Natural Baby Food Industry Revenue billion Forecast, by Country 2020 & 2033
- Table 62: Global Natural Baby Food Industry Volume K Units Forecast, by Country 2020 & 2033
- Table 63: Brazil Natural Baby Food Industry Revenue (billion) Forecast, by Application 2020 & 2033
- Table 64: Brazil Natural Baby Food Industry Volume (K Units ) Forecast, by Application 2020 & 2033
- Table 65: Argentina Natural Baby Food Industry Revenue (billion) Forecast, by Application 2020 & 2033
- Table 66: Argentina Natural Baby Food Industry Volume (K Units ) Forecast, by Application 2020 & 2033
- Table 67: Rest of South America Natural Baby Food Industry Revenue (billion) Forecast, by Application 2020 & 2033
- Table 68: Rest of South America Natural Baby Food Industry Volume (K Units ) Forecast, by Application 2020 & 2033
- Table 69: Global Natural Baby Food Industry Revenue billion Forecast, by Type 2020 & 2033
- Table 70: Global Natural Baby Food Industry Volume K Units Forecast, by Type 2020 & 2033
- Table 71: Global Natural Baby Food Industry Revenue billion Forecast, by Distribution Channel 2020 & 2033
- Table 72: Global Natural Baby Food Industry Volume K Units Forecast, by Distribution Channel 2020 & 2033
- Table 73: Global Natural Baby Food Industry Revenue billion Forecast, by Country 2020 & 2033
- Table 74: Global Natural Baby Food Industry Volume K Units Forecast, by Country 2020 & 2033
- Table 75: South Africa Natural Baby Food Industry Revenue (billion) Forecast, by Application 2020 & 2033
- Table 76: South Africa Natural Baby Food Industry Volume (K Units ) Forecast, by Application 2020 & 2033
- Table 77: Saudi Arabia Natural Baby Food Industry Revenue (billion) Forecast, by Application 2020 & 2033
- Table 78: Saudi Arabia Natural Baby Food Industry Volume (K Units ) Forecast, by Application 2020 & 2033
- Table 79: Rest of Middle East and Africa Natural Baby Food Industry Revenue (billion) Forecast, by Application 2020 & 2033
- Table 80: Rest of Middle East and Africa Natural Baby Food Industry Volume (K Units ) Forecast, by Application 2020 & 2033
Frequently Asked Questions
1. What is the projected Compound Annual Growth Rate (CAGR) of the Natural Baby Food Industry?
The projected CAGR is approximately 16.3%.
2. Which companies are prominent players in the Natural Baby Food Industry?
Key companies in the market include Neptune Wellness Solutions (Sprout Organic Baby Food)*List Not Exhaustive, Nestlé SA, The Hein Celestial Group Inc, Abbott Laboratories, Amara Organics, Danone SA, Sun-Maid Growers of California, Hero Group, North Castle Partners LLC, Hipp Gmbh & Co, Groupe Lactalis.
3. What are the main segments of the Natural Baby Food Industry?
The market segments include Type, Distribution Channel.
4. Can you provide details about the market size?
The market size is estimated to be USD 8.62 billion as of 2022.
5. What are some drivers contributing to market growth?
Increasing Focus on Maintaining Health and Well-Being; Launching Supplements For Specific Purposes and Targeted Population.
6. What are the notable trends driving market growth?
Escalating Strategic Investments in Organic Baby Food.
7. Are there any restraints impacting market growth?
Supplement Consumption and Their Side-effects; Inclination Towards Substitute Products.
8. Can you provide examples of recent developments in the market?
April 2022: Gerber introduced an entirely organic plant-based line. A variety of organic pouches, snacks, and meals called Plant-tastic are manufactured solely from plant protein sources. The action follows Gerber's announcement in 2021 that it would work to produce more eco-friendly products. The Carbon Trust has certified Plant-tastic as carbon neutral.
9. What pricing options are available for accessing the report?
Pricing options include single-user, multi-user, and enterprise licenses priced at USD 4750, USD 5250, and USD 8750 respectively.
10. Is the market size provided in terms of value or volume?
The market size is provided in terms of value, measured in billion and volume, measured in K Units .
11. Are there any specific market keywords associated with the report?
Yes, the market keyword associated with the report is "Natural Baby Food Industry," which aids in identifying and referencing the specific market segment covered.
12. How do I determine which pricing option suits my needs best?
The pricing options vary based on user requirements and access needs. Individual users may opt for single-user licenses, while businesses requiring broader access may choose multi-user or enterprise licenses for cost-effective access to the report.
13. Are there any additional resources or data provided in the Natural Baby Food Industry report?
While the report offers comprehensive insights, it's advisable to review the specific contents or supplementary materials provided to ascertain if additional resources or data are available.
14. How can I stay updated on further developments or reports in the Natural Baby Food Industry?
To stay informed about further developments, trends, and reports in the Natural Baby Food Industry, consider subscribing to industry newsletters, following relevant companies and organizations, or regularly checking reputable industry news sources and publications.
Methodology
Step 1 - Identification of Relevant Samples Size from Population Database


Step 2 - Approaches for Defining Global Market Size (Value, Volume* & Price*)

Note*: In applicable scenarios
Step 3 - Data Sources
Primary Research
- Web Analytics
- Survey Reports
- Research Institute
- Latest Research Reports
- Opinion Leaders
Secondary Research
- Annual Reports
- White Paper
- Latest Press Release
- Industry Association
- Paid Database
- Investor Presentations

Step 4 - Data Triangulation
Involves using different sources of information in order to increase the validity of a study
These sources are likely to be stakeholders in a program - participants, other researchers, program staff, other community members, and so on.
Then we put all data in single framework & apply various statistical tools to find out the dynamic on the market.
During the analysis stage, feedback from the stakeholder groups would be compared to determine areas of agreement as well as areas of divergence