
Key Insights
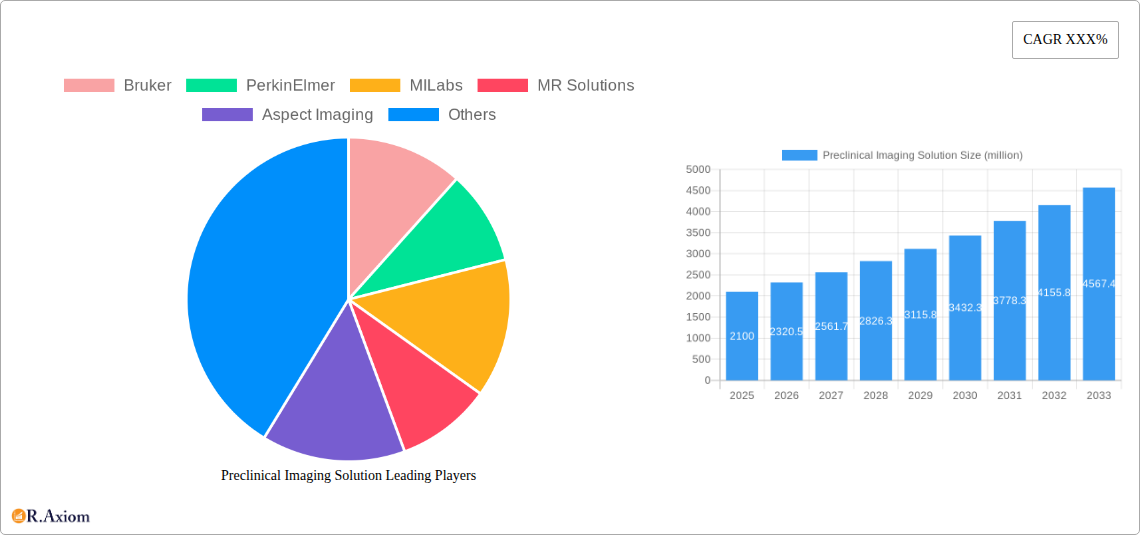
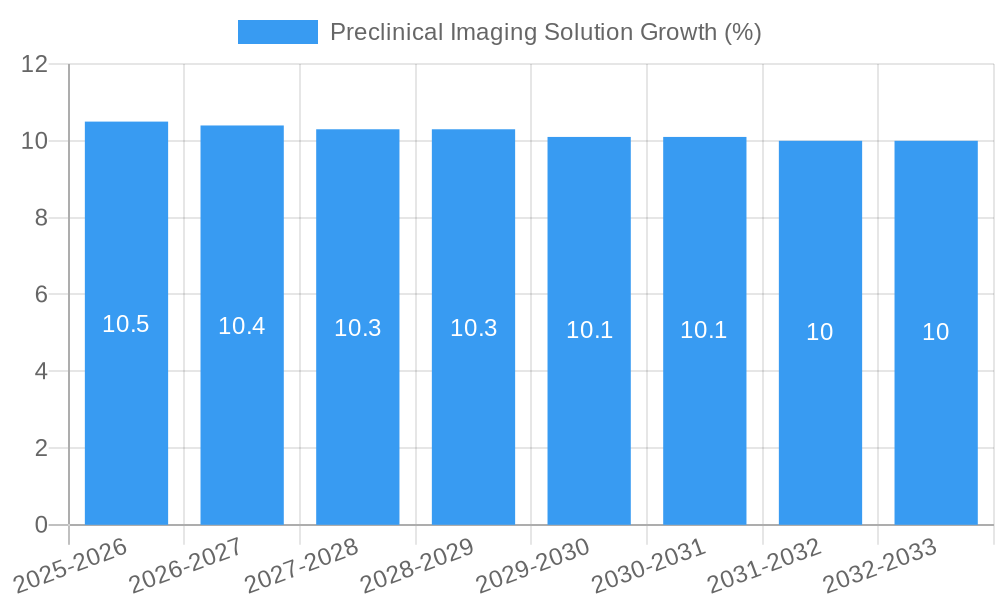
The preclinical imaging solutions market is poised for robust growth, driven by the increasing demand for advanced diagnostic tools in drug discovery and development, as well as a growing emphasis on personalized medicine. With an estimated market size of approximately USD 2,100 million in 2025, the sector is projected to expand at a Compound Annual Growth Rate (CAGR) of roughly 10.5% through 2033. This significant expansion is fueled by key drivers such as the continuous innovation in imaging technologies, the rising incidence of chronic diseases necessitating extensive research, and substantial investments in R&D by pharmaceutical and biotechnology companies. The growing need for non-invasive imaging techniques for disease diagnosis and treatment monitoring in preclinical studies further bolsters market expansion. The market is segmented by application, with Hospitals and Diagnostic Centers expected to dominate due to their critical role in research and development.
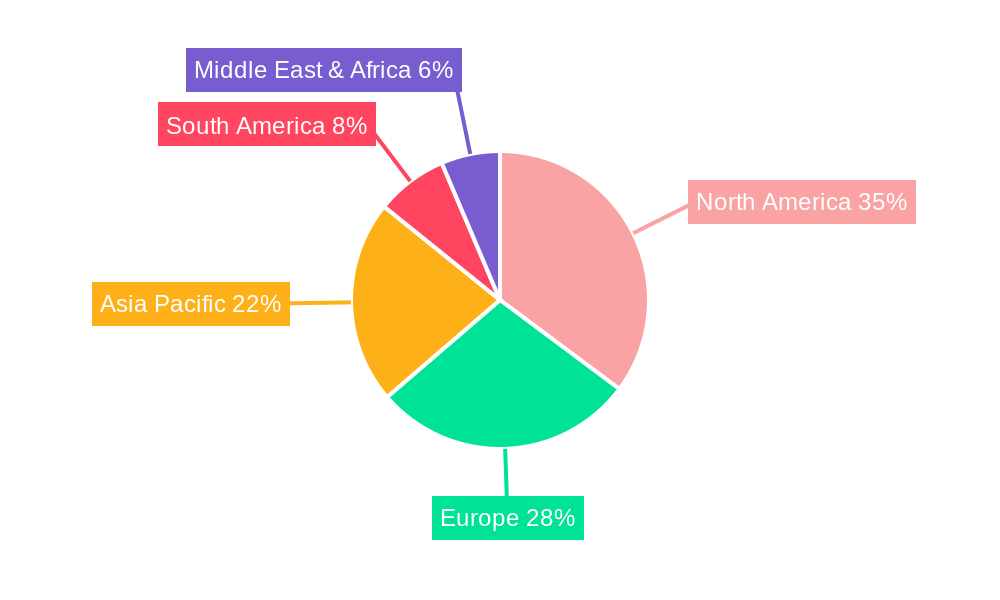
The market is experiencing dynamic trends, including the integration of artificial intelligence (AI) and machine learning (ML) for enhanced image analysis and interpretation, the miniaturization of imaging devices for improved portability and accessibility, and the increasing adoption of hybrid imaging systems that combine the strengths of different modalities. While growth is strong, potential restraints include the high cost of advanced imaging equipment and the stringent regulatory landscape governing preclinical research. However, these challenges are being mitigated by technological advancements that are leading to cost efficiencies and the development of more streamlined regulatory pathways. Geographically, North America is anticipated to lead the market, followed closely by Europe and the Asia Pacific region, owing to substantial healthcare spending and a strong presence of leading research institutions and pharmaceutical giants.
Preclinical Imaging Solution Market: Comprehensive Analysis and Future Outlook (2019-2033)
This in-depth report provides a comprehensive analysis of the global preclinical imaging solution market, offering strategic insights for stakeholders navigating this dynamic landscape. Covering the historical period from 2019 to 2024, the base year of 2025, and projecting growth through 2033, this report delves into market concentration, technological innovations, regulatory frameworks, competitive dynamics, and emerging opportunities. We analyze key segments including Magnetic Resonance Imaging (MRI), Computed Tomography (CT), Positron Emission Tomography (PET), and Single-Photon Emission Computed Tomography (SPECT), as well as application areas such as Hospitals, Diagnostic Centers, and Laboratories. With an estimated market size of X million in 2025 and a projected compound annual growth rate (CAGR) of X% during the forecast period, this report is an indispensable resource for understanding market penetration and future potential.
Preclinical Imaging Solution Market Concentration & Innovation
The preclinical imaging solution market is characterized by a moderate level of concentration, with a few key players holding significant market share, while numerous smaller companies compete in niche areas. Innovation is primarily driven by advancements in imaging hardware, software development for enhanced image analysis and AI integration, and the growing demand for multimodal imaging solutions. Regulatory frameworks, such as those set by the FDA and EMA, play a crucial role in product approval and market entry, influencing the pace of innovation and the cost of compliance. Product substitutes, including advanced microscopy techniques and in-vitro assays, pose a competitive challenge, but the superior in-vivo information provided by preclinical imaging solutions ensures their continued relevance. End-user trends indicate a growing preference for higher resolution, faster acquisition times, and user-friendly interfaces. Mergers and acquisitions (M&A) activities are moderately prevalent, with deal values ranging from XX million to XX million, as larger companies seek to expand their portfolios and technological capabilities.
Preclinical Imaging Solution Industry Trends & Insights
The preclinical imaging solution industry is experiencing robust growth, fueled by escalating investments in drug discovery and development, the burgeoning field of personalized medicine, and the increasing complexity of research into chronic diseases like cancer, neurological disorders, and cardiovascular conditions. The estimated market size for preclinical imaging solutions in 2025 is projected to be X million, with an anticipated CAGR of X% during the forecast period of 2025–2033. Technological disruptions are at the forefront, with the integration of artificial intelligence (AI) and machine learning (ML) revolutionizing image analysis, enabling faster and more accurate interpretation of complex biological data. Furthermore, the development of more compact, cost-effective, and multimodal imaging systems, such as combined PET-MRI and PET-CT scanners, is expanding market penetration beyond traditional research institutions. Consumer preferences are shifting towards solutions offering higher spatial and temporal resolution, improved sensitivity, and reduced radiation exposure for animal models, aligning with ethical research practices. Competitive dynamics are intensifying, with companies vying for market leadership through continuous product innovation, strategic partnerships, and expanding their global reach. The rising prevalence of infectious diseases and the urgent need for novel therapeutic interventions also contribute significantly to market expansion, underscoring the critical role of preclinical imaging in the early stages of drug development. The adoption of advanced imaging modalities is crucial for understanding disease mechanisms and evaluating treatment efficacy at the preclinical stage, thereby accelerating the journey from laboratory to clinical application.
Dominant Markets & Segments in Preclinical Imaging Solution
The preclinical imaging solution market exhibits significant regional and segmental dominance, with North America currently leading in market share, driven by substantial government and private funding for biomedical research and a well-established ecosystem of pharmaceutical and biotechnology companies. Within North America, the United States stands out as the dominant country, supported by robust healthcare infrastructure and a high concentration of leading research institutions and contract research organizations (CROs).
Key Drivers for Dominance:
- Economic Policies: Favorable government grants, tax incentives for research and development, and robust intellectual property protection laws.
- Infrastructure: Advanced research facilities, well-equipped laboratories, and a strong network of academic-industry collaborations.
- Technological Adoption: Early and widespread adoption of cutting-edge imaging technologies and a skilled workforce capable of operating and interpreting results from these sophisticated systems.
Segmental Dominance:
- Application: The Laboratory segment holds the largest market share, as it is the primary environment for preclinical research and drug development. This is closely followed by Others, encompassing CROs and academic research centers. Hospitals are increasingly adopting preclinical imaging for specialized research, while Diagnostic Centers are gradually integrating these solutions for advanced translational research.
- Type: Magnetic Resonance Imaging (MRI) dominates the market due to its superior soft-tissue contrast and ability to provide functional and metabolic information without ionizing radiation. Computed Tomography (CT) follows, offering excellent anatomical detail and speed. Positron Emission Tomography (PET) is crucial for molecular imaging and tracking biological processes, while Single-Photon Emission Computed Tomography (SPECT) offers complementary functional imaging capabilities. The Others category, including hybrid imaging systems and emerging modalities, is also gaining traction. The increasing demand for multimodal imaging systems, such as PET-MRI, is a significant trend, allowing for simultaneous acquisition of anatomical and functional data, thereby enhancing diagnostic accuracy and research insights. The continued evolution of detector technologies and radiotracer development further fuels the growth of PET and SPECT segments.
Preclinical Imaging Solution Product Developments
Product developments in the preclinical imaging solution market are primarily focused on enhancing image resolution, accelerating scan times, and integrating multimodal imaging capabilities. Innovations in detector technology, such as solid-state detectors for CT and higher sensitivity detectors for PET and SPECT, are enabling researchers to visualize finer anatomical structures and track biological processes with greater precision. The integration of AI and machine learning algorithms into imaging software is revolutionizing data analysis, automating tasks, and providing deeper insights into complex biological phenomena. Companies are also focusing on developing more compact and cost-effective imaging systems, making advanced preclinical imaging accessible to a wider range of research institutions. These advancements are crucial for supporting the development of novel therapeutics for challenging diseases.
Report Scope & Segmentation Analysis
This report provides a detailed segmentation of the global preclinical imaging solution market. The Application segments include Hospitals, Diagnostic Centers, Laboratories, and Others (including CROs and academic institutions). The Type segments encompass Magnetic Resonance Imaging (MRI), Computed Tomography (CT), Positron Emission Tomography (PET), Single-Photon Emission Computed Tomography (SPECT), and Others (e.g., hybrid systems, optical imaging).
- Laboratories: This segment, expected to reach XX million by 2033, is the largest contributor, driven by extensive drug discovery and development activities. Its market penetration is high due to the inherent need for in-vivo validation of therapeutic candidates.
- Hospitals: While currently a smaller segment, it is projected to grow at a CAGR of X%, reaching XX million by 2033, as academic medical centers increasingly utilize these tools for translational research and understanding disease mechanisms.
- Diagnostic Centers: This segment is anticipated to grow steadily at a CAGR of X%, reaching XX million by 2033, with increasing interest in leveraging preclinical insights for diagnostic advancements.
- Others: This diverse segment, including CROs and academic institutions, is projected to reach XX million by 2033, demonstrating a CAGR of X%, fueled by outsourcing trends and academic research initiatives.
- MRI: Expected to dominate the market, reaching XX million by 2033 with a CAGR of X%, owing to its non-ionizing nature and excellent soft-tissue contrast.
- CT: Projected to grow at a CAGR of X%, reaching XX million by 2033, driven by its speed and anatomical resolution.
- PET: Forecasted to grow at a robust CAGR of X%, reaching XX million by 2033, due to its essential role in molecular imaging.
- SPECT: Expected to grow at a CAGR of X%, reaching XX million by 2033, offering complementary functional imaging data.
- Others: This segment, including hybrid imaging, is predicted to expand significantly, reaching XX million by 2033 with a CAGR of X%, reflecting the trend towards multimodal imaging solutions.
Key Drivers of Preclinical Imaging Solution Growth
The preclinical imaging solution market is propelled by several key drivers. Firstly, the escalating investment in pharmaceutical R&D, particularly in areas like oncology, neurology, and infectious diseases, necessitates advanced imaging tools for drug discovery and efficacy testing. Secondly, the growing adoption of personalized medicine approaches requires precise preclinical models to understand individual patient responses to treatments, thus driving demand for high-resolution imaging. Thirdly, technological advancements, including the integration of AI for image analysis and the development of multimodal imaging systems (e.g., PET-MRI), enhance the utility and accuracy of preclinical studies. Fourthly, an increasing number of contract research organizations (CROs) are expanding their preclinical imaging capabilities to cater to the growing outsourcing trend from pharmaceutical and biotechnology companies. Finally, favorable government initiatives and funding for biomedical research further stimulate market growth.
Challenges in the Preclinical Imaging Solution Sector
Despite the robust growth, the preclinical imaging solution sector faces several challenges. High acquisition and maintenance costs of advanced imaging equipment can be a significant barrier for smaller research institutions and emerging markets. Stringent regulatory hurdles for drug approval processes, while essential, can prolong the preclinical testing phases, impacting market timelines. The complexity of advanced imaging techniques requires specialized expertise for operation and data interpretation, leading to a demand for skilled personnel. Furthermore, ethical considerations and the increasing scrutiny on animal welfare in research necessitate the development of more refined and less invasive imaging protocols, which can add to development costs and complexity. Supply chain disruptions for specialized components and consumables can also pose intermittent challenges.
Emerging Opportunities in Preclinical Imaging Solution
Emerging opportunities in the preclinical imaging solution market are abundant. The growing field of immuno-oncology and the development of cell and gene therapies are creating a substantial demand for advanced imaging to track the efficacy and biodistribution of these novel treatments. The expansion of AI and machine learning in image analysis presents an opportunity for developing automated, more efficient, and insightful data interpretation platforms. The increasing focus on rare diseases and neglected tropical diseases is also driving research, necessitating specialized preclinical imaging solutions. Furthermore, the growing adoption of PET and SPECT imaging for studying neurodegenerative diseases and metabolic disorders, coupled with advancements in radiotracer development, presents significant growth potential. The expansion of preclinical imaging services into emerging economies, driven by increasing healthcare investments and a growing research base, also represents a key opportunity.
Leading Players in the Preclinical Imaging Solution Market
- Bruker
- PerkinElmer
- MILabs
- MR Solutions
- Aspect Imaging
- Mediso
- Fujifilm
- Siemens Healthineers
- TriFoil Imaging
- Miltenyi Biotec
- LI-COR Biosciences
- Biospace Lab
- Inviscan
- Charles River
- Minerva Imaging
Key Developments in Preclinical Imaging Solution Industry
- 2023: MILabs launched a new generation of versatile ultra-high-field preclinical MRI systems, enhancing resolution and acquisition speed.
- 2023: Siemens Healthineers introduced advanced AI-powered software for PET image reconstruction, improving diagnostic accuracy and reducing scan times.
- 2024: PerkinElmer acquired a leading provider of multiplex imaging solutions, expanding its portfolio for advanced preclinical analysis.
- 2024: MR Solutions announced a partnership to develop novel superconducting magnet technology for smaller, more accessible preclinical MRI scanners.
- 2024: Mediso unveiled an integrated PET/CT system designed for enhanced throughput and multimodal research capabilities.
- 2024: LI-COR Biosciences expanded its fluorescence imaging capabilities with new probes and instrumentation for in-vivo studies.
- 2025: Bruker introduced a next-generation PET-MRI system offering unparalleled anatomical and functional imaging integration.
- 2025: Fujifilm showcased its latest advancements in digital radiography for preclinical imaging, emphasizing improved image quality and reduced radiation dose.
Strategic Outlook for Preclinical Imaging Solution Market
The strategic outlook for the preclinical imaging solution market remains exceptionally positive, driven by sustained demand from the pharmaceutical and biotechnology industries for drug discovery and development. The increasing focus on complex diseases, coupled with the relentless pace of technological innovation, will continue to fuel market expansion. Companies that invest in developing multimodal imaging solutions, integrating AI and machine learning for enhanced data analysis, and offering more cost-effective and user-friendly systems will be well-positioned for growth. Strategic collaborations, mergers, and acquisitions will likely continue as key players aim to consolidate their market presence and expand their technological offerings. The emerging markets and the growing demand for specialized imaging in areas like immuno-oncology and cell therapy present significant avenues for future growth and market penetration.
Preclinical Imaging Solution Segmentation
-
1. Application
- 1.1. Hospital
- 1.2. Diagnostic Center
- 1.3. Laboratory
- 1.4. Others
-
2. Type
- 2.1. Magnetic Resonance Imaging (MRI)
- 2.2. Computed Tomography (CT)
- 2.3. Positron Emission Tomography (PET)
- 2.4. Single-Photon Emission Computed Tomography (SPECT)
- 2.5. Others
Preclinical Imaging Solution Segmentation By Geography
-
1. North America
- 1.1. United States
- 1.2. Canada
- 1.3. Mexico
-
2. South America
- 2.1. Brazil
- 2.2. Argentina
- 2.3. Rest of South America
-
3. Europe
- 3.1. United Kingdom
- 3.2. Germany
- 3.3. France
- 3.4. Italy
- 3.5. Spain
- 3.6. Russia
- 3.7. Benelux
- 3.8. Nordics
- 3.9. Rest of Europe
-
4. Middle East & Africa
- 4.1. Turkey
- 4.2. Israel
- 4.3. GCC
- 4.4. North Africa
- 4.5. South Africa
- 4.6. Rest of Middle East & Africa
-
5. Asia Pacific
- 5.1. China
- 5.2. India
- 5.3. Japan
- 5.4. South Korea
- 5.5. ASEAN
- 5.6. Oceania
- 5.7. Rest of Asia Pacific
Preclinical Imaging Solution REPORT HIGHLIGHTS
| Aspects | Details |
|---|---|
| Study Period | 2019-2033 |
| Base Year | 2024 |
| Estimated Year | 2025 |
| Forecast Period | 2025-2033 |
| Historical Period | 2019-2024 |
| Growth Rate | CAGR of XXX% from 2019-2033 |
| Segmentation |
|
Table of Contents
- 1. Introduction
- 1.1. Research Scope
- 1.2. Market Segmentation
- 1.3. Research Methodology
- 1.4. Definitions and Assumptions
- 2. Executive Summary
- 2.1. Introduction
- 3. Market Dynamics
- 3.1. Introduction
- 3.2. Market Drivers
- 3.3. Market Restrains
- 3.4. Market Trends
- 4. Market Factor Analysis
- 4.1. Porters Five Forces
- 4.2. Supply/Value Chain
- 4.3. PESTEL analysis
- 4.4. Market Entropy
- 4.5. Patent/Trademark Analysis
- 5. Global Preclinical Imaging Solution Analysis, Insights and Forecast, 2019-2031
- 5.1. Market Analysis, Insights and Forecast - by Application
- 5.1.1. Hospital
- 5.1.2. Diagnostic Center
- 5.1.3. Laboratory
- 5.1.4. Others
- 5.2. Market Analysis, Insights and Forecast - by Type
- 5.2.1. Magnetic Resonance Imaging (MRI)
- 5.2.2. Computed Tomography (CT)
- 5.2.3. Positron Emission Tomography (PET)
- 5.2.4. Single-Photon Emission Computed Tomography (SPECT)
- 5.2.5. Others
- 5.3. Market Analysis, Insights and Forecast - by Region
- 5.3.1. North America
- 5.3.2. South America
- 5.3.3. Europe
- 5.3.4. Middle East & Africa
- 5.3.5. Asia Pacific
- 5.1. Market Analysis, Insights and Forecast - by Application
- 6. North America Preclinical Imaging Solution Analysis, Insights and Forecast, 2019-2031
- 6.1. Market Analysis, Insights and Forecast - by Application
- 6.1.1. Hospital
- 6.1.2. Diagnostic Center
- 6.1.3. Laboratory
- 6.1.4. Others
- 6.2. Market Analysis, Insights and Forecast - by Type
- 6.2.1. Magnetic Resonance Imaging (MRI)
- 6.2.2. Computed Tomography (CT)
- 6.2.3. Positron Emission Tomography (PET)
- 6.2.4. Single-Photon Emission Computed Tomography (SPECT)
- 6.2.5. Others
- 6.1. Market Analysis, Insights and Forecast - by Application
- 7. South America Preclinical Imaging Solution Analysis, Insights and Forecast, 2019-2031
- 7.1. Market Analysis, Insights and Forecast - by Application
- 7.1.1. Hospital
- 7.1.2. Diagnostic Center
- 7.1.3. Laboratory
- 7.1.4. Others
- 7.2. Market Analysis, Insights and Forecast - by Type
- 7.2.1. Magnetic Resonance Imaging (MRI)
- 7.2.2. Computed Tomography (CT)
- 7.2.3. Positron Emission Tomography (PET)
- 7.2.4. Single-Photon Emission Computed Tomography (SPECT)
- 7.2.5. Others
- 7.1. Market Analysis, Insights and Forecast - by Application
- 8. Europe Preclinical Imaging Solution Analysis, Insights and Forecast, 2019-2031
- 8.1. Market Analysis, Insights and Forecast - by Application
- 8.1.1. Hospital
- 8.1.2. Diagnostic Center
- 8.1.3. Laboratory
- 8.1.4. Others
- 8.2. Market Analysis, Insights and Forecast - by Type
- 8.2.1. Magnetic Resonance Imaging (MRI)
- 8.2.2. Computed Tomography (CT)
- 8.2.3. Positron Emission Tomography (PET)
- 8.2.4. Single-Photon Emission Computed Tomography (SPECT)
- 8.2.5. Others
- 8.1. Market Analysis, Insights and Forecast - by Application
- 9. Middle East & Africa Preclinical Imaging Solution Analysis, Insights and Forecast, 2019-2031
- 9.1. Market Analysis, Insights and Forecast - by Application
- 9.1.1. Hospital
- 9.1.2. Diagnostic Center
- 9.1.3. Laboratory
- 9.1.4. Others
- 9.2. Market Analysis, Insights and Forecast - by Type
- 9.2.1. Magnetic Resonance Imaging (MRI)
- 9.2.2. Computed Tomography (CT)
- 9.2.3. Positron Emission Tomography (PET)
- 9.2.4. Single-Photon Emission Computed Tomography (SPECT)
- 9.2.5. Others
- 9.1. Market Analysis, Insights and Forecast - by Application
- 10. Asia Pacific Preclinical Imaging Solution Analysis, Insights and Forecast, 2019-2031
- 10.1. Market Analysis, Insights and Forecast - by Application
- 10.1.1. Hospital
- 10.1.2. Diagnostic Center
- 10.1.3. Laboratory
- 10.1.4. Others
- 10.2. Market Analysis, Insights and Forecast - by Type
- 10.2.1. Magnetic Resonance Imaging (MRI)
- 10.2.2. Computed Tomography (CT)
- 10.2.3. Positron Emission Tomography (PET)
- 10.2.4. Single-Photon Emission Computed Tomography (SPECT)
- 10.2.5. Others
- 10.1. Market Analysis, Insights and Forecast - by Application
- 11. Competitive Analysis
- 11.1. Global Market Share Analysis 2024
- 11.2. Company Profiles
- 11.2.1 Bruker
- 11.2.1.1. Overview
- 11.2.1.2. Products
- 11.2.1.3. SWOT Analysis
- 11.2.1.4. Recent Developments
- 11.2.1.5. Financials (Based on Availability)
- 11.2.2 PerkinElmer
- 11.2.2.1. Overview
- 11.2.2.2. Products
- 11.2.2.3. SWOT Analysis
- 11.2.2.4. Recent Developments
- 11.2.2.5. Financials (Based on Availability)
- 11.2.3 MILabs
- 11.2.3.1. Overview
- 11.2.3.2. Products
- 11.2.3.3. SWOT Analysis
- 11.2.3.4. Recent Developments
- 11.2.3.5. Financials (Based on Availability)
- 11.2.4 MR Solutions
- 11.2.4.1. Overview
- 11.2.4.2. Products
- 11.2.4.3. SWOT Analysis
- 11.2.4.4. Recent Developments
- 11.2.4.5. Financials (Based on Availability)
- 11.2.5 Aspect Imaging
- 11.2.5.1. Overview
- 11.2.5.2. Products
- 11.2.5.3. SWOT Analysis
- 11.2.5.4. Recent Developments
- 11.2.5.5. Financials (Based on Availability)
- 11.2.6 Mediso
- 11.2.6.1. Overview
- 11.2.6.2. Products
- 11.2.6.3. SWOT Analysis
- 11.2.6.4. Recent Developments
- 11.2.6.5. Financials (Based on Availability)
- 11.2.7 Fujifilm
- 11.2.7.1. Overview
- 11.2.7.2. Products
- 11.2.7.3. SWOT Analysis
- 11.2.7.4. Recent Developments
- 11.2.7.5. Financials (Based on Availability)
- 11.2.8 Siemens Healthineers
- 11.2.8.1. Overview
- 11.2.8.2. Products
- 11.2.8.3. SWOT Analysis
- 11.2.8.4. Recent Developments
- 11.2.8.5. Financials (Based on Availability)
- 11.2.9 TriFoil Imaging
- 11.2.9.1. Overview
- 11.2.9.2. Products
- 11.2.9.3. SWOT Analysis
- 11.2.9.4. Recent Developments
- 11.2.9.5. Financials (Based on Availability)
- 11.2.10 Miltenyi Biotec
- 11.2.10.1. Overview
- 11.2.10.2. Products
- 11.2.10.3. SWOT Analysis
- 11.2.10.4. Recent Developments
- 11.2.10.5. Financials (Based on Availability)
- 11.2.11 LI-COR Biosciences
- 11.2.11.1. Overview
- 11.2.11.2. Products
- 11.2.11.3. SWOT Analysis
- 11.2.11.4. Recent Developments
- 11.2.11.5. Financials (Based on Availability)
- 11.2.12 Biospace Lab
- 11.2.12.1. Overview
- 11.2.12.2. Products
- 11.2.12.3. SWOT Analysis
- 11.2.12.4. Recent Developments
- 11.2.12.5. Financials (Based on Availability)
- 11.2.13 Inviscan
- 11.2.13.1. Overview
- 11.2.13.2. Products
- 11.2.13.3. SWOT Analysis
- 11.2.13.4. Recent Developments
- 11.2.13.5. Financials (Based on Availability)
- 11.2.14 Charles River
- 11.2.14.1. Overview
- 11.2.14.2. Products
- 11.2.14.3. SWOT Analysis
- 11.2.14.4. Recent Developments
- 11.2.14.5. Financials (Based on Availability)
- 11.2.15 Minerva Imaging
- 11.2.15.1. Overview
- 11.2.15.2. Products
- 11.2.15.3. SWOT Analysis
- 11.2.15.4. Recent Developments
- 11.2.15.5. Financials (Based on Availability)
- 11.2.1 Bruker
List of Figures
- Figure 1: Global Preclinical Imaging Solution Revenue Breakdown (million, %) by Region 2024 & 2032
- Figure 2: North America Preclinical Imaging Solution Revenue (million), by Application 2024 & 2032
- Figure 3: North America Preclinical Imaging Solution Revenue Share (%), by Application 2024 & 2032
- Figure 4: North America Preclinical Imaging Solution Revenue (million), by Type 2024 & 2032
- Figure 5: North America Preclinical Imaging Solution Revenue Share (%), by Type 2024 & 2032
- Figure 6: North America Preclinical Imaging Solution Revenue (million), by Country 2024 & 2032
- Figure 7: North America Preclinical Imaging Solution Revenue Share (%), by Country 2024 & 2032
- Figure 8: South America Preclinical Imaging Solution Revenue (million), by Application 2024 & 2032
- Figure 9: South America Preclinical Imaging Solution Revenue Share (%), by Application 2024 & 2032
- Figure 10: South America Preclinical Imaging Solution Revenue (million), by Type 2024 & 2032
- Figure 11: South America Preclinical Imaging Solution Revenue Share (%), by Type 2024 & 2032
- Figure 12: South America Preclinical Imaging Solution Revenue (million), by Country 2024 & 2032
- Figure 13: South America Preclinical Imaging Solution Revenue Share (%), by Country 2024 & 2032
- Figure 14: Europe Preclinical Imaging Solution Revenue (million), by Application 2024 & 2032
- Figure 15: Europe Preclinical Imaging Solution Revenue Share (%), by Application 2024 & 2032
- Figure 16: Europe Preclinical Imaging Solution Revenue (million), by Type 2024 & 2032
- Figure 17: Europe Preclinical Imaging Solution Revenue Share (%), by Type 2024 & 2032
- Figure 18: Europe Preclinical Imaging Solution Revenue (million), by Country 2024 & 2032
- Figure 19: Europe Preclinical Imaging Solution Revenue Share (%), by Country 2024 & 2032
- Figure 20: Middle East & Africa Preclinical Imaging Solution Revenue (million), by Application 2024 & 2032
- Figure 21: Middle East & Africa Preclinical Imaging Solution Revenue Share (%), by Application 2024 & 2032
- Figure 22: Middle East & Africa Preclinical Imaging Solution Revenue (million), by Type 2024 & 2032
- Figure 23: Middle East & Africa Preclinical Imaging Solution Revenue Share (%), by Type 2024 & 2032
- Figure 24: Middle East & Africa Preclinical Imaging Solution Revenue (million), by Country 2024 & 2032
- Figure 25: Middle East & Africa Preclinical Imaging Solution Revenue Share (%), by Country 2024 & 2032
- Figure 26: Asia Pacific Preclinical Imaging Solution Revenue (million), by Application 2024 & 2032
- Figure 27: Asia Pacific Preclinical Imaging Solution Revenue Share (%), by Application 2024 & 2032
- Figure 28: Asia Pacific Preclinical Imaging Solution Revenue (million), by Type 2024 & 2032
- Figure 29: Asia Pacific Preclinical Imaging Solution Revenue Share (%), by Type 2024 & 2032
- Figure 30: Asia Pacific Preclinical Imaging Solution Revenue (million), by Country 2024 & 2032
- Figure 31: Asia Pacific Preclinical Imaging Solution Revenue Share (%), by Country 2024 & 2032
List of Tables
- Table 1: Global Preclinical Imaging Solution Revenue million Forecast, by Region 2019 & 2032
- Table 2: Global Preclinical Imaging Solution Revenue million Forecast, by Application 2019 & 2032
- Table 3: Global Preclinical Imaging Solution Revenue million Forecast, by Type 2019 & 2032
- Table 4: Global Preclinical Imaging Solution Revenue million Forecast, by Region 2019 & 2032
- Table 5: Global Preclinical Imaging Solution Revenue million Forecast, by Application 2019 & 2032
- Table 6: Global Preclinical Imaging Solution Revenue million Forecast, by Type 2019 & 2032
- Table 7: Global Preclinical Imaging Solution Revenue million Forecast, by Country 2019 & 2032
- Table 8: United States Preclinical Imaging Solution Revenue (million) Forecast, by Application 2019 & 2032
- Table 9: Canada Preclinical Imaging Solution Revenue (million) Forecast, by Application 2019 & 2032
- Table 10: Mexico Preclinical Imaging Solution Revenue (million) Forecast, by Application 2019 & 2032
- Table 11: Global Preclinical Imaging Solution Revenue million Forecast, by Application 2019 & 2032
- Table 12: Global Preclinical Imaging Solution Revenue million Forecast, by Type 2019 & 2032
- Table 13: Global Preclinical Imaging Solution Revenue million Forecast, by Country 2019 & 2032
- Table 14: Brazil Preclinical Imaging Solution Revenue (million) Forecast, by Application 2019 & 2032
- Table 15: Argentina Preclinical Imaging Solution Revenue (million) Forecast, by Application 2019 & 2032
- Table 16: Rest of South America Preclinical Imaging Solution Revenue (million) Forecast, by Application 2019 & 2032
- Table 17: Global Preclinical Imaging Solution Revenue million Forecast, by Application 2019 & 2032
- Table 18: Global Preclinical Imaging Solution Revenue million Forecast, by Type 2019 & 2032
- Table 19: Global Preclinical Imaging Solution Revenue million Forecast, by Country 2019 & 2032
- Table 20: United Kingdom Preclinical Imaging Solution Revenue (million) Forecast, by Application 2019 & 2032
- Table 21: Germany Preclinical Imaging Solution Revenue (million) Forecast, by Application 2019 & 2032
- Table 22: France Preclinical Imaging Solution Revenue (million) Forecast, by Application 2019 & 2032
- Table 23: Italy Preclinical Imaging Solution Revenue (million) Forecast, by Application 2019 & 2032
- Table 24: Spain Preclinical Imaging Solution Revenue (million) Forecast, by Application 2019 & 2032
- Table 25: Russia Preclinical Imaging Solution Revenue (million) Forecast, by Application 2019 & 2032
- Table 26: Benelux Preclinical Imaging Solution Revenue (million) Forecast, by Application 2019 & 2032
- Table 27: Nordics Preclinical Imaging Solution Revenue (million) Forecast, by Application 2019 & 2032
- Table 28: Rest of Europe Preclinical Imaging Solution Revenue (million) Forecast, by Application 2019 & 2032
- Table 29: Global Preclinical Imaging Solution Revenue million Forecast, by Application 2019 & 2032
- Table 30: Global Preclinical Imaging Solution Revenue million Forecast, by Type 2019 & 2032
- Table 31: Global Preclinical Imaging Solution Revenue million Forecast, by Country 2019 & 2032
- Table 32: Turkey Preclinical Imaging Solution Revenue (million) Forecast, by Application 2019 & 2032
- Table 33: Israel Preclinical Imaging Solution Revenue (million) Forecast, by Application 2019 & 2032
- Table 34: GCC Preclinical Imaging Solution Revenue (million) Forecast, by Application 2019 & 2032
- Table 35: North Africa Preclinical Imaging Solution Revenue (million) Forecast, by Application 2019 & 2032
- Table 36: South Africa Preclinical Imaging Solution Revenue (million) Forecast, by Application 2019 & 2032
- Table 37: Rest of Middle East & Africa Preclinical Imaging Solution Revenue (million) Forecast, by Application 2019 & 2032
- Table 38: Global Preclinical Imaging Solution Revenue million Forecast, by Application 2019 & 2032
- Table 39: Global Preclinical Imaging Solution Revenue million Forecast, by Type 2019 & 2032
- Table 40: Global Preclinical Imaging Solution Revenue million Forecast, by Country 2019 & 2032
- Table 41: China Preclinical Imaging Solution Revenue (million) Forecast, by Application 2019 & 2032
- Table 42: India Preclinical Imaging Solution Revenue (million) Forecast, by Application 2019 & 2032
- Table 43: Japan Preclinical Imaging Solution Revenue (million) Forecast, by Application 2019 & 2032
- Table 44: South Korea Preclinical Imaging Solution Revenue (million) Forecast, by Application 2019 & 2032
- Table 45: ASEAN Preclinical Imaging Solution Revenue (million) Forecast, by Application 2019 & 2032
- Table 46: Oceania Preclinical Imaging Solution Revenue (million) Forecast, by Application 2019 & 2032
- Table 47: Rest of Asia Pacific Preclinical Imaging Solution Revenue (million) Forecast, by Application 2019 & 2032
Frequently Asked Questions
1. What is the projected Compound Annual Growth Rate (CAGR) of the Preclinical Imaging Solution?
The projected CAGR is approximately XXX%.
2. Which companies are prominent players in the Preclinical Imaging Solution?
Key companies in the market include Bruker, PerkinElmer, MILabs, MR Solutions, Aspect Imaging, Mediso, Fujifilm, Siemens Healthineers, TriFoil Imaging, Miltenyi Biotec, LI-COR Biosciences, Biospace Lab, Inviscan, Charles River, Minerva Imaging.
3. What are the main segments of the Preclinical Imaging Solution?
The market segments include Application, Type.
4. Can you provide details about the market size?
The market size is estimated to be USD XXX million as of 2022.
5. What are some drivers contributing to market growth?
N/A
6. What are the notable trends driving market growth?
N/A
7. Are there any restraints impacting market growth?
N/A
8. Can you provide examples of recent developments in the market?
N/A
9. What pricing options are available for accessing the report?
Pricing options include single-user, multi-user, and enterprise licenses priced at USD 2900.00, USD 4350.00, and USD 5800.00 respectively.
10. Is the market size provided in terms of value or volume?
The market size is provided in terms of value, measured in million.
11. Are there any specific market keywords associated with the report?
Yes, the market keyword associated with the report is "Preclinical Imaging Solution," which aids in identifying and referencing the specific market segment covered.
12. How do I determine which pricing option suits my needs best?
The pricing options vary based on user requirements and access needs. Individual users may opt for single-user licenses, while businesses requiring broader access may choose multi-user or enterprise licenses for cost-effective access to the report.
13. Are there any additional resources or data provided in the Preclinical Imaging Solution report?
While the report offers comprehensive insights, it's advisable to review the specific contents or supplementary materials provided to ascertain if additional resources or data are available.
14. How can I stay updated on further developments or reports in the Preclinical Imaging Solution?
To stay informed about further developments, trends, and reports in the Preclinical Imaging Solution, consider subscribing to industry newsletters, following relevant companies and organizations, or regularly checking reputable industry news sources and publications.
Methodology
Step 1 - Identification of Relevant Samples Size from Population Database


Step 2 - Approaches for Defining Global Market Size (Value, Volume* & Price*)

Note*: In applicable scenarios
Step 3 - Data Sources
Primary Research
- Web Analytics
- Survey Reports
- Research Institute
- Latest Research Reports
- Opinion Leaders
Secondary Research
- Annual Reports
- White Paper
- Latest Press Release
- Industry Association
- Paid Database
- Investor Presentations

Step 4 - Data Triangulation
Involves using different sources of information in order to increase the validity of a study
These sources are likely to be stakeholders in a program - participants, other researchers, program staff, other community members, and so on.
Then we put all data in single framework & apply various statistical tools to find out the dynamic on the market.
During the analysis stage, feedback from the stakeholder groups would be compared to determine areas of agreement as well as areas of divergence


