Strategic Growth Drivers for Submarine Propulsion Systems Industry Market

Submarine Propulsion Systems Industry by Production Analysis, by Consumption Analysis, by Import Market Analysis (Value & Volume), by Export Market Analysis (Value & Volume), by Price Trend Analysis, by North America (United States, Canada, Mexico), by South America (Brazil, Argentina, Rest of South America), by Europe (United Kingdom, Germany, France, Italy, Spain, Russia, Benelux, Nordics, Rest of Europe), by Middle East & Africa (Turkey, Israel, GCC, North Africa, South Africa, Rest of Middle East & Africa), by Asia Pacific (China, India, Japan, South Korea, ASEAN, Oceania, Rest of Asia Pacific) Forecast 2025-2033

Jul 3 2025
Base Year: 2024

234 Pages
Main Logo

Strategic Growth Drivers for Submarine Propulsion Systems Industry Market


Home
Industries
Aerospace & Defense
sponsor image
sponsor image
sponsor image
sponsor image

Tailored for you

  • In-depth Analysis Tailored to Specified Regions or Segments
  • Company Profiles Customized to User Preferences
  • Comprehensive Insights Focused on Specific Segments or Regions
  • Customized Evaluation of Competitive Landscape to Meet Your Needs
  • Tailored Customization to Address Other Specific Requirements
Ask for customization


Key Insights

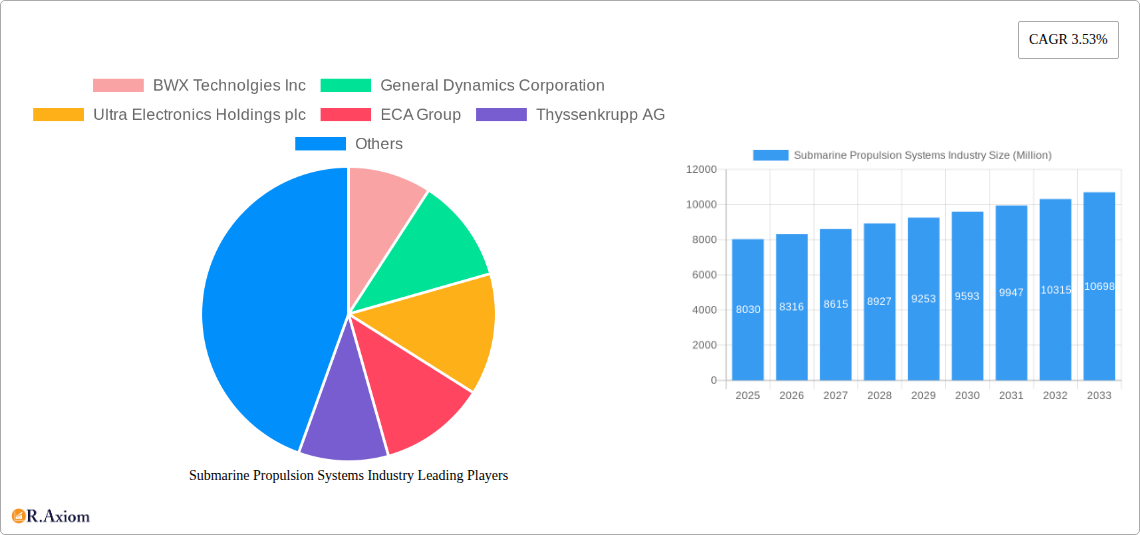
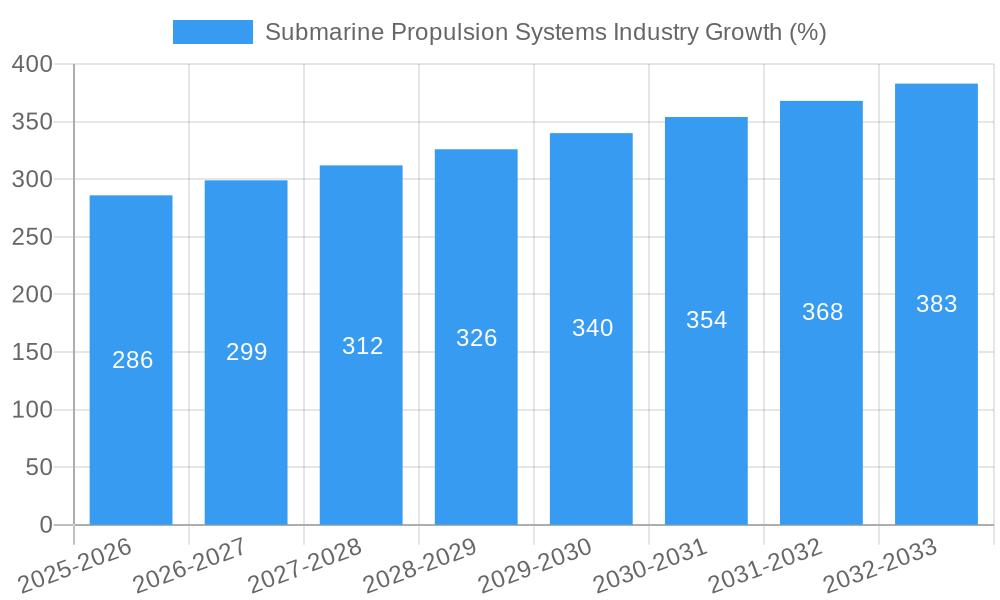
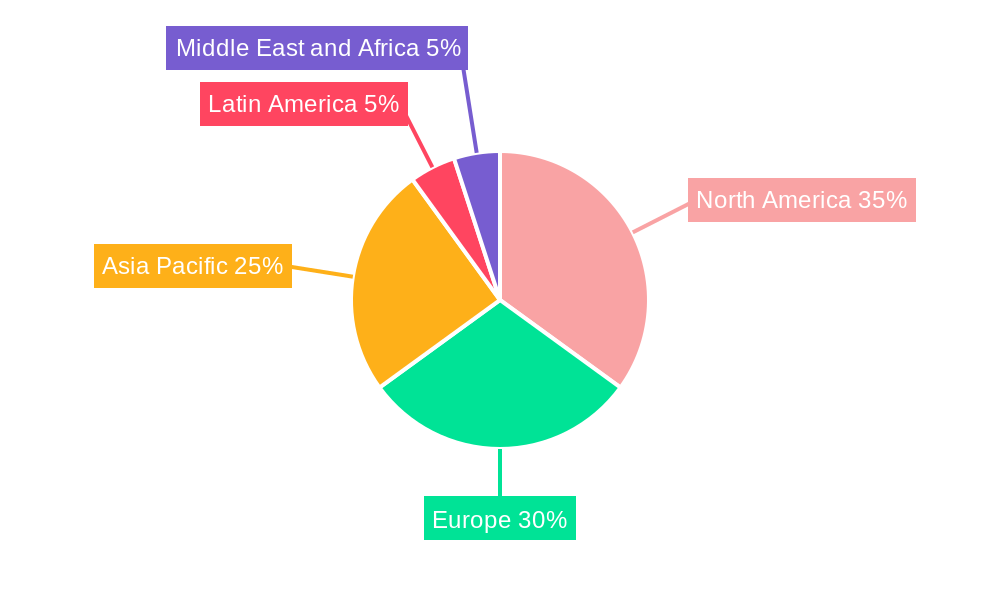
The global submarine propulsion systems market, valued at $8.03 billion in 2025, is projected to experience steady growth, driven by increasing geopolitical tensions and the need for advanced naval capabilities. A compound annual growth rate (CAGR) of 3.53% from 2025 to 2033 indicates a substantial market expansion. Key drivers include the modernization and expansion of submarine fleets globally, particularly among major naval powers. Technological advancements in areas such as air-independent propulsion (AIP) systems, which extend underwater endurance significantly, are further boosting market demand. Nuclear propulsion systems, while representing a smaller segment due to high costs and complex maintenance, continue to be crucial for long-range and silent operations. Diesel-electric systems remain dominant due to their cost-effectiveness, but are facing increasing pressure to improve efficiency and reduce noise signatures. The market is segmented by propulsion type (nuclear, diesel-electric, AIP) and application (commercial, primarily research and exploration, and defense). The defense segment holds the largest share, influenced by governmental spending on naval modernization programs. Geographic distribution shows significant presence in North America and Europe, with Asia-Pacific showing strong growth potential driven by increased naval investments from China and other regional players. Growth restraints include high initial investment costs for new systems, stringent regulatory requirements for safety and environmental compliance, and the ongoing research and development complexities involved in improving propulsion technologies.

The competitive landscape is characterized by a mix of established defense contractors and specialized technology providers. Companies like General Dynamics, Rolls-Royce, and Thyssenkrupp are key players, leveraging their expertise in both submarine design and propulsion system integration. The market is experiencing increased consolidation and collaboration, reflecting the technological complexities and high capital investment involved. Future market growth will likely be influenced by advancements in battery technology for AIP systems, the development of more efficient and quieter diesel-electric motors, and continued research into alternative propulsion methods. The focus will remain on enhancing stealth capabilities, extending operational endurance, and reducing environmental impact. Furthermore, the emerging demand for unmanned underwater vehicles (UUVs) with advanced propulsion presents new growth avenues within the broader market.

Submarine Propulsion Systems Industry: A Comprehensive Market Analysis (2019-2033)

This in-depth report provides a comprehensive analysis of the global Submarine Propulsion Systems industry, offering invaluable insights for stakeholders, investors, and industry professionals. Covering the period from 2019 to 2033, with a base year of 2025 and a forecast period of 2025-2033, this report meticulously examines market dynamics, technological advancements, and competitive landscapes. The total market value in 2025 is estimated at $XX Million, with projections for significant growth throughout the forecast period.

Submarine Propulsion Systems Industry Research Report - Market Size, Growth & Forecast

Submarine Propulsion Systems Industry Market Concentration & Innovation

The Submarine Propulsion Systems market exhibits a moderately concentrated structure, with key players like General Dynamics Corporation, Rolls-Royce plc, and Thyssenkrupp AG holding significant market share. In 2025, these top three players collectively commanded approximately XX% of the global market. However, the emergence of innovative technologies and the entry of new players are gradually increasing competition. Market concentration is expected to remain relatively stable through 2033, although the precise market share of each company might shift.

Innovation is a key driver, propelled by the need for enhanced fuel efficiency, quieter operation, and improved performance in challenging environments. Regulatory frameworks, particularly those related to environmental protection and emission standards, are influencing technological advancements. The industry is also witnessing increased M&A activity, with deal values reaching $XX Million in 2024. Examples include the acquisition of [Company A] by [Company B] in [Year], valued at $XX Million, which expanded the market presence of the acquirer. Product substitutes, such as alternative propulsion systems, while currently limited in adoption, pose a long-term threat. The demand for advanced submarine capabilities across defense forces fuels innovation, along with shifting end-user preferences towards increased stealth and endurance.

Submarine Propulsion Systems Industry Industry Trends & Insights

The global Submarine Propulsion Systems market is experiencing robust growth, driven by increased defense spending globally, particularly among major naval powers. The market is projected to witness a Compound Annual Growth Rate (CAGR) of XX% during the forecast period (2025-2033). Technological disruptions, including advancements in AIP (Air Independent Propulsion) systems and the development of more efficient nuclear propulsion technologies, are significantly influencing market growth. Consumer preferences are shifting towards higher levels of stealth, endurance, and operational capabilities, further driving demand for advanced propulsion systems. The competitive dynamics are intensifying, with established players focusing on innovation and new entrants exploring niche markets. Market penetration of AIP systems is expected to increase from XX% in 2025 to XX% by 2033, driven by their enhanced operational capabilities and reduced reliance on surface replenishment.

Submarine Propulsion Systems Industry Growth

Dominant Markets & Segments in Submarine Propulsion Systems Industry

  • Leading Region: North America currently holds the largest market share, driven by substantial defense budgets and technological advancements. Key drivers include robust governmental investments in naval modernization and strong research & development activities.
  • Leading Country: The United States dominates the North American market, followed by [Country]. This dominance is largely attributed to the significant size of its navy and its continuous investments in advanced submarine technologies.
  • Dominant Segment (Type): Diesel-electric propulsion systems currently represent the largest segment by type, accounting for XX% of the market in 2025. However, nuclear propulsion systems hold a significant share, particularly in the defense sector, owing to their extended operational range and independence from atmospheric oxygen. The market share of AIP systems is anticipated to grow at a faster rate than other segments, due to the inherent advantages they offer in terms of underwater endurance and stealth.
  • Dominant Segment (Application): The defense segment overwhelmingly dominates the Submarine Propulsion Systems market, driven by high government procurement and strategic defense needs. Commercial applications, although a smaller segment, are poised for modest growth driven by emerging sectors like subsea exploration and resource extraction.

Submarine Propulsion Systems Industry Product Developments

Recent years have witnessed significant advancements in submarine propulsion systems, focusing on enhanced fuel efficiency, reduced acoustic signatures, and improved operational range. The introduction of advanced materials, improved control systems, and the integration of more efficient power generation technologies have led to considerable performance improvements. The market is witnessing increased focus on hybrid propulsion systems that combine the strengths of different propulsion technologies, offering versatility and adaptability to varied mission profiles. This trend aligns with the industry's efforts to optimize performance while meeting growing environmental concerns.

Report Scope & Segmentation Analysis

Type: This report segments the market by type into Nuclear Propulsion Systems, Diesel-electric Propulsion Systems, and Air Independent Propulsion (AIP) Systems. Nuclear systems are projected to maintain a stable growth rate due to their superior range and operational capabilities. Diesel-electric systems are likely to grow steadily, driven by cost-effectiveness and suitability for various applications. AIP systems are poised for the fastest growth, driven by technological advancements and the need for enhanced stealth and underwater endurance.

Application: The market is segmented by application into Commercial and Defense. The Defense segment is by far the largest and is expected to remain so, due to the substantial investment in naval capabilities by major global powers. The Commercial segment shows promising, albeit slower, growth potential, driven by the rising demand for subsea exploration and resource extraction.

Key Drivers of Submarine Propulsion Systems Industry Growth

Several factors fuel the growth of the Submarine Propulsion Systems industry. Firstly, increasing global defense budgets, particularly from major naval powers, are driving demand for advanced submarine technologies. Secondly, technological advancements in AIP systems and nuclear propulsion enhance operational capabilities, thereby increasing demand. Thirdly, the rising need for improved submarine stealth capabilities, particularly in contested waters, further stimulates growth. Lastly, governmental regulations concerning environmental protection are also influencing the development of more fuel-efficient and environmentally friendly propulsion systems.

Challenges in the Submarine Propulsion Systems Industry Sector

The Submarine Propulsion Systems industry faces several challenges. Stringent regulatory requirements, especially concerning environmental impact and safety, significantly impact development costs and timelines. Supply chain disruptions, particularly in sourcing critical components and materials, present operational difficulties. Intense competition among established players and emerging entrants places downward pressure on pricing and profit margins. Furthermore, the high cost of research and development, coupled with long development cycles, poses a barrier to entry for many potential players.

Emerging Opportunities in Submarine Propulsion Systems Industry

The Submarine Propulsion Systems market presents several emerging opportunities. The rising demand for unmanned underwater vehicles (UUVs) opens new avenues for the application of advanced propulsion technologies. The development of more efficient and environmentally friendly propulsion systems, such as fuel cells and hybrid systems, offers attractive prospects. Growth in the commercial sector, driven by the increasing use of submarines in subsea exploration and resource extraction, provides further opportunities for market expansion. The exploration of alternative fuel sources for propulsion systems represents a significant emerging opportunity to mitigate the environmental impact of submarine operations.

Leading Players in the Submarine Propulsion Systems Industry Market

  • BWX Technologies Inc
  • General Dynamics Corporation
  • Ultra Electronics Holdings plc
  • ECA Group
  • Thyssenkrupp AG
  • Siemens AG
  • Rolls-Royce plc
  • Naval Group
  • Saab AB

Key Developments in Submarine Propulsion Systems Industry Industry

  • 2022 Q4: Rolls-Royce announced a significant investment in the development of a new generation of hybrid propulsion systems.
  • 2023 Q1: General Dynamics successfully completed sea trials of its latest AIP technology.
  • 2023 Q3: A major merger between [Company X] and [Company Y] significantly altered the market landscape.
  • 2024 Q2: A new entrant launched a novel propulsion system based on [Specific Technology].

Note: Specific details might vary based on industry releases.

Strategic Outlook for Submarine Propulsion Systems Industry Market

The Submarine Propulsion Systems industry is poised for sustained growth driven by technological advancements, increased defense spending, and emerging commercial applications. The focus on improving stealth, efficiency, and range, coupled with the development of environmentally friendly solutions, will shape the future of this market. Opportunities exist for players who can adapt to the evolving regulatory landscape, innovate in key technologies, and cater to the specific needs of their target markets. This market is poised for sustained growth and remains attractive to investors and industry players alike.

Submarine Propulsion Systems Industry Segmentation

  • 1. Production Analysis
  • 2. Consumption Analysis
  • 3. Import Market Analysis (Value & Volume)
  • 4. Export Market Analysis (Value & Volume)
  • 5. Price Trend Analysis

Submarine Propulsion Systems Industry Segmentation By Geography

  • 1. North America
    • 1.1. United States
    • 1.2. Canada
    • 1.3. Mexico
  • 2. South America
    • 2.1. Brazil
    • 2.2. Argentina
    • 2.3. Rest of South America
  • 3. Europe
    • 3.1. United Kingdom
    • 3.2. Germany
    • 3.3. France
    • 3.4. Italy
    • 3.5. Spain
    • 3.6. Russia
    • 3.7. Benelux
    • 3.8. Nordics
    • 3.9. Rest of Europe
  • 4. Middle East & Africa
    • 4.1. Turkey
    • 4.2. Israel
    • 4.3. GCC
    • 4.4. North Africa
    • 4.5. South Africa
    • 4.6. Rest of Middle East & Africa
  • 5. Asia Pacific
    • 5.1. China
    • 5.2. India
    • 5.3. Japan
    • 5.4. South Korea
    • 5.5. ASEAN
    • 5.6. Oceania
    • 5.7. Rest of Asia Pacific
Submarine Propulsion Systems Industry Regional Share


Submarine Propulsion Systems Industry REPORT HIGHLIGHTS

AspectsDetails
Study Period 2019-2033
Base Year 2024
Estimated Year 2025
Forecast Period2025-2033
Historical Period2019-2024
Growth RateCAGR of 3.53% from 2019-2033
Segmentation
    • By Production Analysis
    • By Consumption Analysis
    • By Import Market Analysis (Value & Volume)
    • By Export Market Analysis (Value & Volume)
    • By Price Trend Analysis
  • By Geography
    • North America
      • United States
      • Canada
      • Mexico
    • South America
      • Brazil
      • Argentina
      • Rest of South America
    • Europe
      • United Kingdom
      • Germany
      • France
      • Italy
      • Spain
      • Russia
      • Benelux
      • Nordics
      • Rest of Europe
    • Middle East & Africa
      • Turkey
      • Israel
      • GCC
      • North Africa
      • South Africa
      • Rest of Middle East & Africa
    • Asia Pacific
      • China
      • India
      • Japan
      • South Korea
      • ASEAN
      • Oceania
      • Rest of Asia Pacific


Table of Contents

  1. 1. Introduction
    • 1.1. Research Scope
    • 1.2. Market Segmentation
    • 1.3. Research Methodology
    • 1.4. Definitions and Assumptions
  2. 2. Executive Summary
    • 2.1. Introduction
  3. 3. Market Dynamics
    • 3.1. Introduction
      • 3.2. Market Drivers
      • 3.3. Market Restrains
      • 3.4. Market Trends
        • 3.4.1. The Military Segment is Projected to Dominate the Market During the Forecast Period
  4. 4. Market Factor Analysis
    • 4.1. Porters Five Forces
    • 4.2. Supply/Value Chain
    • 4.3. PESTEL analysis
    • 4.4. Market Entropy
    • 4.5. Patent/Trademark Analysis
  5. 5. Global Submarine Propulsion Systems Industry Analysis, Insights and Forecast, 2019-2031
    • 5.1. Market Analysis, Insights and Forecast - by Production Analysis
      • 5.2. Market Analysis, Insights and Forecast - by Consumption Analysis
        • 5.3. Market Analysis, Insights and Forecast - by Import Market Analysis (Value & Volume)
          • 5.4. Market Analysis, Insights and Forecast - by Export Market Analysis (Value & Volume)
            • 5.5. Market Analysis, Insights and Forecast - by Price Trend Analysis
              • 5.6. Market Analysis, Insights and Forecast - by Region
                • 5.6.1. North America
                • 5.6.2. South America
                • 5.6.3. Europe
                • 5.6.4. Middle East & Africa
                • 5.6.5. Asia Pacific
            • 6. North America Submarine Propulsion Systems Industry Analysis, Insights and Forecast, 2019-2031
              • 6.1. Market Analysis, Insights and Forecast - by Production Analysis
                • 6.2. Market Analysis, Insights and Forecast - by Consumption Analysis
                  • 6.3. Market Analysis, Insights and Forecast - by Import Market Analysis (Value & Volume)
                    • 6.4. Market Analysis, Insights and Forecast - by Export Market Analysis (Value & Volume)
                      • 6.5. Market Analysis, Insights and Forecast - by Price Trend Analysis
                      • 7. South America Submarine Propulsion Systems Industry Analysis, Insights and Forecast, 2019-2031
                        • 7.1. Market Analysis, Insights and Forecast - by Production Analysis
                          • 7.2. Market Analysis, Insights and Forecast - by Consumption Analysis
                            • 7.3. Market Analysis, Insights and Forecast - by Import Market Analysis (Value & Volume)
                              • 7.4. Market Analysis, Insights and Forecast - by Export Market Analysis (Value & Volume)
                                • 7.5. Market Analysis, Insights and Forecast - by Price Trend Analysis
                                • 8. Europe Submarine Propulsion Systems Industry Analysis, Insights and Forecast, 2019-2031
                                  • 8.1. Market Analysis, Insights and Forecast - by Production Analysis
                                    • 8.2. Market Analysis, Insights and Forecast - by Consumption Analysis
                                      • 8.3. Market Analysis, Insights and Forecast - by Import Market Analysis (Value & Volume)
                                        • 8.4. Market Analysis, Insights and Forecast - by Export Market Analysis (Value & Volume)
                                          • 8.5. Market Analysis, Insights and Forecast - by Price Trend Analysis
                                          • 9. Middle East & Africa Submarine Propulsion Systems Industry Analysis, Insights and Forecast, 2019-2031
                                            • 9.1. Market Analysis, Insights and Forecast - by Production Analysis
                                              • 9.2. Market Analysis, Insights and Forecast - by Consumption Analysis
                                                • 9.3. Market Analysis, Insights and Forecast - by Import Market Analysis (Value & Volume)
                                                  • 9.4. Market Analysis, Insights and Forecast - by Export Market Analysis (Value & Volume)
                                                    • 9.5. Market Analysis, Insights and Forecast - by Price Trend Analysis
                                                    • 10. Asia Pacific Submarine Propulsion Systems Industry Analysis, Insights and Forecast, 2019-2031
                                                      • 10.1. Market Analysis, Insights and Forecast - by Production Analysis
                                                        • 10.2. Market Analysis, Insights and Forecast - by Consumption Analysis
                                                          • 10.3. Market Analysis, Insights and Forecast - by Import Market Analysis (Value & Volume)
                                                            • 10.4. Market Analysis, Insights and Forecast - by Export Market Analysis (Value & Volume)
                                                              • 10.5. Market Analysis, Insights and Forecast - by Price Trend Analysis
                                                              • 11. North America Submarine Propulsion Systems Industry Analysis, Insights and Forecast, 2019-2031
                                                                  • 11.1. Market Analysis, Insights and Forecast - By Country/Sub-region
                                                                    • 11.1.1 United States
                                                                    • 11.1.2 Canada
                                                              • 12. Europe Submarine Propulsion Systems Industry Analysis, Insights and Forecast, 2019-2031
                                                                  • 12.1. Market Analysis, Insights and Forecast - By Country/Sub-region
                                                                    • 12.1.1 United Kingdom
                                                                    • 12.1.2 France
                                                                    • 12.1.3 Germany
                                                                    • 12.1.4 Russia
                                                                    • 12.1.5 Rest of Europe
                                                              • 13. Asia Pacific Submarine Propulsion Systems Industry Analysis, Insights and Forecast, 2019-2031
                                                                  • 13.1. Market Analysis, Insights and Forecast - By Country/Sub-region
                                                                    • 13.1.1 China
                                                                    • 13.1.2 India
                                                                    • 13.1.3 Japan
                                                                    • 13.1.4 South Korea
                                                                    • 13.1.5 Rest of Asia Pacific
                                                              • 14. Latin America Submarine Propulsion Systems Industry Analysis, Insights and Forecast, 2019-2031
                                                                  • 14.1. Market Analysis, Insights and Forecast - By Country/Sub-region
                                                                    • 14.1.1 Brazil
                                                                    • 14.1.2 Rest of Latin America
                                                              • 15. Middle East and Africa Submarine Propulsion Systems Industry Analysis, Insights and Forecast, 2019-2031
                                                                  • 15.1. Market Analysis, Insights and Forecast - By Country/Sub-region
                                                                    • 15.1.1 Saudi Arabia
                                                                    • 15.1.2 United Arab Emirates
                                                                    • 15.1.3 South Africa
                                                                    • 15.1.4 Rest of Middle East and Africa
                                                              • 16. Competitive Analysis
                                                                • 16.1. Global Market Share Analysis 2024
                                                                  • 16.2. Company Profiles
                                                                    • 16.2.1 BWX Technolgies Inc
                                                                      • 16.2.1.1. Overview
                                                                      • 16.2.1.2. Products
                                                                      • 16.2.1.3. SWOT Analysis
                                                                      • 16.2.1.4. Recent Developments
                                                                      • 16.2.1.5. Financials (Based on Availability)
                                                                    • 16.2.2 General Dynamics Corporation
                                                                      • 16.2.2.1. Overview
                                                                      • 16.2.2.2. Products
                                                                      • 16.2.2.3. SWOT Analysis
                                                                      • 16.2.2.4. Recent Developments
                                                                      • 16.2.2.5. Financials (Based on Availability)
                                                                    • 16.2.3 Ultra Electronics Holdings plc
                                                                      • 16.2.3.1. Overview
                                                                      • 16.2.3.2. Products
                                                                      • 16.2.3.3. SWOT Analysis
                                                                      • 16.2.3.4. Recent Developments
                                                                      • 16.2.3.5. Financials (Based on Availability)
                                                                    • 16.2.4 ECA Group
                                                                      • 16.2.4.1. Overview
                                                                      • 16.2.4.2. Products
                                                                      • 16.2.4.3. SWOT Analysis
                                                                      • 16.2.4.4. Recent Developments
                                                                      • 16.2.4.5. Financials (Based on Availability)
                                                                    • 16.2.5 Thyssenkrupp AG
                                                                      • 16.2.5.1. Overview
                                                                      • 16.2.5.2. Products
                                                                      • 16.2.5.3. SWOT Analysis
                                                                      • 16.2.5.4. Recent Developments
                                                                      • 16.2.5.5. Financials (Based on Availability)
                                                                    • 16.2.6 Siemens AG
                                                                      • 16.2.6.1. Overview
                                                                      • 16.2.6.2. Products
                                                                      • 16.2.6.3. SWOT Analysis
                                                                      • 16.2.6.4. Recent Developments
                                                                      • 16.2.6.5. Financials (Based on Availability)
                                                                    • 16.2.7 Rolls-Royce plc
                                                                      • 16.2.7.1. Overview
                                                                      • 16.2.7.2. Products
                                                                      • 16.2.7.3. SWOT Analysis
                                                                      • 16.2.7.4. Recent Developments
                                                                      • 16.2.7.5. Financials (Based on Availability)
                                                                    • 16.2.8 Naval Grou
                                                                      • 16.2.8.1. Overview
                                                                      • 16.2.8.2. Products
                                                                      • 16.2.8.3. SWOT Analysis
                                                                      • 16.2.8.4. Recent Developments
                                                                      • 16.2.8.5. Financials (Based on Availability)
                                                                    • 16.2.9 Saab AB
                                                                      • 16.2.9.1. Overview
                                                                      • 16.2.9.2. Products
                                                                      • 16.2.9.3. SWOT Analysis
                                                                      • 16.2.9.4. Recent Developments
                                                                      • 16.2.9.5. Financials (Based on Availability)

                                                              List of Figures

                                                              1. Figure 1: Global Submarine Propulsion Systems Industry Revenue Breakdown (Million, %) by Region 2024 & 2032
                                                              2. Figure 2: North America Submarine Propulsion Systems Industry Revenue (Million), by Country 2024 & 2032
                                                              3. Figure 3: North America Submarine Propulsion Systems Industry Revenue Share (%), by Country 2024 & 2032
                                                              4. Figure 4: Europe Submarine Propulsion Systems Industry Revenue (Million), by Country 2024 & 2032
                                                              5. Figure 5: Europe Submarine Propulsion Systems Industry Revenue Share (%), by Country 2024 & 2032
                                                              6. Figure 6: Asia Pacific Submarine Propulsion Systems Industry Revenue (Million), by Country 2024 & 2032
                                                              7. Figure 7: Asia Pacific Submarine Propulsion Systems Industry Revenue Share (%), by Country 2024 & 2032
                                                              8. Figure 8: Latin America Submarine Propulsion Systems Industry Revenue (Million), by Country 2024 & 2032
                                                              9. Figure 9: Latin America Submarine Propulsion Systems Industry Revenue Share (%), by Country 2024 & 2032
                                                              10. Figure 10: Middle East and Africa Submarine Propulsion Systems Industry Revenue (Million), by Country 2024 & 2032
                                                              11. Figure 11: Middle East and Africa Submarine Propulsion Systems Industry Revenue Share (%), by Country 2024 & 2032
                                                              12. Figure 12: North America Submarine Propulsion Systems Industry Revenue (Million), by Production Analysis 2024 & 2032
                                                              13. Figure 13: North America Submarine Propulsion Systems Industry Revenue Share (%), by Production Analysis 2024 & 2032
                                                              14. Figure 14: North America Submarine Propulsion Systems Industry Revenue (Million), by Consumption Analysis 2024 & 2032
                                                              15. Figure 15: North America Submarine Propulsion Systems Industry Revenue Share (%), by Consumption Analysis 2024 & 2032
                                                              16. Figure 16: North America Submarine Propulsion Systems Industry Revenue (Million), by Import Market Analysis (Value & Volume) 2024 & 2032
                                                              17. Figure 17: North America Submarine Propulsion Systems Industry Revenue Share (%), by Import Market Analysis (Value & Volume) 2024 & 2032
                                                              18. Figure 18: North America Submarine Propulsion Systems Industry Revenue (Million), by Export Market Analysis (Value & Volume) 2024 & 2032
                                                              19. Figure 19: North America Submarine Propulsion Systems Industry Revenue Share (%), by Export Market Analysis (Value & Volume) 2024 & 2032
                                                              20. Figure 20: North America Submarine Propulsion Systems Industry Revenue (Million), by Price Trend Analysis 2024 & 2032
                                                              21. Figure 21: North America Submarine Propulsion Systems Industry Revenue Share (%), by Price Trend Analysis 2024 & 2032
                                                              22. Figure 22: North America Submarine Propulsion Systems Industry Revenue (Million), by Country 2024 & 2032
                                                              23. Figure 23: North America Submarine Propulsion Systems Industry Revenue Share (%), by Country 2024 & 2032
                                                              24. Figure 24: South America Submarine Propulsion Systems Industry Revenue (Million), by Production Analysis 2024 & 2032
                                                              25. Figure 25: South America Submarine Propulsion Systems Industry Revenue Share (%), by Production Analysis 2024 & 2032
                                                              26. Figure 26: South America Submarine Propulsion Systems Industry Revenue (Million), by Consumption Analysis 2024 & 2032
                                                              27. Figure 27: South America Submarine Propulsion Systems Industry Revenue Share (%), by Consumption Analysis 2024 & 2032
                                                              28. Figure 28: South America Submarine Propulsion Systems Industry Revenue (Million), by Import Market Analysis (Value & Volume) 2024 & 2032
                                                              29. Figure 29: South America Submarine Propulsion Systems Industry Revenue Share (%), by Import Market Analysis (Value & Volume) 2024 & 2032
                                                              30. Figure 30: South America Submarine Propulsion Systems Industry Revenue (Million), by Export Market Analysis (Value & Volume) 2024 & 2032
                                                              31. Figure 31: South America Submarine Propulsion Systems Industry Revenue Share (%), by Export Market Analysis (Value & Volume) 2024 & 2032
                                                              32. Figure 32: South America Submarine Propulsion Systems Industry Revenue (Million), by Price Trend Analysis 2024 & 2032
                                                              33. Figure 33: South America Submarine Propulsion Systems Industry Revenue Share (%), by Price Trend Analysis 2024 & 2032
                                                              34. Figure 34: South America Submarine Propulsion Systems Industry Revenue (Million), by Country 2024 & 2032
                                                              35. Figure 35: South America Submarine Propulsion Systems Industry Revenue Share (%), by Country 2024 & 2032
                                                              36. Figure 36: Europe Submarine Propulsion Systems Industry Revenue (Million), by Production Analysis 2024 & 2032
                                                              37. Figure 37: Europe Submarine Propulsion Systems Industry Revenue Share (%), by Production Analysis 2024 & 2032
                                                              38. Figure 38: Europe Submarine Propulsion Systems Industry Revenue (Million), by Consumption Analysis 2024 & 2032
                                                              39. Figure 39: Europe Submarine Propulsion Systems Industry Revenue Share (%), by Consumption Analysis 2024 & 2032
                                                              40. Figure 40: Europe Submarine Propulsion Systems Industry Revenue (Million), by Import Market Analysis (Value & Volume) 2024 & 2032
                                                              41. Figure 41: Europe Submarine Propulsion Systems Industry Revenue Share (%), by Import Market Analysis (Value & Volume) 2024 & 2032
                                                              42. Figure 42: Europe Submarine Propulsion Systems Industry Revenue (Million), by Export Market Analysis (Value & Volume) 2024 & 2032
                                                              43. Figure 43: Europe Submarine Propulsion Systems Industry Revenue Share (%), by Export Market Analysis (Value & Volume) 2024 & 2032
                                                              44. Figure 44: Europe Submarine Propulsion Systems Industry Revenue (Million), by Price Trend Analysis 2024 & 2032
                                                              45. Figure 45: Europe Submarine Propulsion Systems Industry Revenue Share (%), by Price Trend Analysis 2024 & 2032
                                                              46. Figure 46: Europe Submarine Propulsion Systems Industry Revenue (Million), by Country 2024 & 2032
                                                              47. Figure 47: Europe Submarine Propulsion Systems Industry Revenue Share (%), by Country 2024 & 2032
                                                              48. Figure 48: Middle East & Africa Submarine Propulsion Systems Industry Revenue (Million), by Production Analysis 2024 & 2032
                                                              49. Figure 49: Middle East & Africa Submarine Propulsion Systems Industry Revenue Share (%), by Production Analysis 2024 & 2032
                                                              50. Figure 50: Middle East & Africa Submarine Propulsion Systems Industry Revenue (Million), by Consumption Analysis 2024 & 2032
                                                              51. Figure 51: Middle East & Africa Submarine Propulsion Systems Industry Revenue Share (%), by Consumption Analysis 2024 & 2032
                                                              52. Figure 52: Middle East & Africa Submarine Propulsion Systems Industry Revenue (Million), by Import Market Analysis (Value & Volume) 2024 & 2032
                                                              53. Figure 53: Middle East & Africa Submarine Propulsion Systems Industry Revenue Share (%), by Import Market Analysis (Value & Volume) 2024 & 2032
                                                              54. Figure 54: Middle East & Africa Submarine Propulsion Systems Industry Revenue (Million), by Export Market Analysis (Value & Volume) 2024 & 2032
                                                              55. Figure 55: Middle East & Africa Submarine Propulsion Systems Industry Revenue Share (%), by Export Market Analysis (Value & Volume) 2024 & 2032
                                                              56. Figure 56: Middle East & Africa Submarine Propulsion Systems Industry Revenue (Million), by Price Trend Analysis 2024 & 2032
                                                              57. Figure 57: Middle East & Africa Submarine Propulsion Systems Industry Revenue Share (%), by Price Trend Analysis 2024 & 2032
                                                              58. Figure 58: Middle East & Africa Submarine Propulsion Systems Industry Revenue (Million), by Country 2024 & 2032
                                                              59. Figure 59: Middle East & Africa Submarine Propulsion Systems Industry Revenue Share (%), by Country 2024 & 2032
                                                              60. Figure 60: Asia Pacific Submarine Propulsion Systems Industry Revenue (Million), by Production Analysis 2024 & 2032
                                                              61. Figure 61: Asia Pacific Submarine Propulsion Systems Industry Revenue Share (%), by Production Analysis 2024 & 2032
                                                              62. Figure 62: Asia Pacific Submarine Propulsion Systems Industry Revenue (Million), by Consumption Analysis 2024 & 2032
                                                              63. Figure 63: Asia Pacific Submarine Propulsion Systems Industry Revenue Share (%), by Consumption Analysis 2024 & 2032
                                                              64. Figure 64: Asia Pacific Submarine Propulsion Systems Industry Revenue (Million), by Import Market Analysis (Value & Volume) 2024 & 2032
                                                              65. Figure 65: Asia Pacific Submarine Propulsion Systems Industry Revenue Share (%), by Import Market Analysis (Value & Volume) 2024 & 2032
                                                              66. Figure 66: Asia Pacific Submarine Propulsion Systems Industry Revenue (Million), by Export Market Analysis (Value & Volume) 2024 & 2032
                                                              67. Figure 67: Asia Pacific Submarine Propulsion Systems Industry Revenue Share (%), by Export Market Analysis (Value & Volume) 2024 & 2032
                                                              68. Figure 68: Asia Pacific Submarine Propulsion Systems Industry Revenue (Million), by Price Trend Analysis 2024 & 2032
                                                              69. Figure 69: Asia Pacific Submarine Propulsion Systems Industry Revenue Share (%), by Price Trend Analysis 2024 & 2032
                                                              70. Figure 70: Asia Pacific Submarine Propulsion Systems Industry Revenue (Million), by Country 2024 & 2032
                                                              71. Figure 71: Asia Pacific Submarine Propulsion Systems Industry Revenue Share (%), by Country 2024 & 2032

                                                              List of Tables

                                                              1. Table 1: Global Submarine Propulsion Systems Industry Revenue Million Forecast, by Region 2019 & 2032
                                                              2. Table 2: Global Submarine Propulsion Systems Industry Revenue Million Forecast, by Production Analysis 2019 & 2032
                                                              3. Table 3: Global Submarine Propulsion Systems Industry Revenue Million Forecast, by Consumption Analysis 2019 & 2032
                                                              4. Table 4: Global Submarine Propulsion Systems Industry Revenue Million Forecast, by Import Market Analysis (Value & Volume) 2019 & 2032
                                                              5. Table 5: Global Submarine Propulsion Systems Industry Revenue Million Forecast, by Export Market Analysis (Value & Volume) 2019 & 2032
                                                              6. Table 6: Global Submarine Propulsion Systems Industry Revenue Million Forecast, by Price Trend Analysis 2019 & 2032
                                                              7. Table 7: Global Submarine Propulsion Systems Industry Revenue Million Forecast, by Region 2019 & 2032
                                                              8. Table 8: Global Submarine Propulsion Systems Industry Revenue Million Forecast, by Country 2019 & 2032
                                                              9. Table 9: United States Submarine Propulsion Systems Industry Revenue (Million) Forecast, by Application 2019 & 2032
                                                              10. Table 10: Canada Submarine Propulsion Systems Industry Revenue (Million) Forecast, by Application 2019 & 2032
                                                              11. Table 11: Global Submarine Propulsion Systems Industry Revenue Million Forecast, by Country 2019 & 2032
                                                              12. Table 12: United Kingdom Submarine Propulsion Systems Industry Revenue (Million) Forecast, by Application 2019 & 2032
                                                              13. Table 13: France Submarine Propulsion Systems Industry Revenue (Million) Forecast, by Application 2019 & 2032
                                                              14. Table 14: Germany Submarine Propulsion Systems Industry Revenue (Million) Forecast, by Application 2019 & 2032
                                                              15. Table 15: Russia Submarine Propulsion Systems Industry Revenue (Million) Forecast, by Application 2019 & 2032
                                                              16. Table 16: Rest of Europe Submarine Propulsion Systems Industry Revenue (Million) Forecast, by Application 2019 & 2032
                                                              17. Table 17: Global Submarine Propulsion Systems Industry Revenue Million Forecast, by Country 2019 & 2032
                                                              18. Table 18: China Submarine Propulsion Systems Industry Revenue (Million) Forecast, by Application 2019 & 2032
                                                              19. Table 19: India Submarine Propulsion Systems Industry Revenue (Million) Forecast, by Application 2019 & 2032
                                                              20. Table 20: Japan Submarine Propulsion Systems Industry Revenue (Million) Forecast, by Application 2019 & 2032
                                                              21. Table 21: South Korea Submarine Propulsion Systems Industry Revenue (Million) Forecast, by Application 2019 & 2032
                                                              22. Table 22: Rest of Asia Pacific Submarine Propulsion Systems Industry Revenue (Million) Forecast, by Application 2019 & 2032
                                                              23. Table 23: Global Submarine Propulsion Systems Industry Revenue Million Forecast, by Country 2019 & 2032
                                                              24. Table 24: Brazil Submarine Propulsion Systems Industry Revenue (Million) Forecast, by Application 2019 & 2032
                                                              25. Table 25: Rest of Latin America Submarine Propulsion Systems Industry Revenue (Million) Forecast, by Application 2019 & 2032
                                                              26. Table 26: Global Submarine Propulsion Systems Industry Revenue Million Forecast, by Country 2019 & 2032
                                                              27. Table 27: Saudi Arabia Submarine Propulsion Systems Industry Revenue (Million) Forecast, by Application 2019 & 2032
                                                              28. Table 28: United Arab Emirates Submarine Propulsion Systems Industry Revenue (Million) Forecast, by Application 2019 & 2032
                                                              29. Table 29: South Africa Submarine Propulsion Systems Industry Revenue (Million) Forecast, by Application 2019 & 2032
                                                              30. Table 30: Rest of Middle East and Africa Submarine Propulsion Systems Industry Revenue (Million) Forecast, by Application 2019 & 2032
                                                              31. Table 31: Global Submarine Propulsion Systems Industry Revenue Million Forecast, by Production Analysis 2019 & 2032
                                                              32. Table 32: Global Submarine Propulsion Systems Industry Revenue Million Forecast, by Consumption Analysis 2019 & 2032
                                                              33. Table 33: Global Submarine Propulsion Systems Industry Revenue Million Forecast, by Import Market Analysis (Value & Volume) 2019 & 2032
                                                              34. Table 34: Global Submarine Propulsion Systems Industry Revenue Million Forecast, by Export Market Analysis (Value & Volume) 2019 & 2032
                                                              35. Table 35: Global Submarine Propulsion Systems Industry Revenue Million Forecast, by Price Trend Analysis 2019 & 2032
                                                              36. Table 36: Global Submarine Propulsion Systems Industry Revenue Million Forecast, by Country 2019 & 2032
                                                              37. Table 37: United States Submarine Propulsion Systems Industry Revenue (Million) Forecast, by Application 2019 & 2032
                                                              38. Table 38: Canada Submarine Propulsion Systems Industry Revenue (Million) Forecast, by Application 2019 & 2032
                                                              39. Table 39: Mexico Submarine Propulsion Systems Industry Revenue (Million) Forecast, by Application 2019 & 2032
                                                              40. Table 40: Global Submarine Propulsion Systems Industry Revenue Million Forecast, by Production Analysis 2019 & 2032
                                                              41. Table 41: Global Submarine Propulsion Systems Industry Revenue Million Forecast, by Consumption Analysis 2019 & 2032
                                                              42. Table 42: Global Submarine Propulsion Systems Industry Revenue Million Forecast, by Import Market Analysis (Value & Volume) 2019 & 2032
                                                              43. Table 43: Global Submarine Propulsion Systems Industry Revenue Million Forecast, by Export Market Analysis (Value & Volume) 2019 & 2032
                                                              44. Table 44: Global Submarine Propulsion Systems Industry Revenue Million Forecast, by Price Trend Analysis 2019 & 2032
                                                              45. Table 45: Global Submarine Propulsion Systems Industry Revenue Million Forecast, by Country 2019 & 2032
                                                              46. Table 46: Brazil Submarine Propulsion Systems Industry Revenue (Million) Forecast, by Application 2019 & 2032
                                                              47. Table 47: Argentina Submarine Propulsion Systems Industry Revenue (Million) Forecast, by Application 2019 & 2032
                                                              48. Table 48: Rest of South America Submarine Propulsion Systems Industry Revenue (Million) Forecast, by Application 2019 & 2032
                                                              49. Table 49: Global Submarine Propulsion Systems Industry Revenue Million Forecast, by Production Analysis 2019 & 2032
                                                              50. Table 50: Global Submarine Propulsion Systems Industry Revenue Million Forecast, by Consumption Analysis 2019 & 2032
                                                              51. Table 51: Global Submarine Propulsion Systems Industry Revenue Million Forecast, by Import Market Analysis (Value & Volume) 2019 & 2032
                                                              52. Table 52: Global Submarine Propulsion Systems Industry Revenue Million Forecast, by Export Market Analysis (Value & Volume) 2019 & 2032
                                                              53. Table 53: Global Submarine Propulsion Systems Industry Revenue Million Forecast, by Price Trend Analysis 2019 & 2032
                                                              54. Table 54: Global Submarine Propulsion Systems Industry Revenue Million Forecast, by Country 2019 & 2032
                                                              55. Table 55: United Kingdom Submarine Propulsion Systems Industry Revenue (Million) Forecast, by Application 2019 & 2032
                                                              56. Table 56: Germany Submarine Propulsion Systems Industry Revenue (Million) Forecast, by Application 2019 & 2032
                                                              57. Table 57: France Submarine Propulsion Systems Industry Revenue (Million) Forecast, by Application 2019 & 2032
                                                              58. Table 58: Italy Submarine Propulsion Systems Industry Revenue (Million) Forecast, by Application 2019 & 2032
                                                              59. Table 59: Spain Submarine Propulsion Systems Industry Revenue (Million) Forecast, by Application 2019 & 2032
                                                              60. Table 60: Russia Submarine Propulsion Systems Industry Revenue (Million) Forecast, by Application 2019 & 2032
                                                              61. Table 61: Benelux Submarine Propulsion Systems Industry Revenue (Million) Forecast, by Application 2019 & 2032
                                                              62. Table 62: Nordics Submarine Propulsion Systems Industry Revenue (Million) Forecast, by Application 2019 & 2032
                                                              63. Table 63: Rest of Europe Submarine Propulsion Systems Industry Revenue (Million) Forecast, by Application 2019 & 2032
                                                              64. Table 64: Global Submarine Propulsion Systems Industry Revenue Million Forecast, by Production Analysis 2019 & 2032
                                                              65. Table 65: Global Submarine Propulsion Systems Industry Revenue Million Forecast, by Consumption Analysis 2019 & 2032
                                                              66. Table 66: Global Submarine Propulsion Systems Industry Revenue Million Forecast, by Import Market Analysis (Value & Volume) 2019 & 2032
                                                              67. Table 67: Global Submarine Propulsion Systems Industry Revenue Million Forecast, by Export Market Analysis (Value & Volume) 2019 & 2032
                                                              68. Table 68: Global Submarine Propulsion Systems Industry Revenue Million Forecast, by Price Trend Analysis 2019 & 2032
                                                              69. Table 69: Global Submarine Propulsion Systems Industry Revenue Million Forecast, by Country 2019 & 2032
                                                              70. Table 70: Turkey Submarine Propulsion Systems Industry Revenue (Million) Forecast, by Application 2019 & 2032
                                                              71. Table 71: Israel Submarine Propulsion Systems Industry Revenue (Million) Forecast, by Application 2019 & 2032
                                                              72. Table 72: GCC Submarine Propulsion Systems Industry Revenue (Million) Forecast, by Application 2019 & 2032
                                                              73. Table 73: North Africa Submarine Propulsion Systems Industry Revenue (Million) Forecast, by Application 2019 & 2032
                                                              74. Table 74: South Africa Submarine Propulsion Systems Industry Revenue (Million) Forecast, by Application 2019 & 2032
                                                              75. Table 75: Rest of Middle East & Africa Submarine Propulsion Systems Industry Revenue (Million) Forecast, by Application 2019 & 2032
                                                              76. Table 76: Global Submarine Propulsion Systems Industry Revenue Million Forecast, by Production Analysis 2019 & 2032
                                                              77. Table 77: Global Submarine Propulsion Systems Industry Revenue Million Forecast, by Consumption Analysis 2019 & 2032
                                                              78. Table 78: Global Submarine Propulsion Systems Industry Revenue Million Forecast, by Import Market Analysis (Value & Volume) 2019 & 2032
                                                              79. Table 79: Global Submarine Propulsion Systems Industry Revenue Million Forecast, by Export Market Analysis (Value & Volume) 2019 & 2032
                                                              80. Table 80: Global Submarine Propulsion Systems Industry Revenue Million Forecast, by Price Trend Analysis 2019 & 2032
                                                              81. Table 81: Global Submarine Propulsion Systems Industry Revenue Million Forecast, by Country 2019 & 2032
                                                              82. Table 82: China Submarine Propulsion Systems Industry Revenue (Million) Forecast, by Application 2019 & 2032
                                                              83. Table 83: India Submarine Propulsion Systems Industry Revenue (Million) Forecast, by Application 2019 & 2032
                                                              84. Table 84: Japan Submarine Propulsion Systems Industry Revenue (Million) Forecast, by Application 2019 & 2032
                                                              85. Table 85: South Korea Submarine Propulsion Systems Industry Revenue (Million) Forecast, by Application 2019 & 2032
                                                              86. Table 86: ASEAN Submarine Propulsion Systems Industry Revenue (Million) Forecast, by Application 2019 & 2032
                                                              87. Table 87: Oceania Submarine Propulsion Systems Industry Revenue (Million) Forecast, by Application 2019 & 2032
                                                              88. Table 88: Rest of Asia Pacific Submarine Propulsion Systems Industry Revenue (Million) Forecast, by Application 2019 & 2032


                                                              Frequently Asked Questions

                                                              1. What is the projected Compound Annual Growth Rate (CAGR) of the Submarine Propulsion Systems Industry?

                                                              The projected CAGR is approximately 3.53%.

                                                              2. Which companies are prominent players in the Submarine Propulsion Systems Industry?

                                                              Key companies in the market include BWX Technolgies Inc, General Dynamics Corporation, Ultra Electronics Holdings plc, ECA Group, Thyssenkrupp AG, Siemens AG, Rolls-Royce plc, Naval Grou, Saab AB.

                                                              3. What are the main segments of the Submarine Propulsion Systems Industry?

                                                              The market segments include Production Analysis, Consumption Analysis, Import Market Analysis (Value & Volume), Export Market Analysis (Value & Volume), Price Trend Analysis.

                                                              4. Can you provide details about the market size?

                                                              The market size is estimated to be USD 8.03 Million as of 2022.

                                                              5. What are some drivers contributing to market growth?

                                                              N/A

                                                              6. What are the notable trends driving market growth?

                                                              The Military Segment is Projected to Dominate the Market During the Forecast Period.

                                                              7. Are there any restraints impacting market growth?

                                                              N/A

                                                              8. Can you provide examples of recent developments in the market?

                                                              N/A

                                                              9. What pricing options are available for accessing the report?

                                                              Pricing options include single-user, multi-user, and enterprise licenses priced at USD 4750, USD 5250, and USD 8750 respectively.

                                                              10. Is the market size provided in terms of value or volume?

                                                              The market size is provided in terms of value, measured in Million.

                                                              11. Are there any specific market keywords associated with the report?

                                                              Yes, the market keyword associated with the report is "Submarine Propulsion Systems Industry," which aids in identifying and referencing the specific market segment covered.

                                                              12. How do I determine which pricing option suits my needs best?

                                                              The pricing options vary based on user requirements and access needs. Individual users may opt for single-user licenses, while businesses requiring broader access may choose multi-user or enterprise licenses for cost-effective access to the report.

                                                              13. Are there any additional resources or data provided in the Submarine Propulsion Systems Industry report?

                                                              While the report offers comprehensive insights, it's advisable to review the specific contents or supplementary materials provided to ascertain if additional resources or data are available.

                                                              14. How can I stay updated on further developments or reports in the Submarine Propulsion Systems Industry?

                                                              To stay informed about further developments, trends, and reports in the Submarine Propulsion Systems Industry, consider subscribing to industry newsletters, following relevant companies and organizations, or regularly checking reputable industry news sources and publications.


                                                              Methodology

                                                              Step 1 - Identification of Relevant Samples Size from Population Database

                                                              Step Chart
                                                              Bar Chart
                                                              Method Chart

                                                              Step 2 - Approaches for Defining Global Market Size (Value, Volume* & Price*)

                                                              Approach Chart
                                                              Top-down and bottom-up approaches are used to validate the global market size and estimate the market size for manufactures, regional segments, product, and application.

                                                              Note*: In applicable scenarios

                                                              Step 3 - Data Sources

                                                              Primary Research

                                                              • Web Analytics
                                                              • Survey Reports
                                                              • Research Institute
                                                              • Latest Research Reports
                                                              • Opinion Leaders

                                                              Secondary Research

                                                              • Annual Reports
                                                              • White Paper
                                                              • Latest Press Release
                                                              • Industry Association
                                                              • Paid Database
                                                              • Investor Presentations
                                                              Analyst Chart

                                                              Step 4 - Data Triangulation

                                                              Involves using different sources of information in order to increase the validity of a study

                                                              These sources are likely to be stakeholders in a program - participants, other researchers, program staff, other community members, and so on.

                                                              Then we put all data in single framework & apply various statistical tools to find out the dynamic on the market.

                                                              During the analysis stage, feedback from the stakeholder groups would be compared to determine areas of agreement as well as areas of divergence

                                                              Additionally, after gathering mixed and scattered data from a wide range of sources, data is triangulated and correlated to come up with estimated figures which are further validated through primary mediums or industry experts, opinion leaders.

                                                              About Research Axiom

                                                              Research Axiom delivers in-depth market research, industry analysis, and consulting for pharmaceuticals, automotive, IT, and consumer goods. Our reports provide the clarity you need to make informed decisions and drive innovation.

                                                              Our team combines primary research, advanced analytics, and sector expertise to deliver actionable intelligence. We offer syndicated reports, custom research, and consulting services tailored to your business needs.

                                                              At Research Axiom, we are committed to quality, transparency, and client satisfaction. Every report is rigorously validated to ensure accuracy and relevance. Our global perspective and local expertise help you understand both the big picture and the finer details of your market.

                                                              Stay informed with Research Axiom. Subscribe to our newsletter for the latest updates and research highlights, and follow us on social media for real-time insights. Research Axiom – Turning Data into Business Advantage.

                                                              artwork spiralartwork spiralRelated Reports
                                                              artwork underline

                                                              Aerospace Plastics Industry Market Outlook and Strategic Insights

                                                              The Aerospace Plastics Market is booming, projected to reach $25 billion by 2033 at a CAGR of 7.66%. Driven by lightweighting and fuel efficiency demands, this report analyzes market trends, key players (Premium AEROTEC, Toray Industries), regional growth (North America, Asia-Pacific), and segment applications (aerostructures, cabin interiors). Discover insights into this rapidly expanding sector.

                                                              July 2025
                                                              Base Year: 2024
                                                              No Of Pages: 234
                                                              Price: $4750

                                                              Challenges to Overcome in Commercial Airport Lighting Market Market Growth: Analysis 2025-2033

                                                              The commercial airport lighting market is booming, projected to reach [estimated 2033 market size] by 2033, driven by LED adoption and infrastructure expansion. Learn about market trends, key players (Honeywell, ADB SAFEGATE, etc.), and regional growth in this in-depth analysis.

                                                              July 2025
                                                              Base Year: 2024
                                                              No Of Pages: 234
                                                              Price: $4750

                                                              North America Small Satellite Market 2025-2033 Trends: Unveiling Growth Opportunities and Competitor Dynamics

                                                              The North American small satellite market is booming, with a projected CAGR of 5.18% through 2033. Driven by commercial and government demand for Earth observation, communication, and navigation, this report analyzes market size, key players (SpaceX, Swarm Technologies, etc.), and emerging trends in LEO, GEO, and MEO satellite technology. Discover the opportunities and challenges shaping this dynamic sector.

                                                              July 2025
                                                              Base Year: 2024
                                                              No Of Pages: 197
                                                              Price: $3800

                                                              Aircraft Door Market CAGR Growth Drivers and Trends: Forecasts 2025-2033

                                                              The aircraft door market is booming, projected to reach $8.48 billion by 2033 at a CAGR of 5.69%. This in-depth analysis explores market drivers, trends, restraints, segmentation (commercial, military, general aviation; passenger, cargo, emergency doors), key players (Safran, Collins Aerospace, etc.), and regional growth forecasts. Discover the opportunities and challenges shaping this dynamic sector.

                                                              July 2025
                                                              Base Year: 2024
                                                              No Of Pages: 234
                                                              Price: $4750

                                                              Future-Forward Strategies for EMEA Aviation Infrastructure Industry Industry

                                                              The EMEA aviation infrastructure market is booming, projected to reach $1.47 billion by 2033 with a 4.42% CAGR. Discover key market trends, drivers, restraints, and major players shaping this dynamic sector. Explore regional breakdowns and infrastructure segment analyses.

                                                              July 2025
                                                              Base Year: 2024
                                                              No Of Pages: 234
                                                              Price: $4750

                                                              APAC Military Aircraft Modernization and Retrofit Market 2025 Market Trends and 2033 Forecasts: Exploring Growth Potential

                                                              The APAC military aircraft modernization and retrofit market is booming, projected to reach $13.71 billion by 2025, driven by geopolitical tensions and technological advancements. Learn about key market trends, major players, and growth forecasts until 2033.

                                                              July 2025
                                                              Base Year: 2024
                                                              No Of Pages: 197
                                                              Price: $3800

                                                              Future-Ready Strategies for North America Charter Jet Services Market Market Growth

                                                              The North America charter jet services market is booming, projected to reach \$24.2 billion by 2033 with a 9.1% CAGR. Discover key trends, drivers, and leading companies shaping this lucrative private aviation sector. Learn about market segmentation by aircraft size and regional analysis focusing on the US, Canada, and Mexico.

                                                              July 2025
                                                              Base Year: 2024
                                                              No Of Pages: 234
                                                              Price: $4750

                                                              Middle East Aviation Market Report Probes the XXX Million Size, Share, Growth Report and Future Analysis by 2033

                                                              The Middle East aviation market, a $27.18 billion industry in 2025, is booming. Discover key trends, growth drivers (tourism, infrastructure investments), and leading companies shaping this rapidly expanding sector with a projected 4.40% CAGR until 2033. Explore regional market shares and future projections for commercial, military, and general aviation.

                                                              July 2025
                                                              Base Year: 2024
                                                              No Of Pages: 234
                                                              Price: $4750

                                                              Commercial Airport Radar Systems Industry Future-proof Strategies: Trends, Competitor Dynamics, and Opportunities 2025-2033

                                                              The Commercial Airport Radar Systems market is booming, projected to reach $5.98B in 2025 with a 7.48% CAGR. Discover key trends, drivers, restraints, and leading companies shaping this vital sector for air traffic management. Learn about market segmentation by application (surveillance, weather, approach radars) and regional analysis.

                                                              July 2025
                                                              Base Year: 2024
                                                              No Of Pages: 234
                                                              Price: $4750

                                                              Market Deep Dive: Exploring Defense Aircraft Materials Market Trends 2025-2033

                                                              Discover the booming defense aircraft materials market! This comprehensive analysis reveals key trends, drivers, and restraints impacting growth through 2033, covering materials like aluminum alloys, titanium, and composites, and major players like Toray and DuPont. Explore regional market shares and forecast data.

                                                              July 2025
                                                              Base Year: 2024
                                                              No Of Pages: 234
                                                              Price: $4750

                                                              Future Trends Shaping Naval ISR Market Growth

                                                              Discover the booming Naval ISR market, projected to reach $XX million by 2033 with a 3.5% CAGR. Explore market drivers, trends, and key players like Lockheed Martin and General Dynamics. Learn about regional growth in North America, Europe, and Asia-Pacific. Get the insights you need for strategic planning.

                                                              July 2025
                                                              Base Year: 2024
                                                              No Of Pages: 234
                                                              Price: $4750

                                                              Latin America Inflight Services Market Market’s Growth Blueprint

                                                              Discover the booming Latin American inflight services market! This comprehensive analysis reveals a $1.11B market in 2025, projecting 9.91% CAGR growth to 2033. Explore key drivers, trends, and challenges impacting airlines, catering companies, and passenger experiences. Learn about market segmentation, leading players, and regional opportunities.

                                                              July 2025
                                                              Base Year: 2024
                                                              No Of Pages: 234
                                                              Price: $4750

                                                              Airport Ground Handling Vehicles Industry 2025-2033 Trends: Unveiling Growth Opportunities and Competitor Dynamics

                                                              The Airport Ground Handling Vehicles market is booming, projected to reach $8.94B by 2025 with a 5.99% CAGR. Discover key trends, drivers, and restraints shaping this industry, including the rise of electric vehicles and regional market analysis. Learn about leading companies and future growth forecasts.

                                                              July 2025
                                                              Base Year: 2024
                                                              No Of Pages: 234
                                                              Price: $4750

                                                              Exploring Opportunities in Naval Gas Turbine Market Sector

                                                              Discover the booming Naval Gas Turbine Market, projected to reach $X million by 2033 with a CAGR exceeding 7.80%. Explore market drivers, trends, restraints, key players (GE, Rolls Royce, Mitsubishi), and regional analysis (North America, Europe, Asia-Pacific). Get the insights you need to navigate this high-growth sector.

                                                              July 2025
                                                              Base Year: 2024
                                                              No Of Pages: 234
                                                              Price: $4750

                                                              Middle East Civil Aviation Flight Training and Simulation Market in Emerging Markets: Analysis and Projections 2025-2033

                                                              The Middle East Civil Aviation Flight Training & Simulation Market is booming, with a CAGR exceeding 15%! Discover key trends, drivers, restraints, and leading companies shaping this lucrative sector. Explore market size projections to 2033 and regional breakdowns for the UAE, Saudi Arabia, and more.

                                                              July 2025
                                                              Base Year: 2024
                                                              No Of Pages: 234
                                                              Price: $4750

                                                              Aircraft Winglets Market Market Expansion: Growth Outlook 2025-2033

                                                              The Aircraft Winglets Market is booming, projected to reach \$4.78 billion by 2033, with a CAGR of 7.90%. This report analyzes market drivers, trends, and key players like Aviation Partners Boeing and BLR Aerospace, offering insights into fuel-efficient aviation technologies.

                                                              July 2025
                                                              Base Year: 2024
                                                              No Of Pages: 234
                                                              Price: $4750

                                                              SATCOM Industry Market Expansion Strategies

                                                              The global SATCOM market is booming, with a projected 23.54% CAGR through 2033. Driven by IoT, cloud computing, and government initiatives, this report analyzes market size, segments (LEO, GEO, MEO, satellite mass), key players (SpaceX, Intelsat, Airbus), and regional trends. Discover the future of satellite communication!

                                                              July 2025
                                                              Base Year: 2024
                                                              No Of Pages: 197
                                                              Price: $3800

                                                              Aircraft Health Monitoring Systems Industry 2025-2033 Analysis: Trends, Competitor Dynamics, and Growth Opportunities

                                                              The Aircraft Health Monitoring Systems market is booming, projected to reach $2.39 billion by 2033 with a CAGR of 6%. This report analyzes market drivers, trends, restraints, key players (Safran, Honeywell, Meggitt), and regional growth, focusing on technologies like AI and predictive maintenance. Explore the future of aviation safety and efficiency.

                                                              July 2025
                                                              Base Year: 2024
                                                              No Of Pages: 234
                                                              Price: $4750

                                                              Exploring Europe Non-Lethal Weapons Industry Market Ecosystem: Insights to 2033

                                                              Discover the booming European non-lethal weapons market. This in-depth analysis reveals key trends, drivers, and restraints impacting growth through 2033, covering market size, CAGR, leading companies, and regional breakdowns. Learn about the future of less-lethal technologies in law enforcement and military applications.

                                                              July 2025
                                                              Base Year: 2024
                                                              No Of Pages: 210
                                                              Price: $4750

                                                              Man-portable Military Communication Systems Market Insights: Growth at XX CAGR Through 2033

                                                              The booming man-portable military communication systems market is projected to reach \$XX million by 2033, driven by rising defense spending and technological advancements. Explore key trends, drivers, restraints, and leading companies shaping this dynamic sector. Learn more about satellite & radio communication system growth and regional market shares.

                                                              July 2025
                                                              Base Year: 2024
                                                              No Of Pages: 234
                                                              Price: $4750
                                                              • Home
                                                              • About Us
                                                              • Industries
                                                                • Aerospace & Defense
                                                                • Agriculture
                                                                • Animal Nutrition & Wellness
                                                                • Automotive
                                                                • Chemicals & Materials
                                                                • Consumer Goods and Services
                                                                • Energy & Power
                                                                • Financial Services and Investment Intelligence
                                                                • Food & Beverage
                                                                • Home and Property Improvement
                                                                • Hospitality and Tourism
                                                                • Logistics
                                                                • Manufacturing Products and Services
                                                                • Packaging
                                                                • Professional and Commercial Services
                                                                • Real Estate and Construction
                                                                • Retail
                                                                • Technology, Media and Telecom
                                                                • Healthcare
                                                              • Services
                                                              • Contact
                                                              Main Logo
                                                              • Home
                                                              • About Us
                                                              • Industries
                                                                • Aerospace & Defense
                                                                • Agriculture
                                                                • Animal Nutrition & Wellness
                                                                • Automotive
                                                                • Chemicals & Materials
                                                                • Consumer Goods and Services
                                                                • Energy & Power
                                                                • Financial Services and Investment Intelligence
                                                                • Food & Beverage
                                                                • Home and Property Improvement
                                                                • Hospitality and Tourism
                                                                • Logistics
                                                                • Manufacturing Products and Services
                                                                • Packaging
                                                                • Professional and Commercial Services
                                                                • Real Estate and Construction
                                                                • Retail
                                                                • Technology, Media and Telecom
                                                                • Healthcare
                                                              • Services
                                                              • Contact
                                                              +17162654855
                                                              [email protected]

                                                              +17162654855

                                                              [email protected]

                                                              Business Address

                                                              Head Office

                                                              Office no. A 5010, fifth floor, Solitaire Business Hub, Near Phoenix mall, Pune, Maharashtra 411014

                                                              Contact Information

                                                              Craig Francis

                                                              Business Development Head

                                                              +17162654855

                                                              [email protected]

                                                              Connect With Us

                                                              Secure Payment Partners

                                                              payment image
                                                              RetailLogisticsPackagingAutomotiveHealthcareAgricultureEnergy & PowerFood & BeverageAerospace & DefenseChemicals & MaterialsHospitality and TourismAnimal Nutrition & WellnessConsumer Goods and ServicesReal Estate and ConstructionHome and Property ImprovementTechnology, Media and TelecomManufacturing Products and ServicesFinancial Services and Investment Intelligence

                                                              © 2025 All rights reserved


                                                              Privacy Policy
                                                              Terms and Conditions
                                                              FAQ