Key Insights
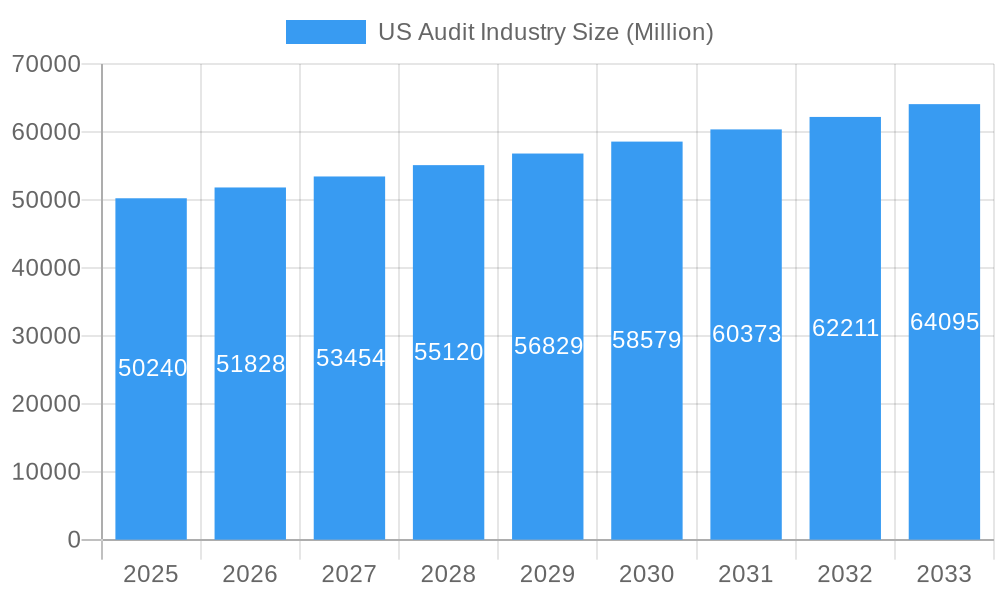
The US audit industry, a cornerstone of financial accountability and transparency, boasts a robust market size of $50.24 billion in 2025. Fueled by increasing regulatory scrutiny, the growing complexity of financial reporting, and the rise of data analytics in auditing, the sector exhibits a steady Compound Annual Growth Rate (CAGR) of 3.27% from 2019 to 2033. This growth trajectory is underpinned by several key drivers. Firstly, heightened investor demand for reliable financial information necessitates thorough and independent audits, boosting demand for services. Secondly, the increasing adoption of advanced technologies like AI and machine learning within auditing firms enhances efficiency and accuracy, thereby attracting more clients. However, the industry faces challenges. Intense competition among established firms like Deloitte, EY, KPMG, PwC, RSM US, Grant Thornton LLP, A T Kearney, BDO USA, CBIZ, Mayer Hoffman McCann, and Crowe Horwath (among others) creates pricing pressures. Furthermore, evolving regulatory landscapes and the need for continuous upskilling to adapt to new technologies present ongoing hurdles. Segmentation within the market is likely driven by industry specialization (e.g., financial services, healthcare, technology), firm size (Big Four vs. regional firms), and service offerings (e.g., financial statement audits, internal audits, cybersecurity audits). The geographic distribution of revenue is likely concentrated in major metropolitan areas with significant business activity. The projected growth indicates a promising outlook for the industry, but navigating competition and adapting to technological advancements will be crucial for sustained success.
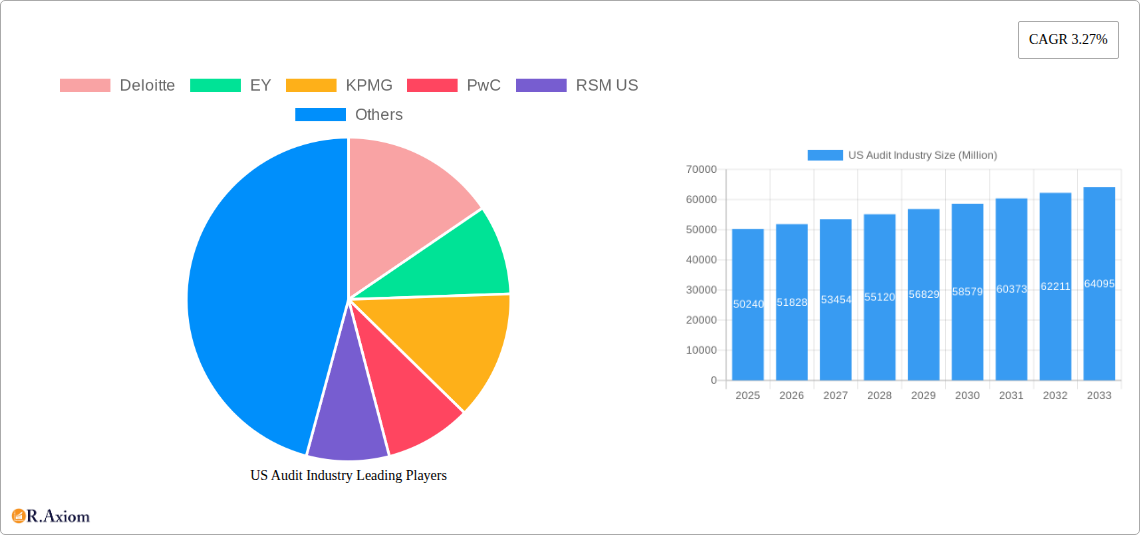
US Audit Industry Market Size (In Billion)
The forecast period of 2025-2033 suggests continued growth, propelled by increasing global interconnectedness and the associated complexity in financial transactions. While the impact of economic downturns cannot be ignored, the demand for assurance and compliance services tends to remain relatively stable, even during economic uncertainty. The ongoing focus on corporate governance and risk management further strengthens the fundamental need for robust audit practices. To capitalize on future opportunities, firms are likely to prioritize investments in technology and talent development, fostering expertise in emerging areas like data analytics, cybersecurity, and sustainability reporting. This will solidify their position within an increasingly competitive yet vital market landscape.
US Audit Industry Company Market Share
US Audit Industry Market Report: 2019-2033
This comprehensive report provides a detailed analysis of the US Audit Industry, covering market size, growth projections, competitive landscape, and key technological advancements from 2019 to 2033. The report utilizes data from the historical period (2019-2024), the base year (2025), and projects the market through the forecast period (2025-2033). It offers actionable insights for industry stakeholders, investors, and businesses seeking to understand and navigate this dynamic market. The total market size in 2025 is estimated at $XX Million.
US Audit Industry Market Concentration & Innovation
The US audit industry is characterized by high concentration, with the "Big Four" firms – Deloitte, EY, KPMG, and PwC – commanding a significant majority of the market share. While precise figures fluctuate, their combined share consistently exceeds 80%, leaving a smaller portion for national and regional firms like RSM US, Grant Thornton LLP, BDO USA, CBIZ, Mayer Hoffman McCann, and Crowe Horwath. This high concentration leads to intense competition, fostering innovation and driving efficiency improvements.
However, the industry also faces pressures from regulatory changes like the Sarbanes-Oxley Act (SOX) and increasing scrutiny from oversight bodies, influencing both market structure and service offerings. Technological advancements such as AI and machine learning are disrupting traditional audit practices, creating opportunities for innovation and differentiation. M&A activity in the industry is relatively frequent, particularly among mid-tier firms seeking to expand their service offerings and geographic reach. Deal values vary, ranging from several million dollars to hundreds of millions depending on the size and scope of the acquired firms. For example, xx number of M&A deals closed in 2024 with a total value of $xx Million. Emerging technologies are being adopted to improve audit efficiency, risk assessment, and data analytics capabilities leading to both opportunities and challenges for existing and new players. End-user preferences are also shifting toward more data-driven insights and proactive risk management services, creating further dynamics.
US Audit Industry Industry Trends & Insights
The US audit industry is experiencing robust and consistent expansion. This growth is primarily fueled by increasingly stringent regulatory compliance mandates, the inherent complexities of modern financial reporting frameworks, and a rising demand for independent assurance services across a diverse spectrum of industries. From 2019 to 2024, the market demonstrated a significant compound annual growth rate (CAGR) of approximately [Insert specific CAGR percentage here]. Projections indicate this strong growth will persist into the forecast period, albeit at a slightly more moderate pace.
While market penetration is already high within established sectors, substantial opportunities are emerging in rapidly developing industries and specialized niche markets. Technological advancements, most notably the transformative integration of Artificial Intelligence (AI) and sophisticated data analytics, are fundamentally reshaping audit methodologies. These innovations are leading to enhanced efficiency, more profound insights, and a higher overall quality of audit services. Concurrently, client expectations are evolving, with a growing preference for transparent, data-driven, and demonstrably value-added audit engagements.
The competitive landscape is characterized by strategic collaborations, a relentless pursuit of technological innovation, and a critical focus on attracting and retaining top-tier talent. The market is also undergoing a notable shift towards embracing cloud-based solutions and automating repetitive tasks. This digital transformation presents both challenges and significant opportunities, compelling smaller audit firms to adapt their strategies and technological investments to remain competitive against larger entities with more advanced capabilities.
Dominant Markets & Segments in US Audit Industry
The US audit industry is largely dominated by the national market, with major metropolitan areas such as New York, Los Angeles, Chicago, and San Francisco serving as key hubs. These areas boast a concentration of large corporations requiring sophisticated audit services and a significant pool of skilled professionals.
- Key Drivers of Dominance:
- High concentration of large corporations requiring auditing services.
- Presence of skilled workforce and specialized expertise.
- Robust financial infrastructure and regulatory environment.
- Strong economic activity and growth opportunities.
The industry is segmented by service type (assurance, tax, advisory), industry sector (financial services, healthcare, technology), and company size (large, mid-size, small). While assurance services continue to form a substantial portion, there's a significant and growing demand for advisory services, reflecting a shift towards proactive risk management and business consulting. The financial services sector remains a prominent market segment due to stringent regulatory requirements and complexity of financial instruments.
US Audit Industry Product Developments
Recent advancements in product development within the US audit industry are predominantly driven by the strategic integration of technology. The core objectives are to significantly boost operational efficiency, elevate data analytics capabilities, and deliver more comprehensive, value-added services to clients. This includes the widespread adoption of AI-powered tools designed for advanced risk assessment, the implementation of automated workflows to streamline routine audit procedures, and the deployment of sophisticated data visualization platforms for the clear and impactful presentation of audit findings.
Achieving a competitive edge in this evolving market hinges on the ability of audit firms to seamlessly integrate these cutting-edge technologies while rigorously upholding the highest audit standards and maintaining essential human oversight and professional judgment.
Report Scope & Segmentation Analysis
This comprehensive report analyzes the US audit industry by segmenting it into key categories: service type (encompassing assurance, tax, and consulting services), company size (categorized as large, mid-size, and small firms), and industry sector (including, but not limited to, financial services, healthcare, and technology). Each identified segment exhibits distinct growth trajectories and unique competitive dynamics.
Assurance services currently represent the largest and most significant segment of the market, largely propelled by the persistent demand for regulatory compliance. The consulting segment, however, is experiencing notable growth, reflecting the escalating client demand for proactive risk management strategies and expert business advisory services. The report provides detailed market size estimations and growth projections for each segment, clearly outlining their individual contributions to the overall market value. Furthermore, it offers an in-depth assessment of the competitive landscapes within each segment, evaluating the distinct strengths and potential weaknesses of the various market players.
Key Drivers of US Audit Industry Growth
Several key factors are driving growth in the US audit industry. Stringent regulatory compliance requirements, particularly under SOX, necessitate regular and comprehensive audits. The increasing complexity of financial reporting and business operations necessitates specialized auditing skills and advanced technologies. The growing demand for proactive risk management and business advisory services has broadened the service offerings beyond traditional audits. The adoption of new technologies like AI and machine learning to improve efficiency and analytical capabilities is fostering market expansion. Finally, economic growth and the expansion of various industry sectors contribute to the increased demand for auditing services.
Challenges in the US Audit Industry Sector
The US audit industry faces several challenges. Intense competition among firms, particularly among the Big Four and other national firms, creates pressure on pricing and profit margins. Maintaining auditor independence and avoiding conflicts of interest is paramount, especially given increased regulatory scrutiny. Attracting and retaining skilled professionals is essential in an evolving technological landscape requiring specialized expertise. The industry also faces increasing cybersecurity risks, demanding robust security measures to protect client data. Finally, regulatory changes and their implementation can create complexities and costs for audit firms. These challenges can impact the overall profitability and sustainability of the firms.
Emerging Opportunities in US Audit Industry
The US audit industry presents several promising opportunities. The expanding use of AI and machine learning opens avenues for increased efficiency, enhanced risk assessment, and development of innovative audit solutions. The growing demand for data analytics and cybersecurity services provides opportunities for firms to expand their service portfolios. Focus on niche markets, such as those in emerging technologies or sustainable business practices, presents potential for market expansion. Finally, strategic partnerships and mergers can provide growth opportunities for firms.
Key Developments in US Audit Industry Industry
- May 2023: Deloitte and Google Cloud strengthened their alliance, integrating Google Cloud's Generative AI capabilities into audit services. This boosts Deloitte's efficiency and analytical power.
- May 2023: EY launched over 20 new Assurance technology capabilities after partnering with Microsoft, part of a $1 Billion investment in next-generation Assurance technology. This significantly enhances EY's technological edge and service offerings.
Strategic Outlook for US Audit Industry Market
The US audit industry is strategically positioned for sustained and significant growth. This upward trajectory is propelled by rapid technological advancements, an ever-evolving regulatory environment, and the escalating demand for both assurance and advisory services. The continued integration of AI, advanced data analytics, and cloud-based solutions will undoubtedly remain central to shaping the industry's future, presenting a dual landscape of challenges and substantial opportunities.
Audit firms that proactively embrace these technological shifts, invest judiciously in talent development and continuous learning, and effectively leverage technology to enhance their service delivery models will be best equipped to achieve lasting success. The market is also anticipated to witness ongoing consolidation, with larger, established firms strategically acquiring smaller entities to broaden their service portfolios and expand their geographic reach. For all players, a steadfast focus on delivering demonstrable value-added services and prioritizing proactive risk management will be paramount in securing and growing market share.
US Audit Industry Segmentation
-
1. Type
- 1.1. Internal Audit
- 1.2. External Audit
-
2. Service line
- 2.1. Operational Audits
- 2.2. Financial Audits
- 2.3. Advisory and Consulting
- 2.4. Investigation Audit
- 2.5. Information System Audit
- 2.6. Compliance Audit
- 2.7. Other
US Audit Industry Segmentation By Geography
-
1. North America
- 1.1. United States
- 1.2. Canada
- 1.3. Mexico
-
2. South America
- 2.1. Brazil
- 2.2. Argentina
- 2.3. Rest of South America
-
3. Europe
- 3.1. United Kingdom
- 3.2. Germany
- 3.3. France
- 3.4. Italy
- 3.5. Spain
- 3.6. Russia
- 3.7. Benelux
- 3.8. Nordics
- 3.9. Rest of Europe
-
4. Middle East & Africa
- 4.1. Turkey
- 4.2. Israel
- 4.3. GCC
- 4.4. North Africa
- 4.5. South Africa
- 4.6. Rest of Middle East & Africa
-
5. Asia Pacific
- 5.1. China
- 5.2. India
- 5.3. Japan
- 5.4. South Korea
- 5.5. ASEAN
- 5.6. Oceania
- 5.7. Rest of Asia Pacific
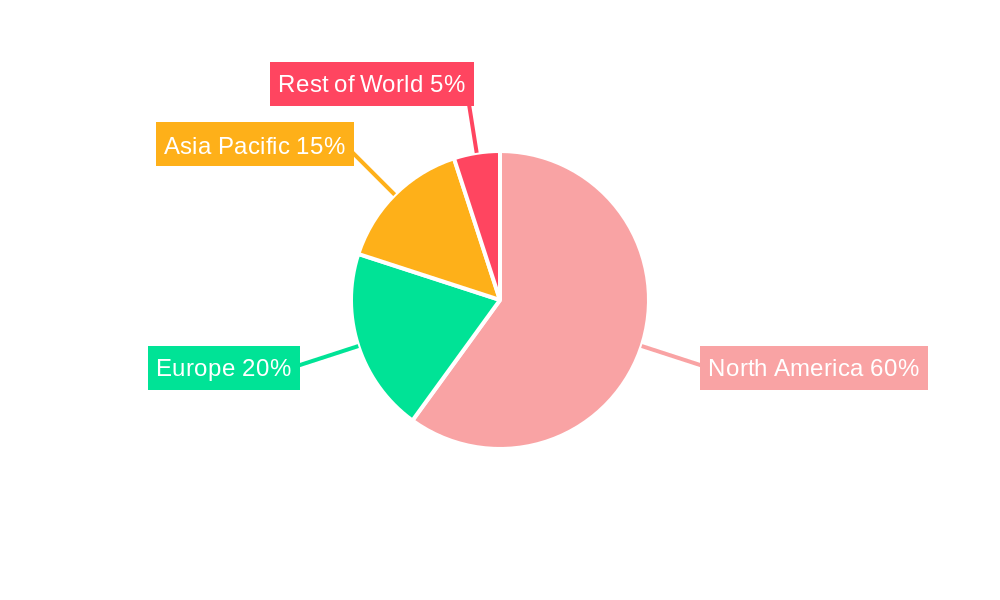
US Audit Industry Regional Market Share
Geographic Coverage of US Audit Industry
US Audit Industry REPORT HIGHLIGHTS
| Aspects | Details |
|---|---|
| Study Period | 2020-2034 |
| Base Year | 2025 |
| Estimated Year | 2026 |
| Forecast Period | 2026-2034 |
| Historical Period | 2020-2025 |
| Growth Rate | CAGR of 3.27% from 2020-2034 |
| Segmentation |
|
Table of Contents
- 1. Introduction
- 1.1. Research Scope
- 1.2. Market Segmentation
- 1.3. Research Objective
- 1.4. Definitions and Assumptions
- 2. Executive Summary
- 2.1. Market Snapshot
- 3. Market Dynamics
- 3.1. Market Drivers
- 3.2. Market Restrains
- 3.3. Market Trends
- 3.4. Market Opportunities
- 4. Market Factor Analysis
- 4.1. Porters Five Forces
- 4.1.1. Bargaining Power of Suppliers
- 4.1.2. Bargaining Power of Buyers
- 4.1.3. Threat of New Entrants
- 4.1.4. Threat of Substitutes
- 4.1.5. Competitive Rivalry
- 4.2. PESTEL analysis
- 4.3. BCG Analysis
- 4.3.1. Stars (High Growth, High Market Share)
- 4.3.2. Cash Cows (Low Growth, High Market Share)
- 4.3.3. Question Mark (High Growth, Low Market Share)
- 4.3.4. Dogs (Low Growth, Low Market Share)
- 4.4. Ansoff Matrix Analysis
- 4.5. Supply Chain Analysis
- 4.6. Regulatory Landscape
- 4.7. Current Market Potential and Opportunity Assessment (TAM–SAM–SOM Framework)
- 4.8. RAX Analyst Note
- 4.1. Porters Five Forces
- 5. Market Analysis, Insights and Forecast 2021-2033
- 5.1. Market Analysis, Insights and Forecast - by Type
- 5.1.1. Internal Audit
- 5.1.2. External Audit
- 5.2. Market Analysis, Insights and Forecast - by Service line
- 5.2.1. Operational Audits
- 5.2.2. Financial Audits
- 5.2.3. Advisory and Consulting
- 5.2.4. Investigation Audit
- 5.2.5. Information System Audit
- 5.2.6. Compliance Audit
- 5.2.7. Other
- 5.3. Market Analysis, Insights and Forecast - by Region
- 5.3.1. North America
- 5.3.2. South America
- 5.3.3. Europe
- 5.3.4. Middle East & Africa
- 5.3.5. Asia Pacific
- 5.1. Market Analysis, Insights and Forecast - by Type
- 6. Global US Audit Industry Analysis, Insights and Forecast, 2021-2033
- 6.1. Market Analysis, Insights and Forecast - by Type
- 6.1.1. Internal Audit
- 6.1.2. External Audit
- 6.2. Market Analysis, Insights and Forecast - by Service line
- 6.2.1. Operational Audits
- 6.2.2. Financial Audits
- 6.2.3. Advisory and Consulting
- 6.2.4. Investigation Audit
- 6.2.5. Information System Audit
- 6.2.6. Compliance Audit
- 6.2.7. Other
- 6.1. Market Analysis, Insights and Forecast - by Type
- 7. North America US Audit Industry Analysis, Insights and Forecast, 2020-2032
- 7.1. Market Analysis, Insights and Forecast - by Type
- 7.1.1. Internal Audit
- 7.1.2. External Audit
- 7.2. Market Analysis, Insights and Forecast - by Service line
- 7.2.1. Operational Audits
- 7.2.2. Financial Audits
- 7.2.3. Advisory and Consulting
- 7.2.4. Investigation Audit
- 7.2.5. Information System Audit
- 7.2.6. Compliance Audit
- 7.2.7. Other
- 7.1. Market Analysis, Insights and Forecast - by Type
- 8. South America US Audit Industry Analysis, Insights and Forecast, 2020-2032
- 8.1. Market Analysis, Insights and Forecast - by Type
- 8.1.1. Internal Audit
- 8.1.2. External Audit
- 8.2. Market Analysis, Insights and Forecast - by Service line
- 8.2.1. Operational Audits
- 8.2.2. Financial Audits
- 8.2.3. Advisory and Consulting
- 8.2.4. Investigation Audit
- 8.2.5. Information System Audit
- 8.2.6. Compliance Audit
- 8.2.7. Other
- 8.1. Market Analysis, Insights and Forecast - by Type
- 9. Europe US Audit Industry Analysis, Insights and Forecast, 2020-2032
- 9.1. Market Analysis, Insights and Forecast - by Type
- 9.1.1. Internal Audit
- 9.1.2. External Audit
- 9.2. Market Analysis, Insights and Forecast - by Service line
- 9.2.1. Operational Audits
- 9.2.2. Financial Audits
- 9.2.3. Advisory and Consulting
- 9.2.4. Investigation Audit
- 9.2.5. Information System Audit
- 9.2.6. Compliance Audit
- 9.2.7. Other
- 9.1. Market Analysis, Insights and Forecast - by Type
- 10. Middle East & Africa US Audit Industry Analysis, Insights and Forecast, 2020-2032
- 10.1. Market Analysis, Insights and Forecast - by Type
- 10.1.1. Internal Audit
- 10.1.2. External Audit
- 10.2. Market Analysis, Insights and Forecast - by Service line
- 10.2.1. Operational Audits
- 10.2.2. Financial Audits
- 10.2.3. Advisory and Consulting
- 10.2.4. Investigation Audit
- 10.2.5. Information System Audit
- 10.2.6. Compliance Audit
- 10.2.7. Other
- 10.1. Market Analysis, Insights and Forecast - by Type
- 11. Asia Pacific US Audit Industry Analysis, Insights and Forecast, 2020-2032
- 11.1. Market Analysis, Insights and Forecast - by Type
- 11.1.1. Internal Audit
- 11.1.2. External Audit
- 11.2. Market Analysis, Insights and Forecast - by Service line
- 11.2.1. Operational Audits
- 11.2.2. Financial Audits
- 11.2.3. Advisory and Consulting
- 11.2.4. Investigation Audit
- 11.2.5. Information System Audit
- 11.2.6. Compliance Audit
- 11.2.7. Other
- 11.1. Market Analysis, Insights and Forecast - by Type
- 12. Competitive Analysis
- 12.1. Company Profiles
- 12.1.1 Deloitte
- 12.1.1.1. Company Overview
- 12.1.1.2. Products
- 12.1.1.3. Company Financials
- 12.1.1.4. SWOT Analysis
- 12.1.2 EY
- 12.1.2.1. Company Overview
- 12.1.2.2. Products
- 12.1.2.3. Company Financials
- 12.1.2.4. SWOT Analysis
- 12.1.3 KPMG
- 12.1.3.1. Company Overview
- 12.1.3.2. Products
- 12.1.3.3. Company Financials
- 12.1.3.4. SWOT Analysis
- 12.1.4 PwC
- 12.1.4.1. Company Overview
- 12.1.4.2. Products
- 12.1.4.3. Company Financials
- 12.1.4.4. SWOT Analysis
- 12.1.5 RSM US
- 12.1.5.1. Company Overview
- 12.1.5.2. Products
- 12.1.5.3. Company Financials
- 12.1.5.4. SWOT Analysis
- 12.1.6 Grant Thornton LLP
- 12.1.6.1. Company Overview
- 12.1.6.2. Products
- 12.1.6.3. Company Financials
- 12.1.6.4. SWOT Analysis
- 12.1.7 A T Kearney
- 12.1.7.1. Company Overview
- 12.1.7.2. Products
- 12.1.7.3. Company Financials
- 12.1.7.4. SWOT Analysis
- 12.1.8 BDO USA
- 12.1.8.1. Company Overview
- 12.1.8.2. Products
- 12.1.8.3. Company Financials
- 12.1.8.4. SWOT Analysis
- 12.1.9 CBIZ & Mayer Hoffman McCann
- 12.1.9.1. Company Overview
- 12.1.9.2. Products
- 12.1.9.3. Company Financials
- 12.1.9.4. SWOT Analysis
- 12.1.10 Crowe Horwath**List Not Exhaustive
- 12.1.10.1. Company Overview
- 12.1.10.2. Products
- 12.1.10.3. Company Financials
- 12.1.10.4. SWOT Analysis
- 12.1.1 Deloitte
- 12.2. Market Entropy
- 12.2.1 Company's Key Areas Served
- 12.2.2 Recent Developments
- 12.3. Company Market Share Analysis 2025
- 12.3.1 Top 5 Companies Market Share Analysis
- 12.3.2 Top 3 Companies Market Share Analysis
- 12.4. List of Potential Customers
- 13. Research Methodology
List of Figures
- Figure 1: Global US Audit Industry Revenue Breakdown (Million, %) by Region 2025 & 2033
- Figure 2: Global US Audit Industry Volume Breakdown (Billion, %) by Region 2025 & 2033
- Figure 3: North America US Audit Industry Revenue (Million), by Type 2025 & 2033
- Figure 4: North America US Audit Industry Volume (Billion), by Type 2025 & 2033
- Figure 5: North America US Audit Industry Revenue Share (%), by Type 2025 & 2033
- Figure 6: North America US Audit Industry Volume Share (%), by Type 2025 & 2033
- Figure 7: North America US Audit Industry Revenue (Million), by Service line 2025 & 2033
- Figure 8: North America US Audit Industry Volume (Billion), by Service line 2025 & 2033
- Figure 9: North America US Audit Industry Revenue Share (%), by Service line 2025 & 2033
- Figure 10: North America US Audit Industry Volume Share (%), by Service line 2025 & 2033
- Figure 11: North America US Audit Industry Revenue (Million), by Country 2025 & 2033
- Figure 12: North America US Audit Industry Volume (Billion), by Country 2025 & 2033
- Figure 13: North America US Audit Industry Revenue Share (%), by Country 2025 & 2033
- Figure 14: North America US Audit Industry Volume Share (%), by Country 2025 & 2033
- Figure 15: South America US Audit Industry Revenue (Million), by Type 2025 & 2033
- Figure 16: South America US Audit Industry Volume (Billion), by Type 2025 & 2033
- Figure 17: South America US Audit Industry Revenue Share (%), by Type 2025 & 2033
- Figure 18: South America US Audit Industry Volume Share (%), by Type 2025 & 2033
- Figure 19: South America US Audit Industry Revenue (Million), by Service line 2025 & 2033
- Figure 20: South America US Audit Industry Volume (Billion), by Service line 2025 & 2033
- Figure 21: South America US Audit Industry Revenue Share (%), by Service line 2025 & 2033
- Figure 22: South America US Audit Industry Volume Share (%), by Service line 2025 & 2033
- Figure 23: South America US Audit Industry Revenue (Million), by Country 2025 & 2033
- Figure 24: South America US Audit Industry Volume (Billion), by Country 2025 & 2033
- Figure 25: South America US Audit Industry Revenue Share (%), by Country 2025 & 2033
- Figure 26: South America US Audit Industry Volume Share (%), by Country 2025 & 2033
- Figure 27: Europe US Audit Industry Revenue (Million), by Type 2025 & 2033
- Figure 28: Europe US Audit Industry Volume (Billion), by Type 2025 & 2033
- Figure 29: Europe US Audit Industry Revenue Share (%), by Type 2025 & 2033
- Figure 30: Europe US Audit Industry Volume Share (%), by Type 2025 & 2033
- Figure 31: Europe US Audit Industry Revenue (Million), by Service line 2025 & 2033
- Figure 32: Europe US Audit Industry Volume (Billion), by Service line 2025 & 2033
- Figure 33: Europe US Audit Industry Revenue Share (%), by Service line 2025 & 2033
- Figure 34: Europe US Audit Industry Volume Share (%), by Service line 2025 & 2033
- Figure 35: Europe US Audit Industry Revenue (Million), by Country 2025 & 2033
- Figure 36: Europe US Audit Industry Volume (Billion), by Country 2025 & 2033
- Figure 37: Europe US Audit Industry Revenue Share (%), by Country 2025 & 2033
- Figure 38: Europe US Audit Industry Volume Share (%), by Country 2025 & 2033
- Figure 39: Middle East & Africa US Audit Industry Revenue (Million), by Type 2025 & 2033
- Figure 40: Middle East & Africa US Audit Industry Volume (Billion), by Type 2025 & 2033
- Figure 41: Middle East & Africa US Audit Industry Revenue Share (%), by Type 2025 & 2033
- Figure 42: Middle East & Africa US Audit Industry Volume Share (%), by Type 2025 & 2033
- Figure 43: Middle East & Africa US Audit Industry Revenue (Million), by Service line 2025 & 2033
- Figure 44: Middle East & Africa US Audit Industry Volume (Billion), by Service line 2025 & 2033
- Figure 45: Middle East & Africa US Audit Industry Revenue Share (%), by Service line 2025 & 2033
- Figure 46: Middle East & Africa US Audit Industry Volume Share (%), by Service line 2025 & 2033
- Figure 47: Middle East & Africa US Audit Industry Revenue (Million), by Country 2025 & 2033
- Figure 48: Middle East & Africa US Audit Industry Volume (Billion), by Country 2025 & 2033
- Figure 49: Middle East & Africa US Audit Industry Revenue Share (%), by Country 2025 & 2033
- Figure 50: Middle East & Africa US Audit Industry Volume Share (%), by Country 2025 & 2033
- Figure 51: Asia Pacific US Audit Industry Revenue (Million), by Type 2025 & 2033
- Figure 52: Asia Pacific US Audit Industry Volume (Billion), by Type 2025 & 2033
- Figure 53: Asia Pacific US Audit Industry Revenue Share (%), by Type 2025 & 2033
- Figure 54: Asia Pacific US Audit Industry Volume Share (%), by Type 2025 & 2033
- Figure 55: Asia Pacific US Audit Industry Revenue (Million), by Service line 2025 & 2033
- Figure 56: Asia Pacific US Audit Industry Volume (Billion), by Service line 2025 & 2033
- Figure 57: Asia Pacific US Audit Industry Revenue Share (%), by Service line 2025 & 2033
- Figure 58: Asia Pacific US Audit Industry Volume Share (%), by Service line 2025 & 2033
- Figure 59: Asia Pacific US Audit Industry Revenue (Million), by Country 2025 & 2033
- Figure 60: Asia Pacific US Audit Industry Volume (Billion), by Country 2025 & 2033
- Figure 61: Asia Pacific US Audit Industry Revenue Share (%), by Country 2025 & 2033
- Figure 62: Asia Pacific US Audit Industry Volume Share (%), by Country 2025 & 2033
List of Tables
- Table 1: Global US Audit Industry Revenue Million Forecast, by Type 2020 & 2033
- Table 2: Global US Audit Industry Volume Billion Forecast, by Type 2020 & 2033
- Table 3: Global US Audit Industry Revenue Million Forecast, by Service line 2020 & 2033
- Table 4: Global US Audit Industry Volume Billion Forecast, by Service line 2020 & 2033
- Table 5: Global US Audit Industry Revenue Million Forecast, by Region 2020 & 2033
- Table 6: Global US Audit Industry Volume Billion Forecast, by Region 2020 & 2033
- Table 7: Global US Audit Industry Revenue Million Forecast, by Type 2020 & 2033
- Table 8: Global US Audit Industry Volume Billion Forecast, by Type 2020 & 2033
- Table 9: Global US Audit Industry Revenue Million Forecast, by Service line 2020 & 2033
- Table 10: Global US Audit Industry Volume Billion Forecast, by Service line 2020 & 2033
- Table 11: Global US Audit Industry Revenue Million Forecast, by Country 2020 & 2033
- Table 12: Global US Audit Industry Volume Billion Forecast, by Country 2020 & 2033
- Table 13: United States US Audit Industry Revenue (Million) Forecast, by Application 2020 & 2033
- Table 14: United States US Audit Industry Volume (Billion) Forecast, by Application 2020 & 2033
- Table 15: Canada US Audit Industry Revenue (Million) Forecast, by Application 2020 & 2033
- Table 16: Canada US Audit Industry Volume (Billion) Forecast, by Application 2020 & 2033
- Table 17: Mexico US Audit Industry Revenue (Million) Forecast, by Application 2020 & 2033
- Table 18: Mexico US Audit Industry Volume (Billion) Forecast, by Application 2020 & 2033
- Table 19: Global US Audit Industry Revenue Million Forecast, by Type 2020 & 2033
- Table 20: Global US Audit Industry Volume Billion Forecast, by Type 2020 & 2033
- Table 21: Global US Audit Industry Revenue Million Forecast, by Service line 2020 & 2033
- Table 22: Global US Audit Industry Volume Billion Forecast, by Service line 2020 & 2033
- Table 23: Global US Audit Industry Revenue Million Forecast, by Country 2020 & 2033
- Table 24: Global US Audit Industry Volume Billion Forecast, by Country 2020 & 2033
- Table 25: Brazil US Audit Industry Revenue (Million) Forecast, by Application 2020 & 2033
- Table 26: Brazil US Audit Industry Volume (Billion) Forecast, by Application 2020 & 2033
- Table 27: Argentina US Audit Industry Revenue (Million) Forecast, by Application 2020 & 2033
- Table 28: Argentina US Audit Industry Volume (Billion) Forecast, by Application 2020 & 2033
- Table 29: Rest of South America US Audit Industry Revenue (Million) Forecast, by Application 2020 & 2033
- Table 30: Rest of South America US Audit Industry Volume (Billion) Forecast, by Application 2020 & 2033
- Table 31: Global US Audit Industry Revenue Million Forecast, by Type 2020 & 2033
- Table 32: Global US Audit Industry Volume Billion Forecast, by Type 2020 & 2033
- Table 33: Global US Audit Industry Revenue Million Forecast, by Service line 2020 & 2033
- Table 34: Global US Audit Industry Volume Billion Forecast, by Service line 2020 & 2033
- Table 35: Global US Audit Industry Revenue Million Forecast, by Country 2020 & 2033
- Table 36: Global US Audit Industry Volume Billion Forecast, by Country 2020 & 2033
- Table 37: United Kingdom US Audit Industry Revenue (Million) Forecast, by Application 2020 & 2033
- Table 38: United Kingdom US Audit Industry Volume (Billion) Forecast, by Application 2020 & 2033
- Table 39: Germany US Audit Industry Revenue (Million) Forecast, by Application 2020 & 2033
- Table 40: Germany US Audit Industry Volume (Billion) Forecast, by Application 2020 & 2033
- Table 41: France US Audit Industry Revenue (Million) Forecast, by Application 2020 & 2033
- Table 42: France US Audit Industry Volume (Billion) Forecast, by Application 2020 & 2033
- Table 43: Italy US Audit Industry Revenue (Million) Forecast, by Application 2020 & 2033
- Table 44: Italy US Audit Industry Volume (Billion) Forecast, by Application 2020 & 2033
- Table 45: Spain US Audit Industry Revenue (Million) Forecast, by Application 2020 & 2033
- Table 46: Spain US Audit Industry Volume (Billion) Forecast, by Application 2020 & 2033
- Table 47: Russia US Audit Industry Revenue (Million) Forecast, by Application 2020 & 2033
- Table 48: Russia US Audit Industry Volume (Billion) Forecast, by Application 2020 & 2033
- Table 49: Benelux US Audit Industry Revenue (Million) Forecast, by Application 2020 & 2033
- Table 50: Benelux US Audit Industry Volume (Billion) Forecast, by Application 2020 & 2033
- Table 51: Nordics US Audit Industry Revenue (Million) Forecast, by Application 2020 & 2033
- Table 52: Nordics US Audit Industry Volume (Billion) Forecast, by Application 2020 & 2033
- Table 53: Rest of Europe US Audit Industry Revenue (Million) Forecast, by Application 2020 & 2033
- Table 54: Rest of Europe US Audit Industry Volume (Billion) Forecast, by Application 2020 & 2033
- Table 55: Global US Audit Industry Revenue Million Forecast, by Type 2020 & 2033
- Table 56: Global US Audit Industry Volume Billion Forecast, by Type 2020 & 2033
- Table 57: Global US Audit Industry Revenue Million Forecast, by Service line 2020 & 2033
- Table 58: Global US Audit Industry Volume Billion Forecast, by Service line 2020 & 2033
- Table 59: Global US Audit Industry Revenue Million Forecast, by Country 2020 & 2033
- Table 60: Global US Audit Industry Volume Billion Forecast, by Country 2020 & 2033
- Table 61: Turkey US Audit Industry Revenue (Million) Forecast, by Application 2020 & 2033
- Table 62: Turkey US Audit Industry Volume (Billion) Forecast, by Application 2020 & 2033
- Table 63: Israel US Audit Industry Revenue (Million) Forecast, by Application 2020 & 2033
- Table 64: Israel US Audit Industry Volume (Billion) Forecast, by Application 2020 & 2033
- Table 65: GCC US Audit Industry Revenue (Million) Forecast, by Application 2020 & 2033
- Table 66: GCC US Audit Industry Volume (Billion) Forecast, by Application 2020 & 2033
- Table 67: North Africa US Audit Industry Revenue (Million) Forecast, by Application 2020 & 2033
- Table 68: North Africa US Audit Industry Volume (Billion) Forecast, by Application 2020 & 2033
- Table 69: South Africa US Audit Industry Revenue (Million) Forecast, by Application 2020 & 2033
- Table 70: South Africa US Audit Industry Volume (Billion) Forecast, by Application 2020 & 2033
- Table 71: Rest of Middle East & Africa US Audit Industry Revenue (Million) Forecast, by Application 2020 & 2033
- Table 72: Rest of Middle East & Africa US Audit Industry Volume (Billion) Forecast, by Application 2020 & 2033
- Table 73: Global US Audit Industry Revenue Million Forecast, by Type 2020 & 2033
- Table 74: Global US Audit Industry Volume Billion Forecast, by Type 2020 & 2033
- Table 75: Global US Audit Industry Revenue Million Forecast, by Service line 2020 & 2033
- Table 76: Global US Audit Industry Volume Billion Forecast, by Service line 2020 & 2033
- Table 77: Global US Audit Industry Revenue Million Forecast, by Country 2020 & 2033
- Table 78: Global US Audit Industry Volume Billion Forecast, by Country 2020 & 2033
- Table 79: China US Audit Industry Revenue (Million) Forecast, by Application 2020 & 2033
- Table 80: China US Audit Industry Volume (Billion) Forecast, by Application 2020 & 2033
- Table 81: India US Audit Industry Revenue (Million) Forecast, by Application 2020 & 2033
- Table 82: India US Audit Industry Volume (Billion) Forecast, by Application 2020 & 2033
- Table 83: Japan US Audit Industry Revenue (Million) Forecast, by Application 2020 & 2033
- Table 84: Japan US Audit Industry Volume (Billion) Forecast, by Application 2020 & 2033
- Table 85: South Korea US Audit Industry Revenue (Million) Forecast, by Application 2020 & 2033
- Table 86: South Korea US Audit Industry Volume (Billion) Forecast, by Application 2020 & 2033
- Table 87: ASEAN US Audit Industry Revenue (Million) Forecast, by Application 2020 & 2033
- Table 88: ASEAN US Audit Industry Volume (Billion) Forecast, by Application 2020 & 2033
- Table 89: Oceania US Audit Industry Revenue (Million) Forecast, by Application 2020 & 2033
- Table 90: Oceania US Audit Industry Volume (Billion) Forecast, by Application 2020 & 2033
- Table 91: Rest of Asia Pacific US Audit Industry Revenue (Million) Forecast, by Application 2020 & 2033
- Table 92: Rest of Asia Pacific US Audit Industry Volume (Billion) Forecast, by Application 2020 & 2033
Frequently Asked Questions
1. What is the projected Compound Annual Growth Rate (CAGR) of the US Audit Industry?
The projected CAGR is approximately 3.27%.
2. Which companies are prominent players in the US Audit Industry?
Key companies in the market include Deloitte, EY, KPMG, PwC, RSM US, Grant Thornton LLP, A T Kearney, BDO USA, CBIZ & Mayer Hoffman McCann, Crowe Horwath**List Not Exhaustive.
3. What are the main segments of the US Audit Industry?
The market segments include Type, Service line.
4. Can you provide details about the market size?
The market size is estimated to be USD 50.24 Million as of 2022.
5. What are some drivers contributing to market growth?
N/A
6. What are the notable trends driving market growth?
Declining Quality of Auditing from the Big 4.
7. Are there any restraints impacting market growth?
N/A
8. Can you provide examples of recent developments in the market?
In May 2023, Deloitte and Google Cloud have recently bolstered their decade-long alliance, with a specific focus on deploying Google Cloud's cutting-edge Generative AI capabilities across various industries.
9. What pricing options are available for accessing the report?
Pricing options include single-user, multi-user, and enterprise licenses priced at USD 3800, USD 4500, and USD 5800 respectively.
10. Is the market size provided in terms of value or volume?
The market size is provided in terms of value, measured in Million and volume, measured in Billion.
11. Are there any specific market keywords associated with the report?
Yes, the market keyword associated with the report is "US Audit Industry," which aids in identifying and referencing the specific market segment covered.
12. How do I determine which pricing option suits my needs best?
The pricing options vary based on user requirements and access needs. Individual users may opt for single-user licenses, while businesses requiring broader access may choose multi-user or enterprise licenses for cost-effective access to the report.
13. Are there any additional resources or data provided in the US Audit Industry report?
While the report offers comprehensive insights, it's advisable to review the specific contents or supplementary materials provided to ascertain if additional resources or data are available.
14. How can I stay updated on further developments or reports in the US Audit Industry?
To stay informed about further developments, trends, and reports in the US Audit Industry, consider subscribing to industry newsletters, following relevant companies and organizations, or regularly checking reputable industry news sources and publications.
Methodology
Step 1 - Identification of Relevant Samples Size from Population Database


Step 2 - Approaches for Defining Global Market Size (Value, Volume* & Price*)

Note*: In applicable scenarios
Step 3 - Data Sources
Primary Research
- Web Analytics
- Survey Reports
- Research Institute
- Latest Research Reports
- Opinion Leaders
Secondary Research
- Annual Reports
- White Paper
- Latest Press Release
- Industry Association
- Paid Database
- Investor Presentations

Step 4 - Data Triangulation
Involves using different sources of information in order to increase the validity of a study
These sources are likely to be stakeholders in a program - participants, other researchers, program staff, other community members, and so on.
Then we put all data in single framework & apply various statistical tools to find out the dynamic on the market.
During the analysis stage, feedback from the stakeholder groups would be compared to determine areas of agreement as well as areas of divergence

