

Key Insights
The US contract manufacturing services (CMS) industry is experiencing robust growth, driven by several key factors. The increasing demand for outsourced manufacturing capabilities across various sectors, including food and beverage, pharmaceuticals, cosmetics, and consumer goods, is a primary driver. Companies are increasingly focusing on core competencies and outsourcing non-core functions like manufacturing to improve efficiency and reduce operational costs. Furthermore, the rising complexity of product development and stringent regulatory requirements are pushing companies to leverage the expertise of specialized CMS providers. A 25.10% CAGR from 2019-2033 suggests a significant expansion of the market, with the market size in 2025 likely exceeding several billion dollars (a precise figure requires additional data, but based on typical market sizes and the given CAGR, a conservative estimate would place it in the low to mid-billions). This growth is further fueled by technological advancements in manufacturing processes, leading to increased automation, improved quality control, and faster turnaround times. The industry's segmentation reflects this diversity, with specialized providers catering to specific industries and product categories.
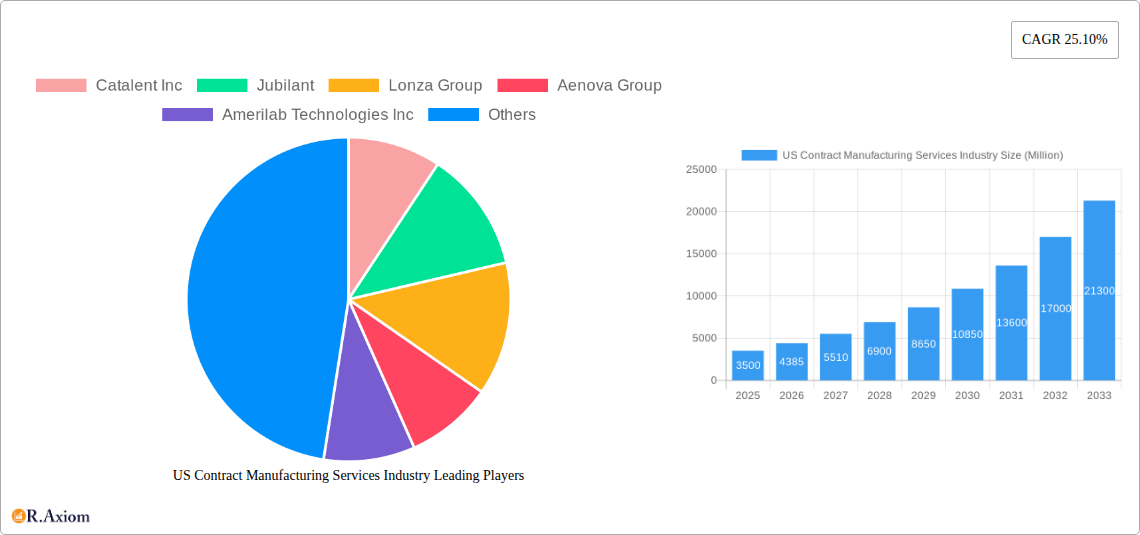
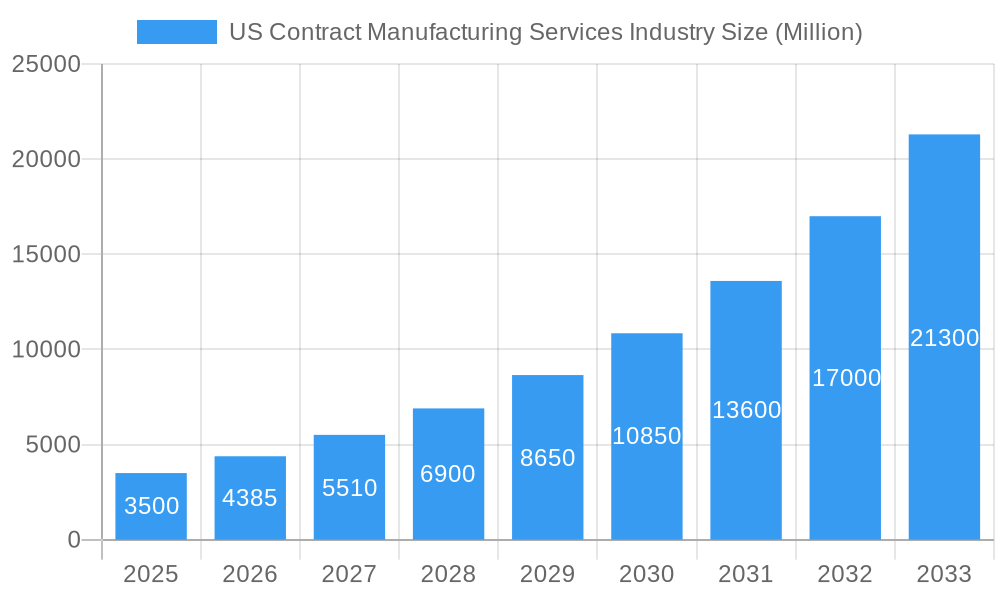
US Contract Manufacturing Services Industry Market Size (In Billion)
The competitive landscape is characterized by a mix of large multinational corporations and smaller specialized firms. Key players like Catalent, Lonza, and others are constantly expanding their capabilities and service offerings to meet evolving client needs. The consolidation trend within the industry suggests further growth through mergers and acquisitions. While geographic expansion and capacity constraints might pose some challenges, the overall outlook for the US CMS industry remains positive, driven by strong underlying market forces and a growing preference for outsourcing manufacturing among various businesses. Continued technological innovation and the increasing need for flexible, scalable manufacturing solutions will likely shape future industry dynamics, leading to further growth and diversification in the coming years.
US Contract Manufacturing Services Industry Company Market Share
US Contract Manufacturing Services Industry: A Comprehensive Market Report (2019-2033)
This comprehensive report provides an in-depth analysis of the US Contract Manufacturing Services (CMS) industry, covering market size, segmentation, growth drivers, challenges, and key players. The report utilizes data from the historical period (2019-2024), the base year (2025), and projects the market's future trajectory until 2033. This detailed analysis offers actionable insights for industry stakeholders, investors, and businesses looking to navigate this dynamic market.
US Contract Manufacturing Services Industry Market Concentration & Innovation
The US CMS industry exhibits a moderately concentrated market structure, with a few large players holding significant market share. However, a large number of smaller niche players also contribute to the overall market dynamics. Market concentration is influenced by factors such as economies of scale, technological capabilities, and access to capital. While precise market share figures for each player are proprietary and vary by segment, key players like Catalent Inc., Lonza Group, and Jubliant hold substantial positions.
Innovation is a key driver, fueled by technological advancements in automation, process optimization, and the development of specialized manufacturing capabilities. Stringent regulatory frameworks, including FDA guidelines, drive continuous improvements in quality control and compliance. Product substitutes, such as in-house manufacturing, exist but are often less cost-effective for many companies, particularly for smaller businesses. End-user trends toward customization and demand for specialized products propel innovation within the CMS industry. Mergers and acquisitions (M&A) activity is prevalent, with deal values in the range of xx Million to xx Million annually, leading to consolidation and increased market concentration. For instance, strategic alliances like the Lonza and Israel Biotech Fund collaboration in 2022 exemplify a key trend of expanding market access and capabilities.
- Market Concentration: Moderately concentrated, with several large players and numerous smaller firms.
- Innovation Drivers: Technological advancements, regulatory requirements, end-user demand for customization.
- M&A Activity: Annual deal values estimated between xx Million and xx Million USD.
- Key Players: Catalent Inc., Lonza Group, Jubilant, and others.
US Contract Manufacturing Services Industry Industry Trends & Insights
The US CMS industry is experiencing robust growth, driven by several key factors. The CAGR for the period 2025-2033 is projected to be xx%, primarily fueled by increased outsourcing by pharmaceutical and consumer goods companies. This shift is driven by factors such as cost optimization, access to specialized expertise, and the ability to scale production efficiently. Technological disruptions, such as automation and AI-powered process improvements, are boosting productivity and efficiency. Consumer preferences for personalized products and heightened quality standards are pushing CMS providers to innovate and adapt. Competitive dynamics are characterized by a mix of cooperation and competition, with strategic partnerships and M&A activity shaping the industry landscape. Market penetration is high for established CMS providers in established segments, but growth opportunities exist in emerging markets and specialized product areas. The overall market size is estimated at xx Million in 2025 and is projected to reach xx Million by 2033.
Dominant Markets & Segments in US Contract Manufacturing Services Industry
The US CMS industry is geographically diverse, with significant activity across various regions. However, specific data on regional dominance requires proprietary information, and accurate data to specify one region as more dominant than another cannot be provided at this time. Several segments exist within the industry, including pharmaceuticals, food and beverage, cosmetics, and others. The pharmaceutical segment currently dominates the market due to the complex manufacturing processes and regulatory requirements involved. The growth of this segment is further fueled by increased R&D spending and the rise of biologics. The food and beverage segment shows strong growth potential due to trends such as increased demand for customized and specialized products.
- Key Drivers:
- Pharmaceutical Segment: Complex manufacturing, regulatory requirements, high R&D spending.
- Food & Beverage Segment: Increasing demand for customization and specialized products.
- Economic Policies: Government incentives and support for manufacturing.
- Infrastructure: Availability of skilled labor and advanced manufacturing facilities.
US Contract Manufacturing Services Industry Product Developments
The US Contract Manufacturing Services (CMS) industry is witnessing a significant evolution driven by the adoption of cutting-edge technologies. Key product developments include the integration of advanced robotics and automation for enhanced precision and speed, alongside the implementation of Artificial Intelligence (AI) for sophisticated process optimization and predictive quality control. Furthermore, the industry is seeing a rise in specialized packaging solutions tailored to meet diverse product needs, from sterile pharmaceutical packaging to eco-friendly consumer goods formats. These innovations not only bolster efficiency and elevate product quality but are also crucial in addressing the escalating demand for highly customized and bespoke products. The strategic integration of these technologies equips CMS providers with a distinct competitive edge, enabling them to achieve greater production capacity, drive down operational costs, and accelerate time-to-market. This proactive embrace of automation, digitalization, and sustainable manufacturing practices firmly aligns with overarching global industry trends and the growing imperative for environmentally conscious production.
Report Scope & Segmentation Analysis
This report segments the US CMS market based on several factors including product type (pharmaceutical, food & beverage, cosmetics, etc.), service type (formulation, packaging, testing), and end-user industry. Each segment exhibits unique growth trajectories and competitive dynamics. For example, the pharmaceutical segment commands a large market share and is projected to experience substantial growth due to the rising demand for pharmaceutical products and outsourcing. The food and beverage segment displays a strong growth outlook driven by rising demand for customized food and beverage products. Similarly, the cosmetics segment presents attractive opportunities given the increase in demand for personalized beauty products.
Key Drivers of US Contract Manufacturing Services Industry Growth
The robust growth trajectory of the US CMS industry is underpinned by several interconnected factors. Foremost among these is the escalating trend of outsourcing by pharmaceutical, biotechnology, and consumer goods companies, motivated by the pursuit of cost efficiencies and the desire to leverage specialized expertise and advanced manufacturing capabilities. Secondly, continuous technological advancements in automation, robotics, and AI are instrumental in elevating production efficiency, ensuring consistent quality, and fostering innovation in manufacturing processes. Thirdly, evolving consumer demands for personalized products and an unwavering expectation for superior quality are compelling businesses to forge partnerships with CMS providers possessing niche competencies and flexible manufacturing setups. Lastly, a supportive regulatory landscape, characterized by clear guidelines and a commitment to compliance, provides a stable and predictable environment conducive to sustained industry expansion.
Challenges in the US Contract Manufacturing Services Industry Sector
The US CMS industry faces several challenges. Regulatory hurdles and compliance requirements demand significant investment and expertise. Supply chain disruptions and material cost volatility can impact profitability and timely delivery. Intense competition from established and emerging players necessitates continuous innovation and operational efficiency. The current projected impact of these challenges on the industry's growth rate is difficult to quantify precisely but may negatively affect the overall xx% projected CAGR if not properly addressed.
Emerging Opportunities in US Contract Manufacturing Services Industry
The US CMS industry is poised to capitalize on a wealth of emerging opportunities. The burgeoning field of personalized medicine presents a significant avenue for growth, requiring specialized manufacturing capabilities for tailored treatments. Furthermore, the increasing global emphasis on sustainable and ethical manufacturing practices is creating demand for eco-friendly production methods and materials, offering a strong differentiator for forward-thinking companies. The expansion into new and developing markets, particularly those with growing economies and increasing consumer bases, also represents a substantial opportunity for service providers. The continued adoption of advanced technologies such as AI and machine learning is unlocking further potential for sophisticated process optimization, predictive maintenance, and enhanced supply chain visibility. Identifying and focusing on niche market segments and offering highly specialized, value-added services can lead to greater differentiation and improved profit margins. The growing demand for contract manufacturing of biodegradable and recyclable products, coupled with innovative, environmentally conscious packaging solutions, will undoubtedly fuel further innovation and create exciting new avenues for growth.
Leading Players in the US Contract Manufacturing Services Industry Market
- Catalent Inc.
- Jubilant Biosys Ltd.
- Lonza Group
- Aenova Group
- Amerilab Technologies Inc.
- Bernet Food & Beverage
- Big Brands LLC
- Delamaine Fine Foods Limited
- Brooklyn Bottling
- CSD Co-Packers
- Southeast Bottling & Beverages
- G3 Enterprises
- Western Innovations
- Niagara Bottling and Robinsons Breweries
- KIK Custom Products
- Sensible Organics
- Colep
- Cosmetic Essence LLC
- Formula Cap
Key Developments in US Contract Manufacturing Services Industry Industry
- July 2021: Catalent Inc. unveiled GPEx® lightning, a groundbreaking, next-generation cell line development technology. This innovative platform significantly reduces drug development timelines by an average of three months, accelerating the delivery of novel therapeutics to patients and demonstrating Catalent's commitment to advancing biopharmaceutical manufacturing.
- May 2022: Lonza announced a strategic framework agreement with the Israel Biotech Fund (IBF). This collaboration is designed to bolster the development and manufacturing capabilities for both biologics and small molecule drugs for IBF's portfolio companies. The partnership enhances Lonza's market reach within Israel's vibrant biotechnology ecosystem and solidifies its global leadership in the biopharmaceutical manufacturing sector.
Strategic Outlook for US Contract Manufacturing Services Industry Market
The US CMS industry is poised for continued growth, driven by robust demand from various sectors, technological advancements, and strategic M&A activity. Opportunities exist in expanding into niche segments, adopting sustainable practices, and leveraging new technologies to enhance efficiency and product quality. Companies that invest in innovation, operational excellence, and strategic partnerships are expected to thrive in this dynamic market. The long-term outlook remains positive, with continued growth anticipated throughout the forecast period (2025-2033).
US Contract Manufacturing Services Industry Segmentation
-
1. pharmaceutical
- 1.1. Current Market Scenario and growth influencers
- 1.2. Market B
-
1.3. Active P
- 1.3.1. Small molecule
- 1.3.2. Large Molecule
- 1.3.3. High Potency API (HPAPI)
-
1.4. Finished
- 1.4.1. Solid Dose Formulation
- 1.4.2. Liquid Dose Formulation
- 1.4.3. Injectable Dose Formulation
- 1.5. Secondary Packaging
-
2. Food processing & manufacturing
- 2.1. Market Breakdown - by Service Type
- 2.2. Current Market Scenario and growth influencers
-
2.3. Food Manufacturing Services
- 2.3.1. Convenience Foods
- 2.3.2. Bakery Products
- 2.3.3. Confectionary Products
- 2.3.4. Dairy Products
- 2.3.5. Research & Development
- 2.3.6. Food Packaging Services
-
3. Beverage
- 3.1. Current Market Scenario and growth influencers
-
3.2. Market B
- 3.2.1. Beer
- 3.2.2. Carbonated Drinks & Fruit-based Beverages
- 3.2.3. Bottled Water
- 3.2.4. Others (Sport Drinks)
-
4. Personal Care
- 4.1. Current Market Scenario and growth influencers
-
4.2. Market Breakdown - by Type
- 4.2.1. Skin Care
- 4.2.2. Hair Care
- 4.2.3. Make up & Color Cosmetics
- 4.2.4. Others
US Contract Manufacturing Services Industry Segmentation By Geography
-
1. North America
- 1.1. United States
- 1.2. Canada
- 1.3. Mexico
-
2. South America
- 2.1. Brazil
- 2.2. Argentina
- 2.3. Rest of South America
-
3. Europe
- 3.1. United Kingdom
- 3.2. Germany
- 3.3. France
- 3.4. Italy
- 3.5. Spain
- 3.6. Russia
- 3.7. Benelux
- 3.8. Nordics
- 3.9. Rest of Europe
-
4. Middle East & Africa
- 4.1. Turkey
- 4.2. Israel
- 4.3. GCC
- 4.4. North Africa
- 4.5. South Africa
- 4.6. Rest of Middle East & Africa
-
5. Asia Pacific
- 5.1. China
- 5.2. India
- 5.3. Japan
- 5.4. South Korea
- 5.5. ASEAN
- 5.6. Oceania
- 5.7. Rest of Asia Pacific
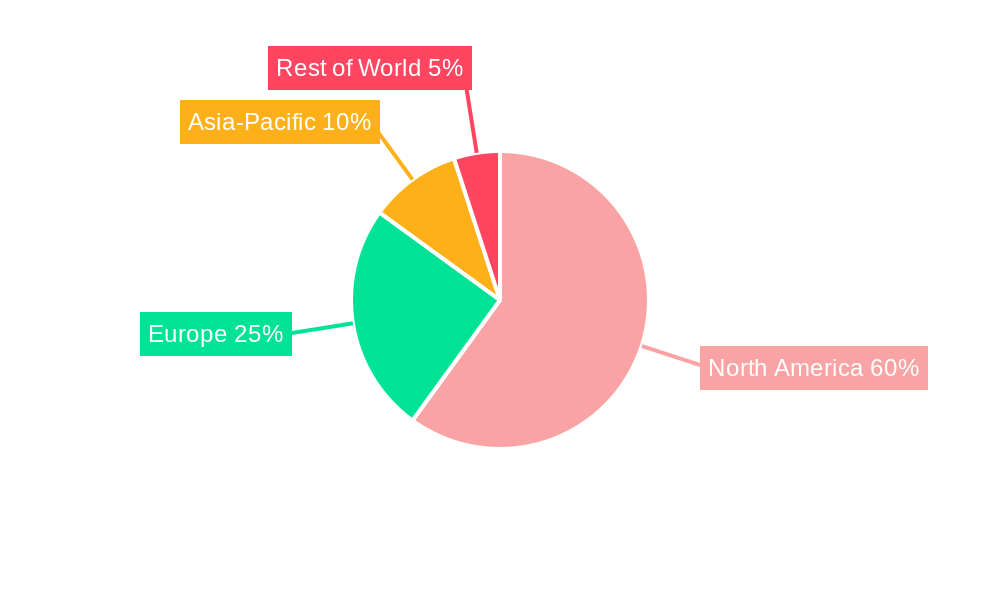
US Contract Manufacturing Services Industry Regional Market Share
Geographic Coverage of US Contract Manufacturing Services Industry
US Contract Manufacturing Services Industry REPORT HIGHLIGHTS
| Aspects | Details |
|---|---|
| Study Period | 2020-2034 |
| Base Year | 2025 |
| Estimated Year | 2026 |
| Forecast Period | 2026-2034 |
| Historical Period | 2020-2025 |
| Growth Rate | CAGR of 6.8% from 2020-2034 |
| Segmentation |
|
Table of Contents
- 1. Introduction
- 1.1. Research Scope
- 1.2. Market Segmentation
- 1.3. Research Objective
- 1.4. Definitions and Assumptions
- 2. Executive Summary
- 2.1. Market Snapshot
- 3. Market Dynamics
- 3.1. Market Drivers
- 3.2. Market Restrains
- 3.3. Market Trends
- 3.4. Market Opportunities
- 4. Market Factor Analysis
- 4.1. Porters Five Forces
- 4.1.1. Bargaining Power of Suppliers
- 4.1.2. Bargaining Power of Buyers
- 4.1.3. Threat of New Entrants
- 4.1.4. Threat of Substitutes
- 4.1.5. Competitive Rivalry
- 4.2. PESTEL analysis
- 4.3. BCG Analysis
- 4.3.1. Stars (High Growth, High Market Share)
- 4.3.2. Cash Cows (Low Growth, High Market Share)
- 4.3.3. Question Mark (High Growth, Low Market Share)
- 4.3.4. Dogs (Low Growth, Low Market Share)
- 4.4. Ansoff Matrix Analysis
- 4.5. Supply Chain Analysis
- 4.6. Regulatory Landscape
- 4.7. Current Market Potential and Opportunity Assessment (TAM–SAM–SOM Framework)
- 4.8. RAX Analyst Note
- 4.1. Porters Five Forces
- 5. Market Analysis, Insights and Forecast 2021-2033
- 5.1. Market Analysis, Insights and Forecast - by pharmaceutical
- 5.1.1. Current Market Scenario and growth influencers
- 5.1.2. Market B
- 5.1.3. Active P
- 5.1.3.1. Small molecule
- 5.1.3.2. Large Molecule
- 5.1.3.3. High Potency API (HPAPI)
- 5.1.4. Finished
- 5.1.4.1. Solid Dose Formulation
- 5.1.4.2. Liquid Dose Formulation
- 5.1.4.3. Injectable Dose Formulation
- 5.1.5. Secondary Packaging
- 5.2. Market Analysis, Insights and Forecast - by Food processing & manufacturing
- 5.2.1. Market Breakdown - by Service Type
- 5.2.2. Current Market Scenario and growth influencers
- 5.2.3. Food Manufacturing Services
- 5.2.3.1. Convenience Foods
- 5.2.3.2. Bakery Products
- 5.2.3.3. Confectionary Products
- 5.2.3.4. Dairy Products
- 5.2.3.5. Research & Development
- 5.2.3.6. Food Packaging Services
- 5.3. Market Analysis, Insights and Forecast - by Beverage
- 5.3.1. Current Market Scenario and growth influencers
- 5.3.2. Market B
- 5.3.2.1. Beer
- 5.3.2.2. Carbonated Drinks & Fruit-based Beverages
- 5.3.2.3. Bottled Water
- 5.3.2.4. Others (Sport Drinks)
- 5.4. Market Analysis, Insights and Forecast - by Personal Care
- 5.4.1. Current Market Scenario and growth influencers
- 5.4.2. Market Breakdown - by Type
- 5.4.2.1. Skin Care
- 5.4.2.2. Hair Care
- 5.4.2.3. Make up & Color Cosmetics
- 5.4.2.4. Others
- 5.5. Market Analysis, Insights and Forecast - by Region
- 5.5.1. North America
- 5.5.2. South America
- 5.5.3. Europe
- 5.5.4. Middle East & Africa
- 5.5.5. Asia Pacific
- 5.1. Market Analysis, Insights and Forecast - by pharmaceutical
- 6. Global US Contract Manufacturing Services Industry Analysis, Insights and Forecast, 2021-2033
- 6.1. Market Analysis, Insights and Forecast - by pharmaceutical
- 6.1.1. Current Market Scenario and growth influencers
- 6.1.2. Market B
- 6.1.3. Active P
- 6.1.3.1. Small molecule
- 6.1.3.2. Large Molecule
- 6.1.3.3. High Potency API (HPAPI)
- 6.1.4. Finished
- 6.1.4.1. Solid Dose Formulation
- 6.1.4.2. Liquid Dose Formulation
- 6.1.4.3. Injectable Dose Formulation
- 6.1.5. Secondary Packaging
- 6.2. Market Analysis, Insights and Forecast - by Food processing & manufacturing
- 6.2.1. Market Breakdown - by Service Type
- 6.2.2. Current Market Scenario and growth influencers
- 6.2.3. Food Manufacturing Services
- 6.2.3.1. Convenience Foods
- 6.2.3.2. Bakery Products
- 6.2.3.3. Confectionary Products
- 6.2.3.4. Dairy Products
- 6.2.3.5. Research & Development
- 6.2.3.6. Food Packaging Services
- 6.3. Market Analysis, Insights and Forecast - by Beverage
- 6.3.1. Current Market Scenario and growth influencers
- 6.3.2. Market B
- 6.3.2.1. Beer
- 6.3.2.2. Carbonated Drinks & Fruit-based Beverages
- 6.3.2.3. Bottled Water
- 6.3.2.4. Others (Sport Drinks)
- 6.4. Market Analysis, Insights and Forecast - by Personal Care
- 6.4.1. Current Market Scenario and growth influencers
- 6.4.2. Market Breakdown - by Type
- 6.4.2.1. Skin Care
- 6.4.2.2. Hair Care
- 6.4.2.3. Make up & Color Cosmetics
- 6.4.2.4. Others
- 6.1. Market Analysis, Insights and Forecast - by pharmaceutical
- 7. North America US Contract Manufacturing Services Industry Analysis, Insights and Forecast, 2020-2032
- 7.1. Market Analysis, Insights and Forecast - by pharmaceutical
- 7.1.1. Current Market Scenario and growth influencers
- 7.1.2. Market B
- 7.1.3. Active P
- 7.1.3.1. Small molecule
- 7.1.3.2. Large Molecule
- 7.1.3.3. High Potency API (HPAPI)
- 7.1.4. Finished
- 7.1.4.1. Solid Dose Formulation
- 7.1.4.2. Liquid Dose Formulation
- 7.1.4.3. Injectable Dose Formulation
- 7.1.5. Secondary Packaging
- 7.2. Market Analysis, Insights and Forecast - by Food processing & manufacturing
- 7.2.1. Market Breakdown - by Service Type
- 7.2.2. Current Market Scenario and growth influencers
- 7.2.3. Food Manufacturing Services
- 7.2.3.1. Convenience Foods
- 7.2.3.2. Bakery Products
- 7.2.3.3. Confectionary Products
- 7.2.3.4. Dairy Products
- 7.2.3.5. Research & Development
- 7.2.3.6. Food Packaging Services
- 7.3. Market Analysis, Insights and Forecast - by Beverage
- 7.3.1. Current Market Scenario and growth influencers
- 7.3.2. Market B
- 7.3.2.1. Beer
- 7.3.2.2. Carbonated Drinks & Fruit-based Beverages
- 7.3.2.3. Bottled Water
- 7.3.2.4. Others (Sport Drinks)
- 7.4. Market Analysis, Insights and Forecast - by Personal Care
- 7.4.1. Current Market Scenario and growth influencers
- 7.4.2. Market Breakdown - by Type
- 7.4.2.1. Skin Care
- 7.4.2.2. Hair Care
- 7.4.2.3. Make up & Color Cosmetics
- 7.4.2.4. Others
- 7.1. Market Analysis, Insights and Forecast - by pharmaceutical
- 8. South America US Contract Manufacturing Services Industry Analysis, Insights and Forecast, 2020-2032
- 8.1. Market Analysis, Insights and Forecast - by pharmaceutical
- 8.1.1. Current Market Scenario and growth influencers
- 8.1.2. Market B
- 8.1.3. Active P
- 8.1.3.1. Small molecule
- 8.1.3.2. Large Molecule
- 8.1.3.3. High Potency API (HPAPI)
- 8.1.4. Finished
- 8.1.4.1. Solid Dose Formulation
- 8.1.4.2. Liquid Dose Formulation
- 8.1.4.3. Injectable Dose Formulation
- 8.1.5. Secondary Packaging
- 8.2. Market Analysis, Insights and Forecast - by Food processing & manufacturing
- 8.2.1. Market Breakdown - by Service Type
- 8.2.2. Current Market Scenario and growth influencers
- 8.2.3. Food Manufacturing Services
- 8.2.3.1. Convenience Foods
- 8.2.3.2. Bakery Products
- 8.2.3.3. Confectionary Products
- 8.2.3.4. Dairy Products
- 8.2.3.5. Research & Development
- 8.2.3.6. Food Packaging Services
- 8.3. Market Analysis, Insights and Forecast - by Beverage
- 8.3.1. Current Market Scenario and growth influencers
- 8.3.2. Market B
- 8.3.2.1. Beer
- 8.3.2.2. Carbonated Drinks & Fruit-based Beverages
- 8.3.2.3. Bottled Water
- 8.3.2.4. Others (Sport Drinks)
- 8.4. Market Analysis, Insights and Forecast - by Personal Care
- 8.4.1. Current Market Scenario and growth influencers
- 8.4.2. Market Breakdown - by Type
- 8.4.2.1. Skin Care
- 8.4.2.2. Hair Care
- 8.4.2.3. Make up & Color Cosmetics
- 8.4.2.4. Others
- 8.1. Market Analysis, Insights and Forecast - by pharmaceutical
- 9. Europe US Contract Manufacturing Services Industry Analysis, Insights and Forecast, 2020-2032
- 9.1. Market Analysis, Insights and Forecast - by pharmaceutical
- 9.1.1. Current Market Scenario and growth influencers
- 9.1.2. Market B
- 9.1.3. Active P
- 9.1.3.1. Small molecule
- 9.1.3.2. Large Molecule
- 9.1.3.3. High Potency API (HPAPI)
- 9.1.4. Finished
- 9.1.4.1. Solid Dose Formulation
- 9.1.4.2. Liquid Dose Formulation
- 9.1.4.3. Injectable Dose Formulation
- 9.1.5. Secondary Packaging
- 9.2. Market Analysis, Insights and Forecast - by Food processing & manufacturing
- 9.2.1. Market Breakdown - by Service Type
- 9.2.2. Current Market Scenario and growth influencers
- 9.2.3. Food Manufacturing Services
- 9.2.3.1. Convenience Foods
- 9.2.3.2. Bakery Products
- 9.2.3.3. Confectionary Products
- 9.2.3.4. Dairy Products
- 9.2.3.5. Research & Development
- 9.2.3.6. Food Packaging Services
- 9.3. Market Analysis, Insights and Forecast - by Beverage
- 9.3.1. Current Market Scenario and growth influencers
- 9.3.2. Market B
- 9.3.2.1. Beer
- 9.3.2.2. Carbonated Drinks & Fruit-based Beverages
- 9.3.2.3. Bottled Water
- 9.3.2.4. Others (Sport Drinks)
- 9.4. Market Analysis, Insights and Forecast - by Personal Care
- 9.4.1. Current Market Scenario and growth influencers
- 9.4.2. Market Breakdown - by Type
- 9.4.2.1. Skin Care
- 9.4.2.2. Hair Care
- 9.4.2.3. Make up & Color Cosmetics
- 9.4.2.4. Others
- 9.1. Market Analysis, Insights and Forecast - by pharmaceutical
- 10. Middle East & Africa US Contract Manufacturing Services Industry Analysis, Insights and Forecast, 2020-2032
- 10.1. Market Analysis, Insights and Forecast - by pharmaceutical
- 10.1.1. Current Market Scenario and growth influencers
- 10.1.2. Market B
- 10.1.3. Active P
- 10.1.3.1. Small molecule
- 10.1.3.2. Large Molecule
- 10.1.3.3. High Potency API (HPAPI)
- 10.1.4. Finished
- 10.1.4.1. Solid Dose Formulation
- 10.1.4.2. Liquid Dose Formulation
- 10.1.4.3. Injectable Dose Formulation
- 10.1.5. Secondary Packaging
- 10.2. Market Analysis, Insights and Forecast - by Food processing & manufacturing
- 10.2.1. Market Breakdown - by Service Type
- 10.2.2. Current Market Scenario and growth influencers
- 10.2.3. Food Manufacturing Services
- 10.2.3.1. Convenience Foods
- 10.2.3.2. Bakery Products
- 10.2.3.3. Confectionary Products
- 10.2.3.4. Dairy Products
- 10.2.3.5. Research & Development
- 10.2.3.6. Food Packaging Services
- 10.3. Market Analysis, Insights and Forecast - by Beverage
- 10.3.1. Current Market Scenario and growth influencers
- 10.3.2. Market B
- 10.3.2.1. Beer
- 10.3.2.2. Carbonated Drinks & Fruit-based Beverages
- 10.3.2.3. Bottled Water
- 10.3.2.4. Others (Sport Drinks)
- 10.4. Market Analysis, Insights and Forecast - by Personal Care
- 10.4.1. Current Market Scenario and growth influencers
- 10.4.2. Market Breakdown - by Type
- 10.4.2.1. Skin Care
- 10.4.2.2. Hair Care
- 10.4.2.3. Make up & Color Cosmetics
- 10.4.2.4. Others
- 10.1. Market Analysis, Insights and Forecast - by pharmaceutical
- 11. Asia Pacific US Contract Manufacturing Services Industry Analysis, Insights and Forecast, 2020-2032
- 11.1. Market Analysis, Insights and Forecast - by pharmaceutical
- 11.1.1. Current Market Scenario and growth influencers
- 11.1.2. Market B
- 11.1.3. Active P
- 11.1.3.1. Small molecule
- 11.1.3.2. Large Molecule
- 11.1.3.3. High Potency API (HPAPI)
- 11.1.4. Finished
- 11.1.4.1. Solid Dose Formulation
- 11.1.4.2. Liquid Dose Formulation
- 11.1.4.3. Injectable Dose Formulation
- 11.1.5. Secondary Packaging
- 11.2. Market Analysis, Insights and Forecast - by Food processing & manufacturing
- 11.2.1. Market Breakdown - by Service Type
- 11.2.2. Current Market Scenario and growth influencers
- 11.2.3. Food Manufacturing Services
- 11.2.3.1. Convenience Foods
- 11.2.3.2. Bakery Products
- 11.2.3.3. Confectionary Products
- 11.2.3.4. Dairy Products
- 11.2.3.5. Research & Development
- 11.2.3.6. Food Packaging Services
- 11.3. Market Analysis, Insights and Forecast - by Beverage
- 11.3.1. Current Market Scenario and growth influencers
- 11.3.2. Market B
- 11.3.2.1. Beer
- 11.3.2.2. Carbonated Drinks & Fruit-based Beverages
- 11.3.2.3. Bottled Water
- 11.3.2.4. Others (Sport Drinks)
- 11.4. Market Analysis, Insights and Forecast - by Personal Care
- 11.4.1. Current Market Scenario and growth influencers
- 11.4.2. Market Breakdown - by Type
- 11.4.2.1. Skin Care
- 11.4.2.2. Hair Care
- 11.4.2.3. Make up & Color Cosmetics
- 11.4.2.4. Others
- 11.1. Market Analysis, Insights and Forecast - by pharmaceutical
- 12. Competitive Analysis
- 12.1. Company Profiles
- 12.1.1 Catalent Inc
- 12.1.1.1. Company Overview
- 12.1.1.2. Products
- 12.1.1.3. Company Financials
- 12.1.1.4. SWOT Analysis
- 12.1.2 Jubilant
- 12.1.2.1. Company Overview
- 12.1.2.2. Products
- 12.1.2.3. Company Financials
- 12.1.2.4. SWOT Analysis
- 12.1.3 Lonza Group
- 12.1.3.1. Company Overview
- 12.1.3.2. Products
- 12.1.3.3. Company Financials
- 12.1.3.4. SWOT Analysis
- 12.1.4 Aenova Group
- 12.1.4.1. Company Overview
- 12.1.4.2. Products
- 12.1.4.3. Company Financials
- 12.1.4.4. SWOT Analysis
- 12.1.5 Amerilab Technologies Inc
- 12.1.5.1. Company Overview
- 12.1.5.2. Products
- 12.1.5.3. Company Financials
- 12.1.5.4. SWOT Analysis
- 12.1.6 Bernet Food & Beverage
- 12.1.6.1. Company Overview
- 12.1.6.2. Products
- 12.1.6.3. Company Financials
- 12.1.6.4. SWOT Analysis
- 12.1.7 Big Brands LLC
- 12.1.7.1. Company Overview
- 12.1.7.2. Products
- 12.1.7.3. Company Financials
- 12.1.7.4. SWOT Analysis
- 12.1.8 Delamaine Fine Foods Limited
- 12.1.8.1. Company Overview
- 12.1.8.2. Products
- 12.1.8.3. Company Financials
- 12.1.8.4. SWOT Analysis
- 12.1.9 Brooklyn Bottling
- 12.1.9.1. Company Overview
- 12.1.9.2. Products
- 12.1.9.3. Company Financials
- 12.1.9.4. SWOT Analysis
- 12.1.10 CSD Co-Packers
- 12.1.10.1. Company Overview
- 12.1.10.2. Products
- 12.1.10.3. Company Financials
- 12.1.10.4. SWOT Analysis
- 12.1.11 Southeast Bottling & Beverages
- 12.1.11.1. Company Overview
- 12.1.11.2. Products
- 12.1.11.3. Company Financials
- 12.1.11.4. SWOT Analysis
- 12.1.12 G3 Enterprises
- 12.1.12.1. Company Overview
- 12.1.12.2. Products
- 12.1.12.3. Company Financials
- 12.1.12.4. SWOT Analysis
- 12.1.13 Western Innovations
- 12.1.13.1. Company Overview
- 12.1.13.2. Products
- 12.1.13.3. Company Financials
- 12.1.13.4. SWOT Analysis
- 12.1.14 Niagara Bottling and Robinsons Breweries
- 12.1.14.1. Company Overview
- 12.1.14.2. Products
- 12.1.14.3. Company Financials
- 12.1.14.4. SWOT Analysis
- 12.1.15 KIK Custom Products
- 12.1.15.1. Company Overview
- 12.1.15.2. Products
- 12.1.15.3. Company Financials
- 12.1.15.4. SWOT Analysis
- 12.1.16 Sensible Organics
- 12.1.16.1. Company Overview
- 12.1.16.2. Products
- 12.1.16.3. Company Financials
- 12.1.16.4. SWOT Analysis
- 12.1.17 Colep
- 12.1.17.1. Company Overview
- 12.1.17.2. Products
- 12.1.17.3. Company Financials
- 12.1.17.4. SWOT Analysis
- 12.1.18 Cosmetic Essence LLC
- 12.1.18.1. Company Overview
- 12.1.18.2. Products
- 12.1.18.3. Company Financials
- 12.1.18.4. SWOT Analysis
- 12.1.19 Formula Cap*List Not Exhaustive
- 12.1.19.1. Company Overview
- 12.1.19.2. Products
- 12.1.19.3. Company Financials
- 12.1.19.4. SWOT Analysis
- 12.1.1 Catalent Inc
- 12.2. Market Entropy
- 12.2.1 Company's Key Areas Served
- 12.2.2 Recent Developments
- 12.3. Company Market Share Analysis 2025
- 12.3.1 Top 5 Companies Market Share Analysis
- 12.3.2 Top 3 Companies Market Share Analysis
- 12.4. List of Potential Customers
- 13. Research Methodology
List of Figures
- Figure 1: Global US Contract Manufacturing Services Industry Revenue Breakdown (billion, %) by Region 2025 & 2033
- Figure 2: North America US Contract Manufacturing Services Industry Revenue (billion), by pharmaceutical 2025 & 2033
- Figure 3: North America US Contract Manufacturing Services Industry Revenue Share (%), by pharmaceutical 2025 & 2033
- Figure 4: North America US Contract Manufacturing Services Industry Revenue (billion), by Food processing & manufacturing 2025 & 2033
- Figure 5: North America US Contract Manufacturing Services Industry Revenue Share (%), by Food processing & manufacturing 2025 & 2033
- Figure 6: North America US Contract Manufacturing Services Industry Revenue (billion), by Beverage 2025 & 2033
- Figure 7: North America US Contract Manufacturing Services Industry Revenue Share (%), by Beverage 2025 & 2033
- Figure 8: North America US Contract Manufacturing Services Industry Revenue (billion), by Personal Care 2025 & 2033
- Figure 9: North America US Contract Manufacturing Services Industry Revenue Share (%), by Personal Care 2025 & 2033
- Figure 10: North America US Contract Manufacturing Services Industry Revenue (billion), by Country 2025 & 2033
- Figure 11: North America US Contract Manufacturing Services Industry Revenue Share (%), by Country 2025 & 2033
- Figure 12: South America US Contract Manufacturing Services Industry Revenue (billion), by pharmaceutical 2025 & 2033
- Figure 13: South America US Contract Manufacturing Services Industry Revenue Share (%), by pharmaceutical 2025 & 2033
- Figure 14: South America US Contract Manufacturing Services Industry Revenue (billion), by Food processing & manufacturing 2025 & 2033
- Figure 15: South America US Contract Manufacturing Services Industry Revenue Share (%), by Food processing & manufacturing 2025 & 2033
- Figure 16: South America US Contract Manufacturing Services Industry Revenue (billion), by Beverage 2025 & 2033
- Figure 17: South America US Contract Manufacturing Services Industry Revenue Share (%), by Beverage 2025 & 2033
- Figure 18: South America US Contract Manufacturing Services Industry Revenue (billion), by Personal Care 2025 & 2033
- Figure 19: South America US Contract Manufacturing Services Industry Revenue Share (%), by Personal Care 2025 & 2033
- Figure 20: South America US Contract Manufacturing Services Industry Revenue (billion), by Country 2025 & 2033
- Figure 21: South America US Contract Manufacturing Services Industry Revenue Share (%), by Country 2025 & 2033
- Figure 22: Europe US Contract Manufacturing Services Industry Revenue (billion), by pharmaceutical 2025 & 2033
- Figure 23: Europe US Contract Manufacturing Services Industry Revenue Share (%), by pharmaceutical 2025 & 2033
- Figure 24: Europe US Contract Manufacturing Services Industry Revenue (billion), by Food processing & manufacturing 2025 & 2033
- Figure 25: Europe US Contract Manufacturing Services Industry Revenue Share (%), by Food processing & manufacturing 2025 & 2033
- Figure 26: Europe US Contract Manufacturing Services Industry Revenue (billion), by Beverage 2025 & 2033
- Figure 27: Europe US Contract Manufacturing Services Industry Revenue Share (%), by Beverage 2025 & 2033
- Figure 28: Europe US Contract Manufacturing Services Industry Revenue (billion), by Personal Care 2025 & 2033
- Figure 29: Europe US Contract Manufacturing Services Industry Revenue Share (%), by Personal Care 2025 & 2033
- Figure 30: Europe US Contract Manufacturing Services Industry Revenue (billion), by Country 2025 & 2033
- Figure 31: Europe US Contract Manufacturing Services Industry Revenue Share (%), by Country 2025 & 2033
- Figure 32: Middle East & Africa US Contract Manufacturing Services Industry Revenue (billion), by pharmaceutical 2025 & 2033
- Figure 33: Middle East & Africa US Contract Manufacturing Services Industry Revenue Share (%), by pharmaceutical 2025 & 2033
- Figure 34: Middle East & Africa US Contract Manufacturing Services Industry Revenue (billion), by Food processing & manufacturing 2025 & 2033
- Figure 35: Middle East & Africa US Contract Manufacturing Services Industry Revenue Share (%), by Food processing & manufacturing 2025 & 2033
- Figure 36: Middle East & Africa US Contract Manufacturing Services Industry Revenue (billion), by Beverage 2025 & 2033
- Figure 37: Middle East & Africa US Contract Manufacturing Services Industry Revenue Share (%), by Beverage 2025 & 2033
- Figure 38: Middle East & Africa US Contract Manufacturing Services Industry Revenue (billion), by Personal Care 2025 & 2033
- Figure 39: Middle East & Africa US Contract Manufacturing Services Industry Revenue Share (%), by Personal Care 2025 & 2033
- Figure 40: Middle East & Africa US Contract Manufacturing Services Industry Revenue (billion), by Country 2025 & 2033
- Figure 41: Middle East & Africa US Contract Manufacturing Services Industry Revenue Share (%), by Country 2025 & 2033
- Figure 42: Asia Pacific US Contract Manufacturing Services Industry Revenue (billion), by pharmaceutical 2025 & 2033
- Figure 43: Asia Pacific US Contract Manufacturing Services Industry Revenue Share (%), by pharmaceutical 2025 & 2033
- Figure 44: Asia Pacific US Contract Manufacturing Services Industry Revenue (billion), by Food processing & manufacturing 2025 & 2033
- Figure 45: Asia Pacific US Contract Manufacturing Services Industry Revenue Share (%), by Food processing & manufacturing 2025 & 2033
- Figure 46: Asia Pacific US Contract Manufacturing Services Industry Revenue (billion), by Beverage 2025 & 2033
- Figure 47: Asia Pacific US Contract Manufacturing Services Industry Revenue Share (%), by Beverage 2025 & 2033
- Figure 48: Asia Pacific US Contract Manufacturing Services Industry Revenue (billion), by Personal Care 2025 & 2033
- Figure 49: Asia Pacific US Contract Manufacturing Services Industry Revenue Share (%), by Personal Care 2025 & 2033
- Figure 50: Asia Pacific US Contract Manufacturing Services Industry Revenue (billion), by Country 2025 & 2033
- Figure 51: Asia Pacific US Contract Manufacturing Services Industry Revenue Share (%), by Country 2025 & 2033
List of Tables
- Table 1: Global US Contract Manufacturing Services Industry Revenue billion Forecast, by pharmaceutical 2020 & 2033
- Table 2: Global US Contract Manufacturing Services Industry Revenue billion Forecast, by Food processing & manufacturing 2020 & 2033
- Table 3: Global US Contract Manufacturing Services Industry Revenue billion Forecast, by Beverage 2020 & 2033
- Table 4: Global US Contract Manufacturing Services Industry Revenue billion Forecast, by Personal Care 2020 & 2033
- Table 5: Global US Contract Manufacturing Services Industry Revenue billion Forecast, by Region 2020 & 2033
- Table 6: Global US Contract Manufacturing Services Industry Revenue billion Forecast, by pharmaceutical 2020 & 2033
- Table 7: Global US Contract Manufacturing Services Industry Revenue billion Forecast, by Food processing & manufacturing 2020 & 2033
- Table 8: Global US Contract Manufacturing Services Industry Revenue billion Forecast, by Beverage 2020 & 2033
- Table 9: Global US Contract Manufacturing Services Industry Revenue billion Forecast, by Personal Care 2020 & 2033
- Table 10: Global US Contract Manufacturing Services Industry Revenue billion Forecast, by Country 2020 & 2033
- Table 11: United States US Contract Manufacturing Services Industry Revenue (billion) Forecast, by Application 2020 & 2033
- Table 12: Canada US Contract Manufacturing Services Industry Revenue (billion) Forecast, by Application 2020 & 2033
- Table 13: Mexico US Contract Manufacturing Services Industry Revenue (billion) Forecast, by Application 2020 & 2033
- Table 14: Global US Contract Manufacturing Services Industry Revenue billion Forecast, by pharmaceutical 2020 & 2033
- Table 15: Global US Contract Manufacturing Services Industry Revenue billion Forecast, by Food processing & manufacturing 2020 & 2033
- Table 16: Global US Contract Manufacturing Services Industry Revenue billion Forecast, by Beverage 2020 & 2033
- Table 17: Global US Contract Manufacturing Services Industry Revenue billion Forecast, by Personal Care 2020 & 2033
- Table 18: Global US Contract Manufacturing Services Industry Revenue billion Forecast, by Country 2020 & 2033
- Table 19: Brazil US Contract Manufacturing Services Industry Revenue (billion) Forecast, by Application 2020 & 2033
- Table 20: Argentina US Contract Manufacturing Services Industry Revenue (billion) Forecast, by Application 2020 & 2033
- Table 21: Rest of South America US Contract Manufacturing Services Industry Revenue (billion) Forecast, by Application 2020 & 2033
- Table 22: Global US Contract Manufacturing Services Industry Revenue billion Forecast, by pharmaceutical 2020 & 2033
- Table 23: Global US Contract Manufacturing Services Industry Revenue billion Forecast, by Food processing & manufacturing 2020 & 2033
- Table 24: Global US Contract Manufacturing Services Industry Revenue billion Forecast, by Beverage 2020 & 2033
- Table 25: Global US Contract Manufacturing Services Industry Revenue billion Forecast, by Personal Care 2020 & 2033
- Table 26: Global US Contract Manufacturing Services Industry Revenue billion Forecast, by Country 2020 & 2033
- Table 27: United Kingdom US Contract Manufacturing Services Industry Revenue (billion) Forecast, by Application 2020 & 2033
- Table 28: Germany US Contract Manufacturing Services Industry Revenue (billion) Forecast, by Application 2020 & 2033
- Table 29: France US Contract Manufacturing Services Industry Revenue (billion) Forecast, by Application 2020 & 2033
- Table 30: Italy US Contract Manufacturing Services Industry Revenue (billion) Forecast, by Application 2020 & 2033
- Table 31: Spain US Contract Manufacturing Services Industry Revenue (billion) Forecast, by Application 2020 & 2033
- Table 32: Russia US Contract Manufacturing Services Industry Revenue (billion) Forecast, by Application 2020 & 2033
- Table 33: Benelux US Contract Manufacturing Services Industry Revenue (billion) Forecast, by Application 2020 & 2033
- Table 34: Nordics US Contract Manufacturing Services Industry Revenue (billion) Forecast, by Application 2020 & 2033
- Table 35: Rest of Europe US Contract Manufacturing Services Industry Revenue (billion) Forecast, by Application 2020 & 2033
- Table 36: Global US Contract Manufacturing Services Industry Revenue billion Forecast, by pharmaceutical 2020 & 2033
- Table 37: Global US Contract Manufacturing Services Industry Revenue billion Forecast, by Food processing & manufacturing 2020 & 2033
- Table 38: Global US Contract Manufacturing Services Industry Revenue billion Forecast, by Beverage 2020 & 2033
- Table 39: Global US Contract Manufacturing Services Industry Revenue billion Forecast, by Personal Care 2020 & 2033
- Table 40: Global US Contract Manufacturing Services Industry Revenue billion Forecast, by Country 2020 & 2033
- Table 41: Turkey US Contract Manufacturing Services Industry Revenue (billion) Forecast, by Application 2020 & 2033
- Table 42: Israel US Contract Manufacturing Services Industry Revenue (billion) Forecast, by Application 2020 & 2033
- Table 43: GCC US Contract Manufacturing Services Industry Revenue (billion) Forecast, by Application 2020 & 2033
- Table 44: North Africa US Contract Manufacturing Services Industry Revenue (billion) Forecast, by Application 2020 & 2033
- Table 45: South Africa US Contract Manufacturing Services Industry Revenue (billion) Forecast, by Application 2020 & 2033
- Table 46: Rest of Middle East & Africa US Contract Manufacturing Services Industry Revenue (billion) Forecast, by Application 2020 & 2033
- Table 47: Global US Contract Manufacturing Services Industry Revenue billion Forecast, by pharmaceutical 2020 & 2033
- Table 48: Global US Contract Manufacturing Services Industry Revenue billion Forecast, by Food processing & manufacturing 2020 & 2033
- Table 49: Global US Contract Manufacturing Services Industry Revenue billion Forecast, by Beverage 2020 & 2033
- Table 50: Global US Contract Manufacturing Services Industry Revenue billion Forecast, by Personal Care 2020 & 2033
- Table 51: Global US Contract Manufacturing Services Industry Revenue billion Forecast, by Country 2020 & 2033
- Table 52: China US Contract Manufacturing Services Industry Revenue (billion) Forecast, by Application 2020 & 2033
- Table 53: India US Contract Manufacturing Services Industry Revenue (billion) Forecast, by Application 2020 & 2033
- Table 54: Japan US Contract Manufacturing Services Industry Revenue (billion) Forecast, by Application 2020 & 2033
- Table 55: South Korea US Contract Manufacturing Services Industry Revenue (billion) Forecast, by Application 2020 & 2033
- Table 56: ASEAN US Contract Manufacturing Services Industry Revenue (billion) Forecast, by Application 2020 & 2033
- Table 57: Oceania US Contract Manufacturing Services Industry Revenue (billion) Forecast, by Application 2020 & 2033
- Table 58: Rest of Asia Pacific US Contract Manufacturing Services Industry Revenue (billion) Forecast, by Application 2020 & 2033
Frequently Asked Questions
1. What is the projected Compound Annual Growth Rate (CAGR) of the US Contract Manufacturing Services Industry?
The projected CAGR is approximately 6.8%.
2. Which companies are prominent players in the US Contract Manufacturing Services Industry?
Key companies in the market include Catalent Inc, Jubilant, Lonza Group, Aenova Group, Amerilab Technologies Inc, Bernet Food & Beverage, Big Brands LLC, Delamaine Fine Foods Limited, Brooklyn Bottling, CSD Co-Packers, Southeast Bottling & Beverages, G3 Enterprises, Western Innovations, Niagara Bottling and Robinsons Breweries, KIK Custom Products, Sensible Organics, Colep, Cosmetic Essence LLC, Formula Cap*List Not Exhaustive.
3. What are the main segments of the US Contract Manufacturing Services Industry?
The market segments include pharmaceutical, Food processing & manufacturing, Beverage, Personal Care.
4. Can you provide details about the market size?
The market size is estimated to be USD 101.6 billion as of 2022.
5. What are some drivers contributing to market growth?
Evolution of service offerings has enabled organizations to increasingly rely on contract manufacturers for their production needs; Challenges due to outsourcing of manufacturing to Asian countries has played a key role in prompting organizations to rely on local contract manufacturers.
6. What are the notable trends driving market growth?
Growth of Evolution of service offerings has enabled organizations to increasingly rely on contract manufacturers for their production needs.
7. Are there any restraints impacting market growth?
Evolution of service offerings has enabled organizations to increasingly rely on contract manufacturers for their production needs; Challenges due to outsourcing of manufacturing to Asian countries has played a key role in prompting organizations to rely on local contract manufacturers.
8. Can you provide examples of recent developments in the market?
May 2022 - Lonza and Israel Biotech Fund Collaborated Framework Agreement to Support Biologics and Small Molecules Development and Manufacture for Portfolio Companies which Facilitate Access to Israeli Market for Lonza.
9. What pricing options are available for accessing the report?
Pricing options include single-user, multi-user, and enterprise licenses priced at USD 3800, USD 4500, and USD 5800 respectively.
10. Is the market size provided in terms of value or volume?
The market size is provided in terms of value, measured in billion.
11. Are there any specific market keywords associated with the report?
Yes, the market keyword associated with the report is "US Contract Manufacturing Services Industry," which aids in identifying and referencing the specific market segment covered.
12. How do I determine which pricing option suits my needs best?
The pricing options vary based on user requirements and access needs. Individual users may opt for single-user licenses, while businesses requiring broader access may choose multi-user or enterprise licenses for cost-effective access to the report.
13. Are there any additional resources or data provided in the US Contract Manufacturing Services Industry report?
While the report offers comprehensive insights, it's advisable to review the specific contents or supplementary materials provided to ascertain if additional resources or data are available.
14. How can I stay updated on further developments or reports in the US Contract Manufacturing Services Industry?
To stay informed about further developments, trends, and reports in the US Contract Manufacturing Services Industry, consider subscribing to industry newsletters, following relevant companies and organizations, or regularly checking reputable industry news sources and publications.
Methodology
Step 1 - Identification of Relevant Samples Size from Population Database


Step 2 - Approaches for Defining Global Market Size (Value, Volume* & Price*)

Note*: In applicable scenarios
Step 3 - Data Sources
Primary Research
- Web Analytics
- Survey Reports
- Research Institute
- Latest Research Reports
- Opinion Leaders
Secondary Research
- Annual Reports
- White Paper
- Latest Press Release
- Industry Association
- Paid Database
- Investor Presentations

Step 4 - Data Triangulation
Involves using different sources of information in order to increase the validity of a study
These sources are likely to be stakeholders in a program - participants, other researchers, program staff, other community members, and so on.
Then we put all data in single framework & apply various statistical tools to find out the dynamic on the market.
During the analysis stage, feedback from the stakeholder groups would be compared to determine areas of agreement as well as areas of divergence