
Key Insights
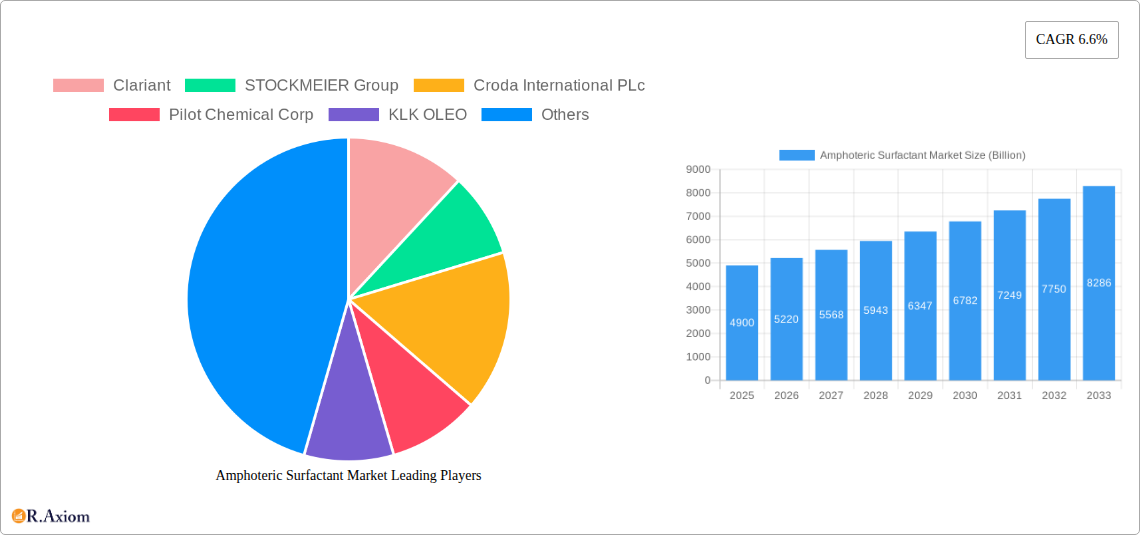
The amphoteric surfactant market, valued at $4.9 billion in 2025, is projected to experience robust growth, driven by increasing demand across diverse sectors. A Compound Annual Growth Rate (CAGR) of 6.6% from 2025 to 2033 indicates a significant expansion, primarily fueled by the escalating popularity of personal care and cosmetic products incorporating these surfactants for their mild yet effective cleansing properties. The rise of eco-conscious consumers further boosts market growth, as amphoteric surfactants are known for their biodegradability and relatively low environmental impact compared to some other surfactant types. Growth is also spurred by the expansion of the detergents and industrial cleaning agents market, where amphoteric surfactants are valued for their excellent cleaning power and compatibility with various hard water conditions. While the oil and gas industry represents a smaller segment, it contributes to overall market growth through the use of these surfactants in specialized applications like enhanced oil recovery. The market is segmented by type (Betaines, Amphoacetates, Aminoxides, and Others) and application (Personal Care & Cosmetics, Detergents & Industrial Cleaning, Oil & Gas, Flame Retardants, and Others), offering opportunities for targeted market penetration by manufacturers. Competition is intense, with major players like Clariant, BASF, and Croda International vying for market share through innovation and strategic partnerships. Regional variations exist, with North America and Europe representing mature markets while the Asia-Pacific region exhibits the most significant growth potential due to rapid industrialization and rising disposable incomes.
The market's future trajectory is likely influenced by several factors. Stringent environmental regulations regarding surfactant biodegradability are expected to drive innovation toward more sustainable amphoteric surfactant formulations. Furthermore, ongoing research and development efforts focusing on improved performance characteristics, such as enhanced foam stability and mildness, will further propel market growth. However, fluctuations in raw material prices and potential economic downturns could pose challenges. The successful navigation of these factors will require manufacturers to prioritize cost-optimization strategies, sustainable sourcing, and the development of high-value, specialized amphoteric surfactants catering to niche applications. This approach will allow them to maintain competitiveness and leverage the strong underlying growth drivers in the market.
This comprehensive report provides an in-depth analysis of the global Amphoteric Surfactant market, offering valuable insights for stakeholders across the value chain. The report covers market size, segmentation, growth drivers, challenges, competitive landscape, and future outlook, covering the period from 2019 to 2033, with 2025 as the base year and estimated year. The report utilizes a robust methodology to project market trends and offers actionable recommendations for businesses operating in this dynamic sector. The market is expected to reach xx Billion by 2033.
Amphoteric Surfactant Market Market Concentration & Innovation
The Amphoteric Surfactant market exhibits a moderately concentrated landscape, with key players such as Clariant, STOCKMEIER Group, Croda International Plc, and BASF SE holding significant market share. However, the market is also characterized by the presence of numerous smaller players, creating a competitive environment. Market share data for 2024 reveals Clariant holds approximately 15%, STOCKMEIER Group at 12%, and Croda International Plc at 10%, while BASF SE accounts for 8%. The remaining share is distributed among other players.
Innovation is a key driver within this market, with continuous efforts focused on developing sustainable and high-performance amphoteric surfactants. Regulatory frameworks, such as those pertaining to environmental impact and safety, significantly influence product development. Bio-based and biodegradable surfactants are gaining traction, driven by increasing consumer demand for eco-friendly products. Product substitutes, such as anionic and non-ionic surfactants, pose a competitive challenge, but the unique properties of amphoteric surfactants, like mildness and excellent foaming, maintain their market relevance. M&A activities have been moderate in recent years, with deal values ranging from xx Billion to xx Billion, largely driven by companies seeking to expand their product portfolios and geographic reach. End-user trends, particularly in personal care and industrial cleaning, significantly impact market demand.
- Market Concentration: Moderately concentrated with a few dominant players.
- Innovation Drivers: Sustainability, performance enhancement, regulatory compliance.
- Regulatory Frameworks: Stringent regulations on environmental impact and safety.
- Product Substitutes: Anionic and non-ionic surfactants.
- End-User Trends: Growing demand for eco-friendly and high-performance products.
- M&A Activities: Moderate activity with deal values ranging from xx Billion to xx Billion.
Amphoteric Surfactant Market Industry Trends & Insights
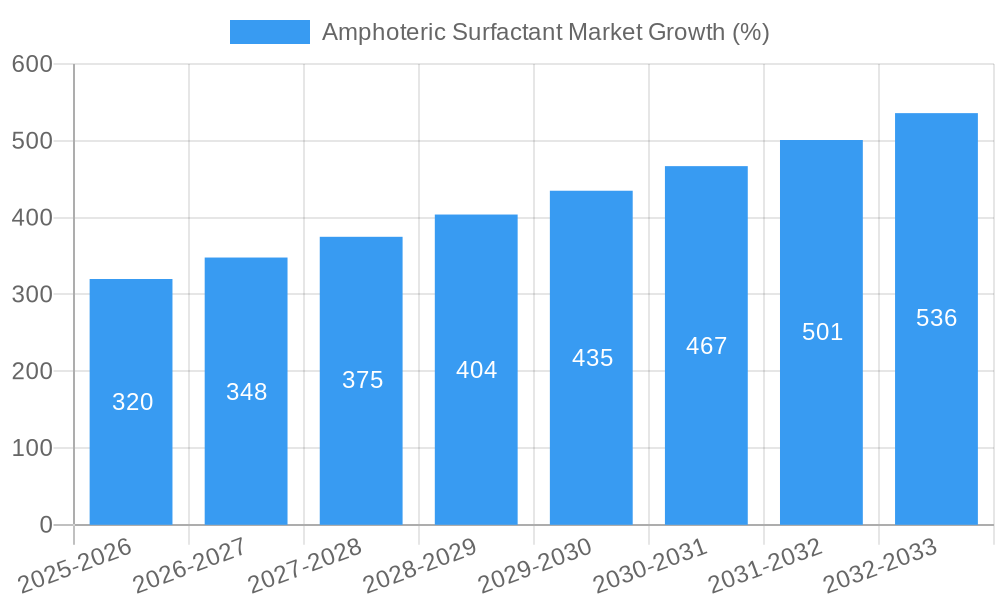
The global amphoteric surfactant market is experiencing robust growth, driven by increasing demand from various end-use sectors. The market is projected to register a CAGR of xx% during the forecast period (2025-2033). This growth is fueled by several factors, including the rising popularity of personal care products, the expansion of the industrial cleaning sector, and the increasing adoption of amphoteric surfactants in oil and gas applications. Technological advancements, such as the development of novel surfactant formulations with improved performance characteristics, are further boosting market growth. Consumer preferences for natural and sustainable products are creating opportunities for bio-based amphoteric surfactants.
Competitive dynamics are intense, with leading players focusing on product innovation, strategic partnerships, and geographic expansion to maintain market share. The market penetration of amphoteric surfactants in niche applications, such as flame retardants, is gradually increasing. However, fluctuating raw material prices and stringent environmental regulations pose challenges to market growth.
Dominant Markets & Segments in Amphoteric Surfactant Market
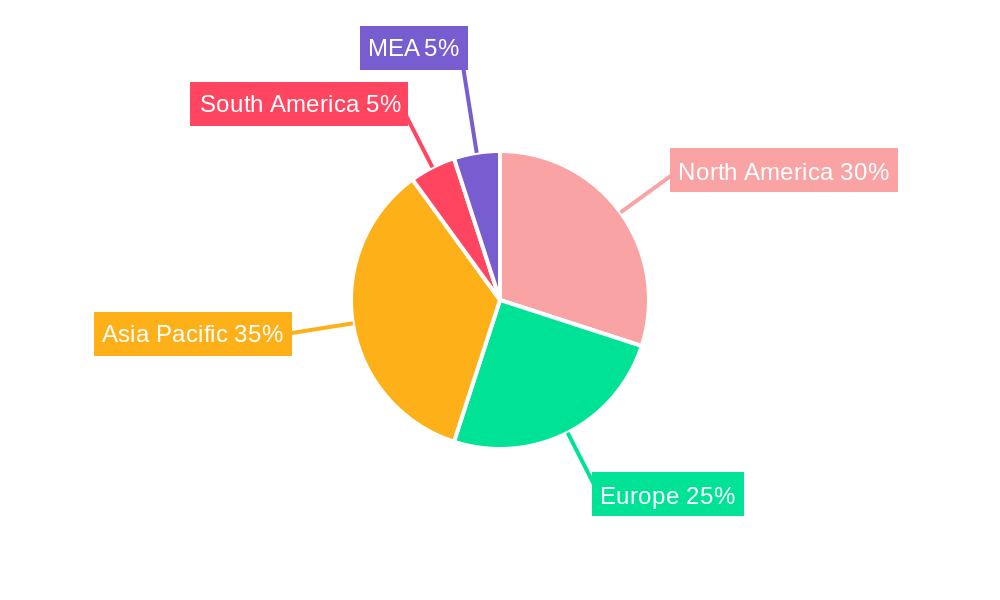
Dominant Region/Country: North America and Europe currently hold dominant positions in the amphoteric surfactant market, owing to high demand from established industries. However, the Asia-Pacific region is expected to witness substantial growth in the coming years due to increasing industrialization and rising disposable incomes.
Dominant Segments:
By Type: Betaines hold the largest market share due to their versatile properties and widespread applications. Amphoacetates are also a significant segment owing to their excellent foaming and mildness. Aminoxides are used in niche applications.
By Application: Personal care and cosmetics remain the leading application segment, driven by the growing demand for gentle and effective cleansing products. Detergents and industrial cleaning agents constitute another significant segment, followed by oil and gas applications, which are witnessing steady growth.
Key Drivers by Segment:
- Personal Care & Cosmetics: Growing demand for mild cleansers, increasing consumer awareness of skincare.
- Detergents & Industrial Cleaning: Expanding industrial cleaning sector, rising demand for effective cleaning solutions.
- Oil & Gas: Improved oil recovery techniques, need for effective emulsifiers and demulsifiers.
- Flame Retardants: Increasing demand for fire safety measures in various industries.
Dominance Analysis: The dominance of specific segments is attributed to factors such as established market presence, readily available raw materials, and strong regulatory support. The Asia-Pacific region's growth is fueled by increasing industrialization, growing middle class, and government initiatives promoting the use of sustainable products.
Amphoteric Surfactant Market Product Developments
Recent product innovations focus on developing sustainable, high-performance amphoteric surfactants with improved biodegradability, reduced environmental impact, and enhanced functionality. This includes the development of new formulations tailored for specific applications, such as high-efficiency laundry detergents and specialized personal care products. These advancements are driven by technological trends like green chemistry and nanotechnology, ensuring better market fit and competitive advantages.
Report Scope & Segmentation Analysis
Type: The report segments the market based on type, including Betaines, Amphoacetates, Aminoxides, and Other Types. Each segment's growth projection, market size, and competitive dynamics are analyzed. Betaines are projected to grow at xx% CAGR, while Amphoacetates are expected to see a xx% CAGR.
Application: The report categorizes the market by application, including Personal Care and Cosmetics, Detergents and Industrial Cleaning Agents, Oil and Gas, Flame Retardants, and Other Applications. Each segment's market size, growth projections, and competitive landscape are meticulously assessed. The Personal Care and Cosmetics segment is projected to grow at a significant CAGR.
Key Drivers of Amphoteric Surfactant Market Growth
Several factors contribute to the growth of the amphoteric surfactant market:
- Rising demand for sustainable products: Consumers are increasingly opting for eco-friendly products, driving the demand for biodegradable amphoteric surfactants.
- Growth of the personal care and cosmetics industry: The increasing use of amphoteric surfactants in various personal care products is fueling market expansion.
- Expansion of the industrial cleaning sector: The rising demand for effective and environmentally friendly cleaning agents is boosting the market for amphoteric surfactants.
- Technological advancements: Innovations in surfactant formulations are creating new opportunities for growth.
Challenges in the Amphoteric Surfactant Market Sector
The amphoteric surfactant market faces certain challenges:
- Fluctuating raw material prices: Volatility in the prices of raw materials impacts production costs and profitability.
- Stringent environmental regulations: Compliance with environmental regulations requires significant investments and can hinder market expansion.
- Intense competition: The presence of numerous players creates a competitive landscape, requiring companies to constantly innovate and differentiate themselves. This competitive pressure directly influences pricing strategies and profit margins.
Emerging Opportunities in Amphoteric Surfactant Market
Several opportunities exist in the amphoteric surfactant market:
- Expanding into emerging markets: Untapped potential exists in developing economies with growing demand for personal care and industrial cleaning products.
- Development of novel surfactant formulations: Innovations in surfactant technology can create new applications and expand the market.
- Focus on sustainability: The increasing preference for eco-friendly products presents an opportunity for companies to develop and market bio-based and biodegradable amphoteric surfactants.
Leading Players in the Amphoteric Surfactant Market Market
- Clariant
- STOCKMEIER Group
- Croda International Plc
- Pilot Chemical Corp
- KLK OLEO
- Evonik Industries AG
- BASF SE
- Alfa Chemistry
- The Lubrizol Corporation
- NOF CORPORATION
- Chempri BV
- Kao Corporation
Key Developments in Amphoteric Surfactant Market Industry
- 2022-Q4: Clariant launched a new range of sustainable amphoteric surfactants.
- 2023-Q1: Croda International Plc acquired a smaller surfactant manufacturer, expanding its product portfolio.
- 2023-Q2: BASF SE invested in research and development of bio-based amphoteric surfactants. (Further specific developments can be added here as they become available.)
Strategic Outlook for Amphoteric Surfactant Market Market
The amphoteric surfactant market is poised for significant growth in the coming years. The increasing demand for sustainable products, technological innovations, and the expansion of key end-use industries will drive market expansion. Companies with a focus on sustainability, innovation, and strategic partnerships are well-positioned to capitalize on the market's potential. The market is expected to witness healthy growth, with opportunities particularly strong in developing economies and specialized applications.
Amphoteric Surfactant Market Segmentation
-
1. Type
- 1.1. Betaines
- 1.2. Amphoacetates
- 1.3. Aminoxides
- 1.4. Other Types
-
2. Application
- 2.1. Personal Care and Cosmetics
- 2.2. Detergents and Industrial Cleaning Agents
- 2.3. Oil and Gas
- 2.4. Flame Retardants
- 2.5. Other Applications
Amphoteric Surfactant Market Segmentation By Geography
-
1. Asia Pacific
- 1.1. China
- 1.2. India
- 1.3. Japan
- 1.4. South Korea
- 1.5. Rest of Asia Pacific
-
2. North America
- 2.1. United States
- 2.2. Canada
- 2.3. Mexico
-
3. Europe
- 3.1. Germany
- 3.2. United Kingdom
- 3.3. Italy
- 3.4. France
- 3.5. Rest of Europe
-
4. South America
- 4.1. Brazil
- 4.2. Argentina
- 4.3. Rest of South America
-
5. Middle East and Africa
- 5.1. Saudi Arabia
- 5.2. South Africa
- 5.3. Rest of Middle East and Africa
Amphoteric Surfactant Market REPORT HIGHLIGHTS
| Aspects | Details |
|---|---|
| Study Period | 2019-2033 |
| Base Year | 2024 |
| Estimated Year | 2025 |
| Forecast Period | 2025-2033 |
| Historical Period | 2019-2024 |
| Growth Rate | CAGR of 6.6% from 2019-2033 |
| Segmentation |
|
Table of Contents
- 1. Introduction
- 1.1. Research Scope
- 1.2. Market Segmentation
- 1.3. Research Methodology
- 1.4. Definitions and Assumptions
- 2. Executive Summary
- 2.1. Introduction
- 3. Market Dynamics
- 3.1. Introduction
- 3.2. Market Drivers
- 3.2.1. Growing Demand from the Personal Care Industry; Other Drivers
- 3.3. Market Restrains
- 3.3.1. Health Concerns and Stringent Environmental Regulations; Impact of COVID-19 on the Market Studied
- 3.4. Market Trends
- 3.4.1. Growing Demand from the Personal Care and Cosmetics Industry
- 4. Market Factor Analysis
- 4.1. Porters Five Forces
- 4.2. Supply/Value Chain
- 4.3. PESTEL analysis
- 4.4. Market Entropy
- 4.5. Patent/Trademark Analysis
- 5. Global Amphoteric Surfactant Market Analysis, Insights and Forecast, 2019-2031
- 5.1. Market Analysis, Insights and Forecast - by Type
- 5.1.1. Betaines
- 5.1.2. Amphoacetates
- 5.1.3. Aminoxides
- 5.1.4. Other Types
- 5.2. Market Analysis, Insights and Forecast - by Application
- 5.2.1. Personal Care and Cosmetics
- 5.2.2. Detergents and Industrial Cleaning Agents
- 5.2.3. Oil and Gas
- 5.2.4. Flame Retardants
- 5.2.5. Other Applications
- 5.3. Market Analysis, Insights and Forecast - by Region
- 5.3.1. Asia Pacific
- 5.3.2. North America
- 5.3.3. Europe
- 5.3.4. South America
- 5.3.5. Middle East and Africa
- 5.1. Market Analysis, Insights and Forecast - by Type
- 6. Asia Pacific Amphoteric Surfactant Market Analysis, Insights and Forecast, 2019-2031
- 6.1. Market Analysis, Insights and Forecast - by Type
- 6.1.1. Betaines
- 6.1.2. Amphoacetates
- 6.1.3. Aminoxides
- 6.1.4. Other Types
- 6.2. Market Analysis, Insights and Forecast - by Application
- 6.2.1. Personal Care and Cosmetics
- 6.2.2. Detergents and Industrial Cleaning Agents
- 6.2.3. Oil and Gas
- 6.2.4. Flame Retardants
- 6.2.5. Other Applications
- 6.1. Market Analysis, Insights and Forecast - by Type
- 7. North America Amphoteric Surfactant Market Analysis, Insights and Forecast, 2019-2031
- 7.1. Market Analysis, Insights and Forecast - by Type
- 7.1.1. Betaines
- 7.1.2. Amphoacetates
- 7.1.3. Aminoxides
- 7.1.4. Other Types
- 7.2. Market Analysis, Insights and Forecast - by Application
- 7.2.1. Personal Care and Cosmetics
- 7.2.2. Detergents and Industrial Cleaning Agents
- 7.2.3. Oil and Gas
- 7.2.4. Flame Retardants
- 7.2.5. Other Applications
- 7.1. Market Analysis, Insights and Forecast - by Type
- 8. Europe Amphoteric Surfactant Market Analysis, Insights and Forecast, 2019-2031
- 8.1. Market Analysis, Insights and Forecast - by Type
- 8.1.1. Betaines
- 8.1.2. Amphoacetates
- 8.1.3. Aminoxides
- 8.1.4. Other Types
- 8.2. Market Analysis, Insights and Forecast - by Application
- 8.2.1. Personal Care and Cosmetics
- 8.2.2. Detergents and Industrial Cleaning Agents
- 8.2.3. Oil and Gas
- 8.2.4. Flame Retardants
- 8.2.5. Other Applications
- 8.1. Market Analysis, Insights and Forecast - by Type
- 9. South America Amphoteric Surfactant Market Analysis, Insights and Forecast, 2019-2031
- 9.1. Market Analysis, Insights and Forecast - by Type
- 9.1.1. Betaines
- 9.1.2. Amphoacetates
- 9.1.3. Aminoxides
- 9.1.4. Other Types
- 9.2. Market Analysis, Insights and Forecast - by Application
- 9.2.1. Personal Care and Cosmetics
- 9.2.2. Detergents and Industrial Cleaning Agents
- 9.2.3. Oil and Gas
- 9.2.4. Flame Retardants
- 9.2.5. Other Applications
- 9.1. Market Analysis, Insights and Forecast - by Type
- 10. Middle East and Africa Amphoteric Surfactant Market Analysis, Insights and Forecast, 2019-2031
- 10.1. Market Analysis, Insights and Forecast - by Type
- 10.1.1. Betaines
- 10.1.2. Amphoacetates
- 10.1.3. Aminoxides
- 10.1.4. Other Types
- 10.2. Market Analysis, Insights and Forecast - by Application
- 10.2.1. Personal Care and Cosmetics
- 10.2.2. Detergents and Industrial Cleaning Agents
- 10.2.3. Oil and Gas
- 10.2.4. Flame Retardants
- 10.2.5. Other Applications
- 10.1. Market Analysis, Insights and Forecast - by Type
- 11. North America Amphoteric Surfactant Market Analysis, Insights and Forecast, 2019-2031
- 11.1. Market Analysis, Insights and Forecast - By Country/Sub-region
- 11.1.1 United States
- 11.1.2 Canada
- 11.1.3 Mexico
- 12. Europe Amphoteric Surfactant Market Analysis, Insights and Forecast, 2019-2031
- 12.1. Market Analysis, Insights and Forecast - By Country/Sub-region
- 12.1.1 Germany
- 12.1.2 France
- 12.1.3 Italy
- 12.1.4 United Kingdom
- 12.1.5 Netherlands
- 12.1.6 Rest of Europe
- 13. Asia Pacific Amphoteric Surfactant Market Analysis, Insights and Forecast, 2019-2031
- 13.1. Market Analysis, Insights and Forecast - By Country/Sub-region
- 13.1.1 China
- 13.1.2 Japan
- 13.1.3 India
- 13.1.4 South Korea
- 13.1.5 Taiwan
- 13.1.6 Australia
- 13.1.7 Rest of Asia-Pacific
- 14. South America Amphoteric Surfactant Market Analysis, Insights and Forecast, 2019-2031
- 14.1. Market Analysis, Insights and Forecast - By Country/Sub-region
- 14.1.1 Brazil
- 14.1.2 Argentina
- 14.1.3 Rest of South America
- 15. MEA Amphoteric Surfactant Market Analysis, Insights and Forecast, 2019-2031
- 15.1. Market Analysis, Insights and Forecast - By Country/Sub-region
- 15.1.1 Middle East
- 15.1.2 Africa
- 16. Competitive Analysis
- 16.1. Global Market Share Analysis 2024
- 16.2. Company Profiles
- 16.2.1 Clariant
- 16.2.1.1. Overview
- 16.2.1.2. Products
- 16.2.1.3. SWOT Analysis
- 16.2.1.4. Recent Developments
- 16.2.1.5. Financials (Based on Availability)
- 16.2.2 STOCKMEIER Group
- 16.2.2.1. Overview
- 16.2.2.2. Products
- 16.2.2.3. SWOT Analysis
- 16.2.2.4. Recent Developments
- 16.2.2.5. Financials (Based on Availability)
- 16.2.3 Croda International PLc
- 16.2.3.1. Overview
- 16.2.3.2. Products
- 16.2.3.3. SWOT Analysis
- 16.2.3.4. Recent Developments
- 16.2.3.5. Financials (Based on Availability)
- 16.2.4 Pilot Chemical Corp
- 16.2.4.1. Overview
- 16.2.4.2. Products
- 16.2.4.3. SWOT Analysis
- 16.2.4.4. Recent Developments
- 16.2.4.5. Financials (Based on Availability)
- 16.2.5 KLK OLEO
- 16.2.5.1. Overview
- 16.2.5.2. Products
- 16.2.5.3. SWOT Analysis
- 16.2.5.4. Recent Developments
- 16.2.5.5. Financials (Based on Availability)
- 16.2.6 Evonik Industries AG
- 16.2.6.1. Overview
- 16.2.6.2. Products
- 16.2.6.3. SWOT Analysis
- 16.2.6.4. Recent Developments
- 16.2.6.5. Financials (Based on Availability)
- 16.2.7 BASF SE
- 16.2.7.1. Overview
- 16.2.7.2. Products
- 16.2.7.3. SWOT Analysis
- 16.2.7.4. Recent Developments
- 16.2.7.5. Financials (Based on Availability)
- 16.2.8 Alfa Chemistry
- 16.2.8.1. Overview
- 16.2.8.2. Products
- 16.2.8.3. SWOT Analysis
- 16.2.8.4. Recent Developments
- 16.2.8.5. Financials (Based on Availability)
- 16.2.9 The Lubrizol Corporation
- 16.2.9.1. Overview
- 16.2.9.2. Products
- 16.2.9.3. SWOT Analysis
- 16.2.9.4. Recent Developments
- 16.2.9.5. Financials (Based on Availability)
- 16.2.10 NOF CORPORATION
- 16.2.10.1. Overview
- 16.2.10.2. Products
- 16.2.10.3. SWOT Analysis
- 16.2.10.4. Recent Developments
- 16.2.10.5. Financials (Based on Availability)
- 16.2.11 Chempri BV
- 16.2.11.1. Overview
- 16.2.11.2. Products
- 16.2.11.3. SWOT Analysis
- 16.2.11.4. Recent Developments
- 16.2.11.5. Financials (Based on Availability)
- 16.2.12 Kao Corporation
- 16.2.12.1. Overview
- 16.2.12.2. Products
- 16.2.12.3. SWOT Analysis
- 16.2.12.4. Recent Developments
- 16.2.12.5. Financials (Based on Availability)
- 16.2.1 Clariant
List of Figures
- Figure 1: Global Amphoteric Surfactant Market Revenue Breakdown (Billion, %) by Region 2024 & 2032
- Figure 2: Global Amphoteric Surfactant Market Volume Breakdown (K Tons, %) by Region 2024 & 2032
- Figure 3: North America Amphoteric Surfactant Market Revenue (Billion), by Country 2024 & 2032
- Figure 4: North America Amphoteric Surfactant Market Volume (K Tons), by Country 2024 & 2032
- Figure 5: North America Amphoteric Surfactant Market Revenue Share (%), by Country 2024 & 2032
- Figure 6: North America Amphoteric Surfactant Market Volume Share (%), by Country 2024 & 2032
- Figure 7: Europe Amphoteric Surfactant Market Revenue (Billion), by Country 2024 & 2032
- Figure 8: Europe Amphoteric Surfactant Market Volume (K Tons), by Country 2024 & 2032
- Figure 9: Europe Amphoteric Surfactant Market Revenue Share (%), by Country 2024 & 2032
- Figure 10: Europe Amphoteric Surfactant Market Volume Share (%), by Country 2024 & 2032
- Figure 11: Asia Pacific Amphoteric Surfactant Market Revenue (Billion), by Country 2024 & 2032
- Figure 12: Asia Pacific Amphoteric Surfactant Market Volume (K Tons), by Country 2024 & 2032
- Figure 13: Asia Pacific Amphoteric Surfactant Market Revenue Share (%), by Country 2024 & 2032
- Figure 14: Asia Pacific Amphoteric Surfactant Market Volume Share (%), by Country 2024 & 2032
- Figure 15: South America Amphoteric Surfactant Market Revenue (Billion), by Country 2024 & 2032
- Figure 16: South America Amphoteric Surfactant Market Volume (K Tons), by Country 2024 & 2032
- Figure 17: South America Amphoteric Surfactant Market Revenue Share (%), by Country 2024 & 2032
- Figure 18: South America Amphoteric Surfactant Market Volume Share (%), by Country 2024 & 2032
- Figure 19: MEA Amphoteric Surfactant Market Revenue (Billion), by Country 2024 & 2032
- Figure 20: MEA Amphoteric Surfactant Market Volume (K Tons), by Country 2024 & 2032
- Figure 21: MEA Amphoteric Surfactant Market Revenue Share (%), by Country 2024 & 2032
- Figure 22: MEA Amphoteric Surfactant Market Volume Share (%), by Country 2024 & 2032
- Figure 23: Asia Pacific Amphoteric Surfactant Market Revenue (Billion), by Type 2024 & 2032
- Figure 24: Asia Pacific Amphoteric Surfactant Market Volume (K Tons), by Type 2024 & 2032
- Figure 25: Asia Pacific Amphoteric Surfactant Market Revenue Share (%), by Type 2024 & 2032
- Figure 26: Asia Pacific Amphoteric Surfactant Market Volume Share (%), by Type 2024 & 2032
- Figure 27: Asia Pacific Amphoteric Surfactant Market Revenue (Billion), by Application 2024 & 2032
- Figure 28: Asia Pacific Amphoteric Surfactant Market Volume (K Tons), by Application 2024 & 2032
- Figure 29: Asia Pacific Amphoteric Surfactant Market Revenue Share (%), by Application 2024 & 2032
- Figure 30: Asia Pacific Amphoteric Surfactant Market Volume Share (%), by Application 2024 & 2032
- Figure 31: Asia Pacific Amphoteric Surfactant Market Revenue (Billion), by Country 2024 & 2032
- Figure 32: Asia Pacific Amphoteric Surfactant Market Volume (K Tons), by Country 2024 & 2032
- Figure 33: Asia Pacific Amphoteric Surfactant Market Revenue Share (%), by Country 2024 & 2032
- Figure 34: Asia Pacific Amphoteric Surfactant Market Volume Share (%), by Country 2024 & 2032
- Figure 35: North America Amphoteric Surfactant Market Revenue (Billion), by Type 2024 & 2032
- Figure 36: North America Amphoteric Surfactant Market Volume (K Tons), by Type 2024 & 2032
- Figure 37: North America Amphoteric Surfactant Market Revenue Share (%), by Type 2024 & 2032
- Figure 38: North America Amphoteric Surfactant Market Volume Share (%), by Type 2024 & 2032
- Figure 39: North America Amphoteric Surfactant Market Revenue (Billion), by Application 2024 & 2032
- Figure 40: North America Amphoteric Surfactant Market Volume (K Tons), by Application 2024 & 2032
- Figure 41: North America Amphoteric Surfactant Market Revenue Share (%), by Application 2024 & 2032
- Figure 42: North America Amphoteric Surfactant Market Volume Share (%), by Application 2024 & 2032
- Figure 43: North America Amphoteric Surfactant Market Revenue (Billion), by Country 2024 & 2032
- Figure 44: North America Amphoteric Surfactant Market Volume (K Tons), by Country 2024 & 2032
- Figure 45: North America Amphoteric Surfactant Market Revenue Share (%), by Country 2024 & 2032
- Figure 46: North America Amphoteric Surfactant Market Volume Share (%), by Country 2024 & 2032
- Figure 47: Europe Amphoteric Surfactant Market Revenue (Billion), by Type 2024 & 2032
- Figure 48: Europe Amphoteric Surfactant Market Volume (K Tons), by Type 2024 & 2032
- Figure 49: Europe Amphoteric Surfactant Market Revenue Share (%), by Type 2024 & 2032
- Figure 50: Europe Amphoteric Surfactant Market Volume Share (%), by Type 2024 & 2032
- Figure 51: Europe Amphoteric Surfactant Market Revenue (Billion), by Application 2024 & 2032
- Figure 52: Europe Amphoteric Surfactant Market Volume (K Tons), by Application 2024 & 2032
- Figure 53: Europe Amphoteric Surfactant Market Revenue Share (%), by Application 2024 & 2032
- Figure 54: Europe Amphoteric Surfactant Market Volume Share (%), by Application 2024 & 2032
- Figure 55: Europe Amphoteric Surfactant Market Revenue (Billion), by Country 2024 & 2032
- Figure 56: Europe Amphoteric Surfactant Market Volume (K Tons), by Country 2024 & 2032
- Figure 57: Europe Amphoteric Surfactant Market Revenue Share (%), by Country 2024 & 2032
- Figure 58: Europe Amphoteric Surfactant Market Volume Share (%), by Country 2024 & 2032
- Figure 59: South America Amphoteric Surfactant Market Revenue (Billion), by Type 2024 & 2032
- Figure 60: South America Amphoteric Surfactant Market Volume (K Tons), by Type 2024 & 2032
- Figure 61: South America Amphoteric Surfactant Market Revenue Share (%), by Type 2024 & 2032
- Figure 62: South America Amphoteric Surfactant Market Volume Share (%), by Type 2024 & 2032
- Figure 63: South America Amphoteric Surfactant Market Revenue (Billion), by Application 2024 & 2032
- Figure 64: South America Amphoteric Surfactant Market Volume (K Tons), by Application 2024 & 2032
- Figure 65: South America Amphoteric Surfactant Market Revenue Share (%), by Application 2024 & 2032
- Figure 66: South America Amphoteric Surfactant Market Volume Share (%), by Application 2024 & 2032
- Figure 67: South America Amphoteric Surfactant Market Revenue (Billion), by Country 2024 & 2032
- Figure 68: South America Amphoteric Surfactant Market Volume (K Tons), by Country 2024 & 2032
- Figure 69: South America Amphoteric Surfactant Market Revenue Share (%), by Country 2024 & 2032
- Figure 70: South America Amphoteric Surfactant Market Volume Share (%), by Country 2024 & 2032
- Figure 71: Middle East and Africa Amphoteric Surfactant Market Revenue (Billion), by Type 2024 & 2032
- Figure 72: Middle East and Africa Amphoteric Surfactant Market Volume (K Tons), by Type 2024 & 2032
- Figure 73: Middle East and Africa Amphoteric Surfactant Market Revenue Share (%), by Type 2024 & 2032
- Figure 74: Middle East and Africa Amphoteric Surfactant Market Volume Share (%), by Type 2024 & 2032
- Figure 75: Middle East and Africa Amphoteric Surfactant Market Revenue (Billion), by Application 2024 & 2032
- Figure 76: Middle East and Africa Amphoteric Surfactant Market Volume (K Tons), by Application 2024 & 2032
- Figure 77: Middle East and Africa Amphoteric Surfactant Market Revenue Share (%), by Application 2024 & 2032
- Figure 78: Middle East and Africa Amphoteric Surfactant Market Volume Share (%), by Application 2024 & 2032
- Figure 79: Middle East and Africa Amphoteric Surfactant Market Revenue (Billion), by Country 2024 & 2032
- Figure 80: Middle East and Africa Amphoteric Surfactant Market Volume (K Tons), by Country 2024 & 2032
- Figure 81: Middle East and Africa Amphoteric Surfactant Market Revenue Share (%), by Country 2024 & 2032
- Figure 82: Middle East and Africa Amphoteric Surfactant Market Volume Share (%), by Country 2024 & 2032
List of Tables
- Table 1: Global Amphoteric Surfactant Market Revenue Billion Forecast, by Region 2019 & 2032
- Table 2: Global Amphoteric Surfactant Market Volume K Tons Forecast, by Region 2019 & 2032
- Table 3: Global Amphoteric Surfactant Market Revenue Billion Forecast, by Type 2019 & 2032
- Table 4: Global Amphoteric Surfactant Market Volume K Tons Forecast, by Type 2019 & 2032
- Table 5: Global Amphoteric Surfactant Market Revenue Billion Forecast, by Application 2019 & 2032
- Table 6: Global Amphoteric Surfactant Market Volume K Tons Forecast, by Application 2019 & 2032
- Table 7: Global Amphoteric Surfactant Market Revenue Billion Forecast, by Region 2019 & 2032
- Table 8: Global Amphoteric Surfactant Market Volume K Tons Forecast, by Region 2019 & 2032
- Table 9: Global Amphoteric Surfactant Market Revenue Billion Forecast, by Country 2019 & 2032
- Table 10: Global Amphoteric Surfactant Market Volume K Tons Forecast, by Country 2019 & 2032
- Table 11: United States Amphoteric Surfactant Market Revenue (Billion) Forecast, by Application 2019 & 2032
- Table 12: United States Amphoteric Surfactant Market Volume (K Tons) Forecast, by Application 2019 & 2032
- Table 13: Canada Amphoteric Surfactant Market Revenue (Billion) Forecast, by Application 2019 & 2032
- Table 14: Canada Amphoteric Surfactant Market Volume (K Tons) Forecast, by Application 2019 & 2032
- Table 15: Mexico Amphoteric Surfactant Market Revenue (Billion) Forecast, by Application 2019 & 2032
- Table 16: Mexico Amphoteric Surfactant Market Volume (K Tons) Forecast, by Application 2019 & 2032
- Table 17: Global Amphoteric Surfactant Market Revenue Billion Forecast, by Country 2019 & 2032
- Table 18: Global Amphoteric Surfactant Market Volume K Tons Forecast, by Country 2019 & 2032
- Table 19: Germany Amphoteric Surfactant Market Revenue (Billion) Forecast, by Application 2019 & 2032
- Table 20: Germany Amphoteric Surfactant Market Volume (K Tons) Forecast, by Application 2019 & 2032
- Table 21: France Amphoteric Surfactant Market Revenue (Billion) Forecast, by Application 2019 & 2032
- Table 22: France Amphoteric Surfactant Market Volume (K Tons) Forecast, by Application 2019 & 2032
- Table 23: Italy Amphoteric Surfactant Market Revenue (Billion) Forecast, by Application 2019 & 2032
- Table 24: Italy Amphoteric Surfactant Market Volume (K Tons) Forecast, by Application 2019 & 2032
- Table 25: United Kingdom Amphoteric Surfactant Market Revenue (Billion) Forecast, by Application 2019 & 2032
- Table 26: United Kingdom Amphoteric Surfactant Market Volume (K Tons) Forecast, by Application 2019 & 2032
- Table 27: Netherlands Amphoteric Surfactant Market Revenue (Billion) Forecast, by Application 2019 & 2032
- Table 28: Netherlands Amphoteric Surfactant Market Volume (K Tons) Forecast, by Application 2019 & 2032
- Table 29: Rest of Europe Amphoteric Surfactant Market Revenue (Billion) Forecast, by Application 2019 & 2032
- Table 30: Rest of Europe Amphoteric Surfactant Market Volume (K Tons) Forecast, by Application 2019 & 2032
- Table 31: Global Amphoteric Surfactant Market Revenue Billion Forecast, by Country 2019 & 2032
- Table 32: Global Amphoteric Surfactant Market Volume K Tons Forecast, by Country 2019 & 2032
- Table 33: China Amphoteric Surfactant Market Revenue (Billion) Forecast, by Application 2019 & 2032
- Table 34: China Amphoteric Surfactant Market Volume (K Tons) Forecast, by Application 2019 & 2032
- Table 35: Japan Amphoteric Surfactant Market Revenue (Billion) Forecast, by Application 2019 & 2032
- Table 36: Japan Amphoteric Surfactant Market Volume (K Tons) Forecast, by Application 2019 & 2032
- Table 37: India Amphoteric Surfactant Market Revenue (Billion) Forecast, by Application 2019 & 2032
- Table 38: India Amphoteric Surfactant Market Volume (K Tons) Forecast, by Application 2019 & 2032
- Table 39: South Korea Amphoteric Surfactant Market Revenue (Billion) Forecast, by Application 2019 & 2032
- Table 40: South Korea Amphoteric Surfactant Market Volume (K Tons) Forecast, by Application 2019 & 2032
- Table 41: Taiwan Amphoteric Surfactant Market Revenue (Billion) Forecast, by Application 2019 & 2032
- Table 42: Taiwan Amphoteric Surfactant Market Volume (K Tons) Forecast, by Application 2019 & 2032
- Table 43: Australia Amphoteric Surfactant Market Revenue (Billion) Forecast, by Application 2019 & 2032
- Table 44: Australia Amphoteric Surfactant Market Volume (K Tons) Forecast, by Application 2019 & 2032
- Table 45: Rest of Asia-Pacific Amphoteric Surfactant Market Revenue (Billion) Forecast, by Application 2019 & 2032
- Table 46: Rest of Asia-Pacific Amphoteric Surfactant Market Volume (K Tons) Forecast, by Application 2019 & 2032
- Table 47: Global Amphoteric Surfactant Market Revenue Billion Forecast, by Country 2019 & 2032
- Table 48: Global Amphoteric Surfactant Market Volume K Tons Forecast, by Country 2019 & 2032
- Table 49: Brazil Amphoteric Surfactant Market Revenue (Billion) Forecast, by Application 2019 & 2032
- Table 50: Brazil Amphoteric Surfactant Market Volume (K Tons) Forecast, by Application 2019 & 2032
- Table 51: Argentina Amphoteric Surfactant Market Revenue (Billion) Forecast, by Application 2019 & 2032
- Table 52: Argentina Amphoteric Surfactant Market Volume (K Tons) Forecast, by Application 2019 & 2032
- Table 53: Rest of South America Amphoteric Surfactant Market Revenue (Billion) Forecast, by Application 2019 & 2032
- Table 54: Rest of South America Amphoteric Surfactant Market Volume (K Tons) Forecast, by Application 2019 & 2032
- Table 55: Global Amphoteric Surfactant Market Revenue Billion Forecast, by Country 2019 & 2032
- Table 56: Global Amphoteric Surfactant Market Volume K Tons Forecast, by Country 2019 & 2032
- Table 57: Middle East Amphoteric Surfactant Market Revenue (Billion) Forecast, by Application 2019 & 2032
- Table 58: Middle East Amphoteric Surfactant Market Volume (K Tons) Forecast, by Application 2019 & 2032
- Table 59: Africa Amphoteric Surfactant Market Revenue (Billion) Forecast, by Application 2019 & 2032
- Table 60: Africa Amphoteric Surfactant Market Volume (K Tons) Forecast, by Application 2019 & 2032
- Table 61: Global Amphoteric Surfactant Market Revenue Billion Forecast, by Type 2019 & 2032
- Table 62: Global Amphoteric Surfactant Market Volume K Tons Forecast, by Type 2019 & 2032
- Table 63: Global Amphoteric Surfactant Market Revenue Billion Forecast, by Application 2019 & 2032
- Table 64: Global Amphoteric Surfactant Market Volume K Tons Forecast, by Application 2019 & 2032
- Table 65: Global Amphoteric Surfactant Market Revenue Billion Forecast, by Country 2019 & 2032
- Table 66: Global Amphoteric Surfactant Market Volume K Tons Forecast, by Country 2019 & 2032
- Table 67: China Amphoteric Surfactant Market Revenue (Billion) Forecast, by Application 2019 & 2032
- Table 68: China Amphoteric Surfactant Market Volume (K Tons) Forecast, by Application 2019 & 2032
- Table 69: India Amphoteric Surfactant Market Revenue (Billion) Forecast, by Application 2019 & 2032
- Table 70: India Amphoteric Surfactant Market Volume (K Tons) Forecast, by Application 2019 & 2032
- Table 71: Japan Amphoteric Surfactant Market Revenue (Billion) Forecast, by Application 2019 & 2032
- Table 72: Japan Amphoteric Surfactant Market Volume (K Tons) Forecast, by Application 2019 & 2032
- Table 73: South Korea Amphoteric Surfactant Market Revenue (Billion) Forecast, by Application 2019 & 2032
- Table 74: South Korea Amphoteric Surfactant Market Volume (K Tons) Forecast, by Application 2019 & 2032
- Table 75: Rest of Asia Pacific Amphoteric Surfactant Market Revenue (Billion) Forecast, by Application 2019 & 2032
- Table 76: Rest of Asia Pacific Amphoteric Surfactant Market Volume (K Tons) Forecast, by Application 2019 & 2032
- Table 77: Global Amphoteric Surfactant Market Revenue Billion Forecast, by Type 2019 & 2032
- Table 78: Global Amphoteric Surfactant Market Volume K Tons Forecast, by Type 2019 & 2032
- Table 79: Global Amphoteric Surfactant Market Revenue Billion Forecast, by Application 2019 & 2032
- Table 80: Global Amphoteric Surfactant Market Volume K Tons Forecast, by Application 2019 & 2032
- Table 81: Global Amphoteric Surfactant Market Revenue Billion Forecast, by Country 2019 & 2032
- Table 82: Global Amphoteric Surfactant Market Volume K Tons Forecast, by Country 2019 & 2032
- Table 83: United States Amphoteric Surfactant Market Revenue (Billion) Forecast, by Application 2019 & 2032
- Table 84: United States Amphoteric Surfactant Market Volume (K Tons) Forecast, by Application 2019 & 2032
- Table 85: Canada Amphoteric Surfactant Market Revenue (Billion) Forecast, by Application 2019 & 2032
- Table 86: Canada Amphoteric Surfactant Market Volume (K Tons) Forecast, by Application 2019 & 2032
- Table 87: Mexico Amphoteric Surfactant Market Revenue (Billion) Forecast, by Application 2019 & 2032
- Table 88: Mexico Amphoteric Surfactant Market Volume (K Tons) Forecast, by Application 2019 & 2032
- Table 89: Global Amphoteric Surfactant Market Revenue Billion Forecast, by Type 2019 & 2032
- Table 90: Global Amphoteric Surfactant Market Volume K Tons Forecast, by Type 2019 & 2032
- Table 91: Global Amphoteric Surfactant Market Revenue Billion Forecast, by Application 2019 & 2032
- Table 92: Global Amphoteric Surfactant Market Volume K Tons Forecast, by Application 2019 & 2032
- Table 93: Global Amphoteric Surfactant Market Revenue Billion Forecast, by Country 2019 & 2032
- Table 94: Global Amphoteric Surfactant Market Volume K Tons Forecast, by Country 2019 & 2032
- Table 95: Germany Amphoteric Surfactant Market Revenue (Billion) Forecast, by Application 2019 & 2032
- Table 96: Germany Amphoteric Surfactant Market Volume (K Tons) Forecast, by Application 2019 & 2032
- Table 97: United Kingdom Amphoteric Surfactant Market Revenue (Billion) Forecast, by Application 2019 & 2032
- Table 98: United Kingdom Amphoteric Surfactant Market Volume (K Tons) Forecast, by Application 2019 & 2032
- Table 99: Italy Amphoteric Surfactant Market Revenue (Billion) Forecast, by Application 2019 & 2032
- Table 100: Italy Amphoteric Surfactant Market Volume (K Tons) Forecast, by Application 2019 & 2032
- Table 101: France Amphoteric Surfactant Market Revenue (Billion) Forecast, by Application 2019 & 2032
- Table 102: France Amphoteric Surfactant Market Volume (K Tons) Forecast, by Application 2019 & 2032
- Table 103: Rest of Europe Amphoteric Surfactant Market Revenue (Billion) Forecast, by Application 2019 & 2032
- Table 104: Rest of Europe Amphoteric Surfactant Market Volume (K Tons) Forecast, by Application 2019 & 2032
- Table 105: Global Amphoteric Surfactant Market Revenue Billion Forecast, by Type 2019 & 2032
- Table 106: Global Amphoteric Surfactant Market Volume K Tons Forecast, by Type 2019 & 2032
- Table 107: Global Amphoteric Surfactant Market Revenue Billion Forecast, by Application 2019 & 2032
- Table 108: Global Amphoteric Surfactant Market Volume K Tons Forecast, by Application 2019 & 2032
- Table 109: Global Amphoteric Surfactant Market Revenue Billion Forecast, by Country 2019 & 2032
- Table 110: Global Amphoteric Surfactant Market Volume K Tons Forecast, by Country 2019 & 2032
- Table 111: Brazil Amphoteric Surfactant Market Revenue (Billion) Forecast, by Application 2019 & 2032
- Table 112: Brazil Amphoteric Surfactant Market Volume (K Tons) Forecast, by Application 2019 & 2032
- Table 113: Argentina Amphoteric Surfactant Market Revenue (Billion) Forecast, by Application 2019 & 2032
- Table 114: Argentina Amphoteric Surfactant Market Volume (K Tons) Forecast, by Application 2019 & 2032
- Table 115: Rest of South America Amphoteric Surfactant Market Revenue (Billion) Forecast, by Application 2019 & 2032
- Table 116: Rest of South America Amphoteric Surfactant Market Volume (K Tons) Forecast, by Application 2019 & 2032
- Table 117: Global Amphoteric Surfactant Market Revenue Billion Forecast, by Type 2019 & 2032
- Table 118: Global Amphoteric Surfactant Market Volume K Tons Forecast, by Type 2019 & 2032
- Table 119: Global Amphoteric Surfactant Market Revenue Billion Forecast, by Application 2019 & 2032
- Table 120: Global Amphoteric Surfactant Market Volume K Tons Forecast, by Application 2019 & 2032
- Table 121: Global Amphoteric Surfactant Market Revenue Billion Forecast, by Country 2019 & 2032
- Table 122: Global Amphoteric Surfactant Market Volume K Tons Forecast, by Country 2019 & 2032
- Table 123: Saudi Arabia Amphoteric Surfactant Market Revenue (Billion) Forecast, by Application 2019 & 2032
- Table 124: Saudi Arabia Amphoteric Surfactant Market Volume (K Tons) Forecast, by Application 2019 & 2032
- Table 125: South Africa Amphoteric Surfactant Market Revenue (Billion) Forecast, by Application 2019 & 2032
- Table 126: South Africa Amphoteric Surfactant Market Volume (K Tons) Forecast, by Application 2019 & 2032
- Table 127: Rest of Middle East and Africa Amphoteric Surfactant Market Revenue (Billion) Forecast, by Application 2019 & 2032
- Table 128: Rest of Middle East and Africa Amphoteric Surfactant Market Volume (K Tons) Forecast, by Application 2019 & 2032
Frequently Asked Questions
1. What is the projected Compound Annual Growth Rate (CAGR) of the Amphoteric Surfactant Market?
The projected CAGR is approximately 6.6%.
2. Which companies are prominent players in the Amphoteric Surfactant Market?
Key companies in the market include Clariant, STOCKMEIER Group, Croda International PLc, Pilot Chemical Corp, KLK OLEO, Evonik Industries AG, BASF SE, Alfa Chemistry, The Lubrizol Corporation, NOF CORPORATION, Chempri BV, Kao Corporation.
3. What are the main segments of the Amphoteric Surfactant Market?
The market segments include Type, Application.
4. Can you provide details about the market size?
The market size is estimated to be USD 4.9 Billion as of 2022.
5. What are some drivers contributing to market growth?
Growing Demand from the Personal Care Industry; Other Drivers.
6. What are the notable trends driving market growth?
Growing Demand from the Personal Care and Cosmetics Industry.
7. Are there any restraints impacting market growth?
Health Concerns and Stringent Environmental Regulations; Impact of COVID-19 on the Market Studied.
8. Can you provide examples of recent developments in the market?
N/A
9. What pricing options are available for accessing the report?
Pricing options include single-user, multi-user, and enterprise licenses priced at USD 4750, USD 5250, and USD 8750 respectively.
10. Is the market size provided in terms of value or volume?
The market size is provided in terms of value, measured in Billion and volume, measured in K Tons.
11. Are there any specific market keywords associated with the report?
Yes, the market keyword associated with the report is "Amphoteric Surfactant Market," which aids in identifying and referencing the specific market segment covered.
12. How do I determine which pricing option suits my needs best?
The pricing options vary based on user requirements and access needs. Individual users may opt for single-user licenses, while businesses requiring broader access may choose multi-user or enterprise licenses for cost-effective access to the report.
13. Are there any additional resources or data provided in the Amphoteric Surfactant Market report?
While the report offers comprehensive insights, it's advisable to review the specific contents or supplementary materials provided to ascertain if additional resources or data are available.
14. How can I stay updated on further developments or reports in the Amphoteric Surfactant Market?
To stay informed about further developments, trends, and reports in the Amphoteric Surfactant Market, consider subscribing to industry newsletters, following relevant companies and organizations, or regularly checking reputable industry news sources and publications.
Methodology
Step 1 - Identification of Relevant Samples Size from Population Database


Step 2 - Approaches for Defining Global Market Size (Value, Volume* & Price*)

Note*: In applicable scenarios
Step 3 - Data Sources
Primary Research
- Web Analytics
- Survey Reports
- Research Institute
- Latest Research Reports
- Opinion Leaders
Secondary Research
- Annual Reports
- White Paper
- Latest Press Release
- Industry Association
- Paid Database
- Investor Presentations

Step 4 - Data Triangulation
Involves using different sources of information in order to increase the validity of a study
These sources are likely to be stakeholders in a program - participants, other researchers, program staff, other community members, and so on.
Then we put all data in single framework & apply various statistical tools to find out the dynamic on the market.
During the analysis stage, feedback from the stakeholder groups would be compared to determine areas of agreement as well as areas of divergence


