

Key Insights
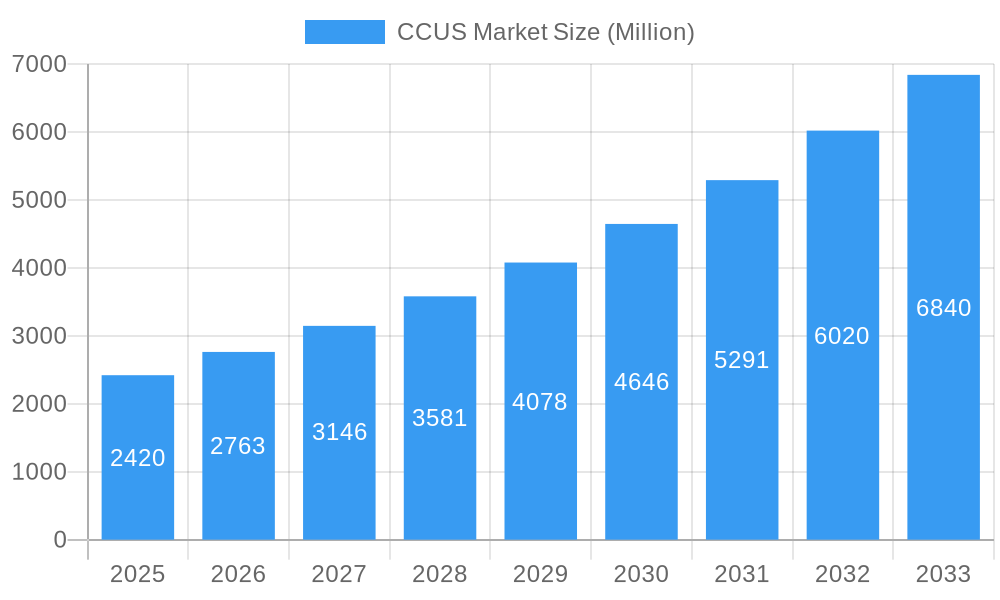
The Carbon Capture, Utilization, and Storage (CCUS) market is poised for significant expansion, projected to reach USD 2.42 billion and exhibit a robust Compound Annual Growth Rate (CAGR) of 14.21% between 2025 and 2033. This accelerated growth is primarily driven by a confluence of factors, including stringent global climate change regulations, increasing corporate sustainability commitments, and the imperative to decarbonize heavy industries. The demand for CCUS solutions is escalating as nations and corporations actively seek to reduce their carbon footprint and achieve net-zero emissions targets. Technological advancements in pre-combustion, oxy-fuel combustion, and post-combustion capture methods are enhancing efficiency and reducing costs, making CCUS a more viable and attractive proposition. Furthermore, the growing recognition of the potential for carbon utilization in creating valuable products is fostering innovation and market opportunities. The oil and gas sector, coal and biomass power plants, iron and steel manufacturing, chemical production, and cement industries are key end-users that are increasingly adopting CCUS technologies to comply with environmental mandates and improve their operational sustainability.
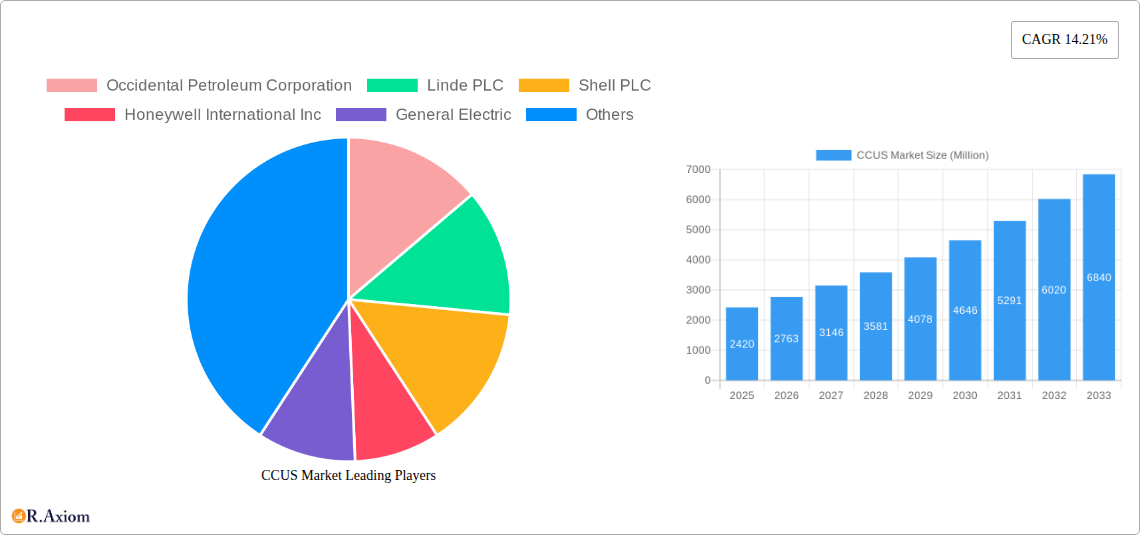
CCUS Market Market Size (In Billion)
The market dynamics are further shaped by evolving trends such as the integration of CCUS with renewable energy sources, the development of large-scale CCUS hubs, and advancements in carbon transport and storage infrastructure. However, the market also faces certain restraints, including high initial capital investment costs for CCUS facilities, challenges related to long-term CO2 storage site selection and monitoring, and the need for supportive policy frameworks and incentives to drive widespread adoption. Despite these challenges, the overarching global push towards a low-carbon economy, coupled with substantial investments from both public and private sectors, is expected to propel the CCUS market forward. Key players like Occidental Petroleum Corporation, Linde PLC, Shell PLC, Honeywell International Inc., and General Electric are at the forefront of innovation and deployment, driving the market's trajectory. Regional leadership is anticipated in North America and Europe, driven by established regulatory frameworks and significant industrial decarbonization efforts, with Asia Pacific emerging as a high-growth region due to rapid industrialization and increasing environmental awareness.
CCUS Market Company Market Share
This detailed report offers an in-depth analysis of the global Carbon Capture, Utilization, and Storage (CCUS) market, covering the historical period of 2019-2024, the base and estimated year of 2025, and a forecast period extending to 2033. With a projected market size of xx Million in 2025, the CCUS industry is poised for significant growth, driven by escalating climate change concerns, stringent environmental regulations, and advancements in capture technologies. This report meticulously examines market concentration, innovation drivers, regulatory frameworks, dominant segments, product developments, key growth drivers, challenges, emerging opportunities, leading players, and strategic outlooks, providing actionable insights for industry stakeholders seeking to navigate this dynamic landscape.
CCUS Market Market Concentration & Innovation
The CCUS market, while experiencing rapid expansion, exhibits a moderate level of concentration. Key players like Occidental Petroleum Corporation, Linde PLC, and Shell PLC are at the forefront, driving innovation through significant research and development investments. The market's evolution is intrinsically linked to the development and deployment of advanced CCUS technologies, with a growing emphasis on cost-effectiveness and scalability. Regulatory frameworks, such as government incentives, carbon pricing mechanisms, and emissions reduction targets, play a pivotal role in shaping market dynamics and encouraging further investment in CCUS solutions. Product substitutes, while limited in direct replacement of the entire CCUS value chain, include alternative decarbonization strategies. However, the unique ability of CCUS to address hard-to-abate emissions in sectors like heavy industry solidifies its position. End-user trends are increasingly favoring integrated solutions that combine capture with utilization or geological storage, thereby enhancing economic viability. Mergers and acquisitions (M&A) activity is expected to increase as larger corporations seek to acquire innovative technologies and expand their market reach. Recent M&A deals are valued in the hundreds of millions of dollars, reflecting the strategic importance of CCUS. For instance, the integration of capture technologies with enhanced oil recovery (EOR) projects represents a key strategic initiative.
CCUS Market Industry Trends & Insights
The CCUS market is experiencing robust growth, projected to expand at a Compound Annual Growth Rate (CAGR) of xx% from 2025 to 2033, reaching an estimated market size of xx Million by 2033. This surge is propelled by a confluence of factors, including the global imperative to mitigate greenhouse gas emissions and achieve net-zero targets. Technological advancements are a primary catalyst, with continuous innovation in capture efficiencies, cost reduction, and the development of novel utilization pathways for captured CO2. Post-combustion capture technologies are witnessing significant traction due to their applicability to existing infrastructure, particularly in power generation and industrial facilities. The increasing adoption of CCUS in the oil and gas sector, driven by the need to decarbonize operations and the potential for enhanced oil recovery (EOR), is a major growth driver. Furthermore, governmental policies and incentives, such as tax credits and carbon pricing mechanisms, are instrumental in de-risking investments and accelerating project development. Consumer preferences, manifested through corporate sustainability commitments and investor pressure, are also pushing industries to embrace CCUS solutions. The competitive landscape is characterized by a mix of established industrial gas companies, major oil and gas corporations, engineering firms, and emerging technology providers, all vying for market share and technological leadership. The market penetration of CCUS is still in its nascent stages but is expected to accelerate significantly in the coming decade.
Dominant Markets & Segments in CCUS Market
The CCUS market is witnessing dominance across several key segments, driven by distinct economic and policy landscapes.
- Dominant Technology Segment: Post-combustion capture is currently the most dominant technology segment, accounting for an estimated xx% of the CCUS market share in 2025. This is primarily due to its widespread applicability to existing industrial facilities and power plants. The availability of established chemical absorption and adsorption methods, coupled with ongoing research to improve efficiency and reduce energy penalties, underpins its widespread adoption. Economic policies supporting the retrofitting of existing infrastructure with capture capabilities further bolster this segment's dominance.
- Dominant End-User Industry: The Oil and Gas industry represents the largest end-user industry for CCUS, projected to account for xx% of the market by 2025. This dominance stems from the industry's inherent need to decarbonize operations, meet regulatory requirements, and leverage CCUS for enhanced oil recovery (EOR), which offers a dual benefit of emissions reduction and increased hydrocarbon production. Significant investments from major oil and gas corporations underscore this trend.
- Regional Dominance: North America is anticipated to be the leading region in the CCUS market, driven by supportive government policies, substantial investments in carbon capture projects, and the presence of major industry players. The United States, with its tax incentives like the 45Q tax credit, is a significant driver of this regional dominance. Infrastructure development, including CO2 pipelines for transportation and storage facilities, is crucial in enabling this market leadership.
- Country-Level Dominance: Within North America, the United States is expected to lead due to its comprehensive federal and state-level initiatives promoting CCUS deployment. The country's extensive fossil fuel reserves and established industrial base provide a strong foundation for CCUS adoption.
- Emerging Segment Strength: While Cement and Chemical industries are currently smaller segments, they represent significant growth potential due to their inherently high CO2 emissions and the increasing pressure for decarbonization. Investments in pilot projects and the development of specific capture solutions for these sectors are indicative of their future importance.
CCUS Market Product Developments
Product developments in the CCUS market are primarily focused on enhancing the efficiency and reducing the cost of carbon capture technologies, alongside expanding the utilization potential of captured CO2. Innovations in solvent chemistry, membrane technologies, and direct air capture (DAC) are leading to more energy-efficient and scalable capture processes. The development of modular and standardized capture units is also a key trend, facilitating quicker deployment and reducing project lead times. Furthermore, advancements in CO2 utilization, such as its use in the production of building materials, synthetic fuels, and chemicals, are creating new market opportunities and improving the economic viability of CCUS projects. These developments offer competitive advantages by lowering operational expenditures and increasing the overall return on investment for CCUS infrastructure.
Report Scope & Segmentation Analysis
This report segmentations encompasses a comprehensive analysis of the CCUS market across key technological and end-user industry verticals.
- Technology Segments:
- Pre-combustion Capture: Analyzes technologies that convert fuel into a mixture of hydrogen and carbon dioxide before combustion, with projected market share of xx% in 2025.
- Oxy-fuel Combustion Capture: Examines methods involving combustion in nearly pure oxygen, leading to a more concentrated CO2 stream, with a projected market share of xx% in 2025.
- Post-combustion Capture: Focuses on the capture of CO2 from flue gases after fuel combustion, representing the largest segment with an estimated xx% market share in 2025 and significant growth projections.
- End-user Industry Segments:
- Oil and Gas: Dominant segment with a projected xx% market share in 2025, driven by EOR and operational decarbonization.
- Coal and Biomass Power Plant: Significant segment facing transitional pressures, with a projected xx% market share in 2025.
- Iron and Steel: High-emission industry with substantial CCUS potential, projected market share of xx% in 2025.
- Chemical: Growing segment driven by process emissions, with a projected xx% market share in 2025.
- Cement: Significant emitter with increasing CCUS focus, projected market share of xx% in 2025.
Key Drivers of CCUS Market Growth
The CCUS market's growth is propelled by several interconnected factors. Stringent government regulations and ambitious climate change targets are creating a strong imperative for emissions reduction, making CCUS a critical decarbonization tool. Technological advancements in capture, utilization, and storage are continuously improving efficiency and reducing costs, thereby enhancing economic viability. Growing awareness of the climate crisis among corporations and investors is leading to increased demand for sustainable solutions and significant capital allocation towards CCUS projects. The potential for enhanced oil recovery (EOR) provides an additional economic incentive for the oil and gas sector to adopt CCUS. Furthermore, government incentives, such as tax credits and subsidies, are crucial in de-risking investments and accelerating project development, making CCUS a more attractive proposition.
Challenges in the CCUS Market Sector
Despite its promising growth trajectory, the CCUS market faces several significant challenges. High upfront capital costs for implementing capture facilities, CO2 transportation infrastructure, and geological storage sites remain a major barrier to widespread adoption. The energy penalty associated with the capture process can also impact operational efficiency and costs. Regulatory uncertainties and the lack of standardized policy frameworks in some regions can hinder investment and project development. The long-term liability and safety concerns associated with CO2 storage require robust monitoring and verification protocols, adding complexity and cost. Furthermore, securing sufficient CO2 storage capacity and ensuring the availability of suitable geological formations pose logistical challenges. Competition from other decarbonization technologies and the slower-than-anticipated development of robust CO2 utilization markets also present hurdles.
Emerging Opportunities in CCUS Market
Emerging opportunities in the CCUS market are multifaceted. The increasing focus on industrial decarbonization in hard-to-abate sectors like cement, steel, and chemicals presents a significant growth avenue, with the development of tailored CCUS solutions for these industries. Advancements in Direct Air Capture (DAC) technology are opening new markets for atmospheric CO2 removal, addressing diffuse emission sources. The growing hydrogen economy, particularly blue hydrogen production (hydrogen from natural gas with CCUS), is expected to drive demand for CO2 capture. Moreover, the development of innovative CO2 utilization pathways, such as the production of sustainable aviation fuels, chemicals, and advanced materials, is creating new revenue streams and improving the economic attractiveness of CCUS projects. International collaborations and cross-border CO2 transport initiatives are also emerging as key opportunities for scaling up CCUS deployment.
Leading Players in the CCUS Market Market
- Occidental Petroleum Corporation
- Linde PLC
- Shell PLC
- Honeywell International Inc
- General Electric
- Exxon Mobil Corporation
- Japan CCS Co Ltd
- SLB
- Fluor Corporation
- Baker Hughes Company
- Halliburton
- Aker Solutions
- Dakota Gasification Company
- JX Nippon Oil & Gas Exploration Corporation
- Siemens Energy
- Air Liquide
- Mitsubishi Heavy Industries Ltd
Key Developments in CCUS Market Industry
- March 2024: JX Nippon Oil & Gas Exploration Corporation and Chevron New Energies, a division of Chevron U.S.A. Inc., entered into a memorandum of understanding aimed at assessing the potential export of carbon dioxide from Japan to carbon capture and storage (CCS) initiatives situated in Australia and other nations across Asia-Pacific. This agreement enhances the company's market footprint and signals a growing trend in international CO2 transport and storage.
- March 2024: Shell and ONGC collaborated on a storage study and enhanced oil recovery (EOR) screening assessment in India, including depleted oil and gas fields and saline aquifers. This collaboration aims to develop carbon capture, utilization, and storage, or CCUS/carbon capture and storage (CCS), as an emissions mitigation tool for combating climate change and injecting carbon dioxide for geological storage and enhanced oil production from mature fields of ONGC. This highlights the dual benefits of CCUS in emissions reduction and resource management.
- February 2024: Fluor Corporation and Chevron New Energies signed a license agreement with Fluor to use its proprietary Econamine FG PlusSM carbon capture technology to reduce carbon dioxide emissions at Chevron’s Eastridge Cogeneration facility in Kern County, California. This development underscores the increasing adoption of advanced capture technologies by major energy companies to address operational emissions.
Strategic Outlook for CCUS Market Market
The strategic outlook for the CCUS market is overwhelmingly positive, characterized by accelerating adoption and significant investment. The confluence of tightening climate regulations, advancing technological maturity, and growing corporate sustainability commitments will act as powerful growth catalysts. Increased governmental support through favorable policies and financial incentives will be instrumental in de-risking large-scale projects and driving down costs. The expansion of CO2 transportation and storage infrastructure, coupled with the development of viable CO2 utilization pathways, will further bolster market growth. Strategic partnerships and collaborations between technology providers, industrial emitters, and energy companies will be crucial for project deployment. The focus will increasingly shift towards developing integrated CCUS solutions that offer both decarbonization benefits and economic value, positioning CCUS as a cornerstone of global net-zero strategies. The market is poised for substantial expansion, with a significant increase in both the number and scale of CCUS projects globally.
CCUS Market Segmentation
-
1. Technology
- 1.1. Pre-combustion Capture
- 1.2. Oxy-fuel Combustion Capture
- 1.3. Post-combustion Capture
-
2. End-user Industry
- 2.1. Oil and Gas
- 2.2. Coal and Biomass Power Plant
- 2.3. Iron and Steel
- 2.4. Chemical
- 2.5. Cement
CCUS Market Segmentation By Geography
-
1. Asia Pacific
- 1.1. China
- 1.2. India
- 1.3. Japan
- 1.4. Australia
- 1.5. Rest of Asia Pacific
-
2. North America
- 2.1. United States
- 2.2. Canada
- 2.3. Mexico
-
3. Europe
- 3.1. Germany
- 3.2. United Kingdom
- 3.3. France
- 3.4. Norway
- 3.5. Netherlands
- 3.6. Rest of Europe
- 4. Rest of the World
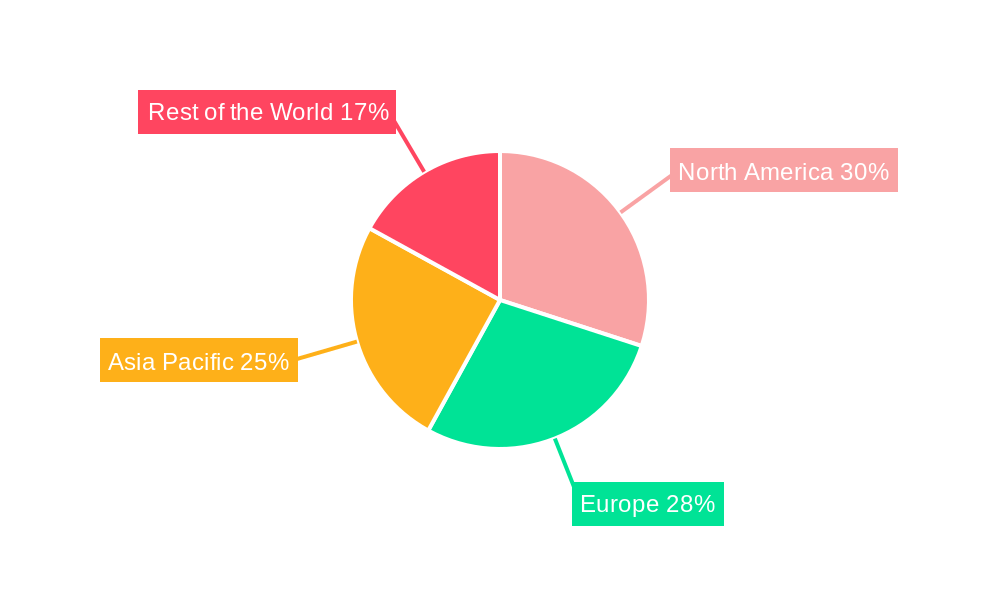
CCUS Market Regional Market Share
Geographic Coverage of CCUS Market
CCUS Market REPORT HIGHLIGHTS
| Aspects | Details |
|---|---|
| Study Period | 2020-2034 |
| Base Year | 2025 |
| Estimated Year | 2026 |
| Forecast Period | 2026-2034 |
| Historical Period | 2020-2025 |
| Growth Rate | CAGR of 14.21% from 2020-2034 |
| Segmentation |
|
Table of Contents
- 1. Introduction
- 1.1. Research Scope
- 1.2. Market Segmentation
- 1.3. Research Objective
- 1.4. Definitions and Assumptions
- 2. Executive Summary
- 2.1. Market Snapshot
- 3. Market Dynamics
- 3.1. Market Drivers
- 3.2. Market Restrains
- 3.3. Market Trends
- 3.4. Market Opportunities
- 4. Market Factor Analysis
- 4.1. Porters Five Forces
- 4.1.1. Bargaining Power of Suppliers
- 4.1.2. Bargaining Power of Buyers
- 4.1.3. Threat of New Entrants
- 4.1.4. Threat of Substitutes
- 4.1.5. Competitive Rivalry
- 4.2. PESTEL analysis
- 4.3. BCG Analysis
- 4.3.1. Stars (High Growth, High Market Share)
- 4.3.2. Cash Cows (Low Growth, High Market Share)
- 4.3.3. Question Mark (High Growth, Low Market Share)
- 4.3.4. Dogs (Low Growth, Low Market Share)
- 4.4. Ansoff Matrix Analysis
- 4.5. Supply Chain Analysis
- 4.6. Regulatory Landscape
- 4.7. Current Market Potential and Opportunity Assessment (TAM–SAM–SOM Framework)
- 4.8. RAX Analyst Note
- 4.1. Porters Five Forces
- 5. Market Analysis, Insights and Forecast 2021-2033
- 5.1. Market Analysis, Insights and Forecast - by Technology
- 5.1.1. Pre-combustion Capture
- 5.1.2. Oxy-fuel Combustion Capture
- 5.1.3. Post-combustion Capture
- 5.2. Market Analysis, Insights and Forecast - by End-user Industry
- 5.2.1. Oil and Gas
- 5.2.2. Coal and Biomass Power Plant
- 5.2.3. Iron and Steel
- 5.2.4. Chemical
- 5.2.5. Cement
- 5.3. Market Analysis, Insights and Forecast - by Region
- 5.3.1. Asia Pacific
- 5.3.2. North America
- 5.3.3. Europe
- 5.3.4. Rest of the World
- 5.1. Market Analysis, Insights and Forecast - by Technology
- 6. CCUS Market Analysis, Insights and Forecast, 2021-2033
- 6.1. Market Analysis, Insights and Forecast - by Technology
- 6.1.1. Pre-combustion Capture
- 6.1.2. Oxy-fuel Combustion Capture
- 6.1.3. Post-combustion Capture
- 6.2. Market Analysis, Insights and Forecast - by End-user Industry
- 6.2.1. Oil and Gas
- 6.2.2. Coal and Biomass Power Plant
- 6.2.3. Iron and Steel
- 6.2.4. Chemical
- 6.2.5. Cement
- 6.1. Market Analysis, Insights and Forecast - by Technology
- 7. Asia Pacific CCUS Market Analysis, Insights and Forecast, 2020-2032
- 7.1. Market Analysis, Insights and Forecast - by Technology
- 7.1.1. Pre-combustion Capture
- 7.1.2. Oxy-fuel Combustion Capture
- 7.1.3. Post-combustion Capture
- 7.2. Market Analysis, Insights and Forecast - by End-user Industry
- 7.2.1. Oil and Gas
- 7.2.2. Coal and Biomass Power Plant
- 7.2.3. Iron and Steel
- 7.2.4. Chemical
- 7.2.5. Cement
- 7.1. Market Analysis, Insights and Forecast - by Technology
- 8. North America CCUS Market Analysis, Insights and Forecast, 2020-2032
- 8.1. Market Analysis, Insights and Forecast - by Technology
- 8.1.1. Pre-combustion Capture
- 8.1.2. Oxy-fuel Combustion Capture
- 8.1.3. Post-combustion Capture
- 8.2. Market Analysis, Insights and Forecast - by End-user Industry
- 8.2.1. Oil and Gas
- 8.2.2. Coal and Biomass Power Plant
- 8.2.3. Iron and Steel
- 8.2.4. Chemical
- 8.2.5. Cement
- 8.1. Market Analysis, Insights and Forecast - by Technology
- 9. Europe CCUS Market Analysis, Insights and Forecast, 2020-2032
- 9.1. Market Analysis, Insights and Forecast - by Technology
- 9.1.1. Pre-combustion Capture
- 9.1.2. Oxy-fuel Combustion Capture
- 9.1.3. Post-combustion Capture
- 9.2. Market Analysis, Insights and Forecast - by End-user Industry
- 9.2.1. Oil and Gas
- 9.2.2. Coal and Biomass Power Plant
- 9.2.3. Iron and Steel
- 9.2.4. Chemical
- 9.2.5. Cement
- 9.1. Market Analysis, Insights and Forecast - by Technology
- 10. Rest of the World CCUS Market Analysis, Insights and Forecast, 2020-2032
- 10.1. Market Analysis, Insights and Forecast - by Technology
- 10.1.1. Pre-combustion Capture
- 10.1.2. Oxy-fuel Combustion Capture
- 10.1.3. Post-combustion Capture
- 10.2. Market Analysis, Insights and Forecast - by End-user Industry
- 10.2.1. Oil and Gas
- 10.2.2. Coal and Biomass Power Plant
- 10.2.3. Iron and Steel
- 10.2.4. Chemical
- 10.2.5. Cement
- 10.1. Market Analysis, Insights and Forecast - by Technology
- 11. Competitive Analysis
- 11.1. Company Profiles
- 11.1.1 Occidental Petroleum Corporation
- 11.1.1.1. Company Overview
- 11.1.1.2. Products
- 11.1.1.3. Company Financials
- 11.1.1.4. SWOT Analysis
- 11.1.2 Linde PLC
- 11.1.2.1. Company Overview
- 11.1.2.2. Products
- 11.1.2.3. Company Financials
- 11.1.2.4. SWOT Analysis
- 11.1.3 Shell PLC
- 11.1.3.1. Company Overview
- 11.1.3.2. Products
- 11.1.3.3. Company Financials
- 11.1.3.4. SWOT Analysis
- 11.1.4 Honeywell International Inc
- 11.1.4.1. Company Overview
- 11.1.4.2. Products
- 11.1.4.3. Company Financials
- 11.1.4.4. SWOT Analysis
- 11.1.5 General Electric
- 11.1.5.1. Company Overview
- 11.1.5.2. Products
- 11.1.5.3. Company Financials
- 11.1.5.4. SWOT Analysis
- 11.1.6 Exxon Mobil Corporation
- 11.1.6.1. Company Overview
- 11.1.6.2. Products
- 11.1.6.3. Company Financials
- 11.1.6.4. SWOT Analysis
- 11.1.7 Japan CCS Co Ltd
- 11.1.7.1. Company Overview
- 11.1.7.2. Products
- 11.1.7.3. Company Financials
- 11.1.7.4. SWOT Analysis
- 11.1.8 SLB*List Not Exhaustive
- 11.1.8.1. Company Overview
- 11.1.8.2. Products
- 11.1.8.3. Company Financials
- 11.1.8.4. SWOT Analysis
- 11.1.9 Fluor Corporation
- 11.1.9.1. Company Overview
- 11.1.9.2. Products
- 11.1.9.3. Company Financials
- 11.1.9.4. SWOT Analysis
- 11.1.10 Baker Hughes Company
- 11.1.10.1. Company Overview
- 11.1.10.2. Products
- 11.1.10.3. Company Financials
- 11.1.10.4. SWOT Analysis
- 11.1.11 Halliburton
- 11.1.11.1. Company Overview
- 11.1.11.2. Products
- 11.1.11.3. Company Financials
- 11.1.11.4. SWOT Analysis
- 11.1.12 Aker Solutions
- 11.1.12.1. Company Overview
- 11.1.12.2. Products
- 11.1.12.3. Company Financials
- 11.1.12.4. SWOT Analysis
- 11.1.13 Dakota Gasification Company
- 11.1.13.1. Company Overview
- 11.1.13.2. Products
- 11.1.13.3. Company Financials
- 11.1.13.4. SWOT Analysis
- 11.1.14 JX Nippon Oil & Gas Exploration Corporation
- 11.1.14.1. Company Overview
- 11.1.14.2. Products
- 11.1.14.3. Company Financials
- 11.1.14.4. SWOT Analysis
- 11.1.15 Siemens Energy
- 11.1.15.1. Company Overview
- 11.1.15.2. Products
- 11.1.15.3. Company Financials
- 11.1.15.4. SWOT Analysis
- 11.1.16 Air Liquide
- 11.1.16.1. Company Overview
- 11.1.16.2. Products
- 11.1.16.3. Company Financials
- 11.1.16.4. SWOT Analysis
- 11.1.17 Mitsubishi Heavy Industries Ltd
- 11.1.17.1. Company Overview
- 11.1.17.2. Products
- 11.1.17.3. Company Financials
- 11.1.17.4. SWOT Analysis
- 11.1.1 Occidental Petroleum Corporation
- 11.2. Market Entropy
- 11.2.1 Company's Key Areas Served
- 11.2.2 Recent Developments
- 11.3. Company Market Share Analysis 2025
- 11.3.1 Top 5 Companies Market Share Analysis
- 11.3.2 Top 3 Companies Market Share Analysis
- 11.4. List of Potential Customers
- 12. Research Methodology
List of Figures
- Figure 1: CCUS Market Revenue Breakdown (Million, %) by Product 2025 & 2033
- Figure 2: CCUS Market Share (%) by Company 2025
List of Tables
- Table 1: CCUS Market Revenue Million Forecast, by Technology 2020 & 2033
- Table 2: CCUS Market Volume K Tons Forecast, by Technology 2020 & 2033
- Table 3: CCUS Market Revenue Million Forecast, by End-user Industry 2020 & 2033
- Table 4: CCUS Market Volume K Tons Forecast, by End-user Industry 2020 & 2033
- Table 5: CCUS Market Revenue Million Forecast, by Region 2020 & 2033
- Table 6: CCUS Market Volume K Tons Forecast, by Region 2020 & 2033
- Table 7: CCUS Market Revenue Million Forecast, by Technology 2020 & 2033
- Table 8: CCUS Market Volume K Tons Forecast, by Technology 2020 & 2033
- Table 9: CCUS Market Revenue Million Forecast, by End-user Industry 2020 & 2033
- Table 10: CCUS Market Volume K Tons Forecast, by End-user Industry 2020 & 2033
- Table 11: CCUS Market Revenue Million Forecast, by Country 2020 & 2033
- Table 12: CCUS Market Volume K Tons Forecast, by Country 2020 & 2033
- Table 13: China CCUS Market Revenue (Million) Forecast, by Application 2020 & 2033
- Table 14: China CCUS Market Volume (K Tons) Forecast, by Application 2020 & 2033
- Table 15: India CCUS Market Revenue (Million) Forecast, by Application 2020 & 2033
- Table 16: India CCUS Market Volume (K Tons) Forecast, by Application 2020 & 2033
- Table 17: Japan CCUS Market Revenue (Million) Forecast, by Application 2020 & 2033
- Table 18: Japan CCUS Market Volume (K Tons) Forecast, by Application 2020 & 2033
- Table 19: Australia CCUS Market Revenue (Million) Forecast, by Application 2020 & 2033
- Table 20: Australia CCUS Market Volume (K Tons) Forecast, by Application 2020 & 2033
- Table 21: Rest of Asia Pacific CCUS Market Revenue (Million) Forecast, by Application 2020 & 2033
- Table 22: Rest of Asia Pacific CCUS Market Volume (K Tons) Forecast, by Application 2020 & 2033
- Table 23: CCUS Market Revenue Million Forecast, by Technology 2020 & 2033
- Table 24: CCUS Market Volume K Tons Forecast, by Technology 2020 & 2033
- Table 25: CCUS Market Revenue Million Forecast, by End-user Industry 2020 & 2033
- Table 26: CCUS Market Volume K Tons Forecast, by End-user Industry 2020 & 2033
- Table 27: CCUS Market Revenue Million Forecast, by Country 2020 & 2033
- Table 28: CCUS Market Volume K Tons Forecast, by Country 2020 & 2033
- Table 29: United States CCUS Market Revenue (Million) Forecast, by Application 2020 & 2033
- Table 30: United States CCUS Market Volume (K Tons) Forecast, by Application 2020 & 2033
- Table 31: Canada CCUS Market Revenue (Million) Forecast, by Application 2020 & 2033
- Table 32: Canada CCUS Market Volume (K Tons) Forecast, by Application 2020 & 2033
- Table 33: Mexico CCUS Market Revenue (Million) Forecast, by Application 2020 & 2033
- Table 34: Mexico CCUS Market Volume (K Tons) Forecast, by Application 2020 & 2033
- Table 35: CCUS Market Revenue Million Forecast, by Technology 2020 & 2033
- Table 36: CCUS Market Volume K Tons Forecast, by Technology 2020 & 2033
- Table 37: CCUS Market Revenue Million Forecast, by End-user Industry 2020 & 2033
- Table 38: CCUS Market Volume K Tons Forecast, by End-user Industry 2020 & 2033
- Table 39: CCUS Market Revenue Million Forecast, by Country 2020 & 2033
- Table 40: CCUS Market Volume K Tons Forecast, by Country 2020 & 2033
- Table 41: Germany CCUS Market Revenue (Million) Forecast, by Application 2020 & 2033
- Table 42: Germany CCUS Market Volume (K Tons) Forecast, by Application 2020 & 2033
- Table 43: United Kingdom CCUS Market Revenue (Million) Forecast, by Application 2020 & 2033
- Table 44: United Kingdom CCUS Market Volume (K Tons) Forecast, by Application 2020 & 2033
- Table 45: France CCUS Market Revenue (Million) Forecast, by Application 2020 & 2033
- Table 46: France CCUS Market Volume (K Tons) Forecast, by Application 2020 & 2033
- Table 47: Norway CCUS Market Revenue (Million) Forecast, by Application 2020 & 2033
- Table 48: Norway CCUS Market Volume (K Tons) Forecast, by Application 2020 & 2033
- Table 49: Netherlands CCUS Market Revenue (Million) Forecast, by Application 2020 & 2033
- Table 50: Netherlands CCUS Market Volume (K Tons) Forecast, by Application 2020 & 2033
- Table 51: Rest of Europe CCUS Market Revenue (Million) Forecast, by Application 2020 & 2033
- Table 52: Rest of Europe CCUS Market Volume (K Tons) Forecast, by Application 2020 & 2033
- Table 53: CCUS Market Revenue Million Forecast, by Technology 2020 & 2033
- Table 54: CCUS Market Volume K Tons Forecast, by Technology 2020 & 2033
- Table 55: CCUS Market Revenue Million Forecast, by End-user Industry 2020 & 2033
- Table 56: CCUS Market Volume K Tons Forecast, by End-user Industry 2020 & 2033
- Table 57: CCUS Market Revenue Million Forecast, by Country 2020 & 2033
- Table 58: CCUS Market Volume K Tons Forecast, by Country 2020 & 2033
Frequently Asked Questions
1. What is the projected Compound Annual Growth Rate (CAGR) of the CCUS Market?
The projected CAGR is approximately 14.21%.
2. Which companies are prominent players in the CCUS Market?
Key companies in the market include Occidental Petroleum Corporation, Linde PLC, Shell PLC, Honeywell International Inc, General Electric, Exxon Mobil Corporation, Japan CCS Co Ltd, SLB*List Not Exhaustive, Fluor Corporation, Baker Hughes Company, Halliburton, Aker Solutions, Dakota Gasification Company, JX Nippon Oil & Gas Exploration Corporation, Siemens Energy, Air Liquide, Mitsubishi Heavy Industries Ltd.
3. What are the main segments of the CCUS Market?
The market segments include Technology, End-user Industry.
4. Can you provide details about the market size?
The market size is estimated to be USD 2.42 Million as of 2022.
5. What are some drivers contributing to market growth?
Emerging Demand for CO2 Injection Technique for Enhanced Oil Recovery (EOR); Strict Government Norms Toward GHG Emissions.
6. What are the notable trends driving market growth?
Oil and Gas Segment to Dominate the Market.
7. Are there any restraints impacting market growth?
Huge CCS Technology Implementation Costs; Growth in Shale Investments.
8. Can you provide examples of recent developments in the market?
March 2024: JX Nippon Oil & Gas Exploration Corporation and Chevron New Energies, a division of Chevron U.S.A. Inc., entered into a memorandum of understanding aimed at assessing the potential export of carbon dioxide from Japan to carbon capture and storage (CCS) initiatives situated in Australia and other nations across Asia-Pacific. This agreement enhances the company's market footprint.
9. What pricing options are available for accessing the report?
Pricing options include single-user, multi-user, and enterprise licenses priced at USD 4750, USD 5250, and USD 8750 respectively.
10. Is the market size provided in terms of value or volume?
The market size is provided in terms of value, measured in Million and volume, measured in K Tons.
11. Are there any specific market keywords associated with the report?
Yes, the market keyword associated with the report is "CCUS Market," which aids in identifying and referencing the specific market segment covered.
12. How do I determine which pricing option suits my needs best?
The pricing options vary based on user requirements and access needs. Individual users may opt for single-user licenses, while businesses requiring broader access may choose multi-user or enterprise licenses for cost-effective access to the report.
13. Are there any additional resources or data provided in the CCUS Market report?
While the report offers comprehensive insights, it's advisable to review the specific contents or supplementary materials provided to ascertain if additional resources or data are available.
14. How can I stay updated on further developments or reports in the CCUS Market?
To stay informed about further developments, trends, and reports in the CCUS Market, consider subscribing to industry newsletters, following relevant companies and organizations, or regularly checking reputable industry news sources and publications.
Methodology
Step 1 - Identification of Relevant Samples Size from Population Database


Step 2 - Approaches for Defining Global Market Size (Value, Volume* & Price*)

Note*: In applicable scenarios
Step 3 - Data Sources
Primary Research
- Web Analytics
- Survey Reports
- Research Institute
- Latest Research Reports
- Opinion Leaders
Secondary Research
- Annual Reports
- White Paper
- Latest Press Release
- Industry Association
- Paid Database
- Investor Presentations

Step 4 - Data Triangulation
Involves using different sources of information in order to increase the validity of a study
These sources are likely to be stakeholders in a program - participants, other researchers, program staff, other community members, and so on.
Then we put all data in single framework & apply various statistical tools to find out the dynamic on the market.
During the analysis stage, feedback from the stakeholder groups would be compared to determine areas of agreement as well as areas of divergence