
Key Insights
The Asia-Pacific (APAC) alcoholic drinks market, a dynamic and diverse landscape, is projected to experience robust growth, driven by rising disposable incomes, increasing urbanization, and a burgeoning young adult population. The market's CAGR of 5.22% suggests a steady expansion, with significant contributions anticipated from key countries like China, India, Japan, and South Korea. Growth is fueled by changing consumer preferences, including a shift towards premium and craft beverages, and the increasing popularity of ready-to-drink (RTD) cocktails and flavored alcoholic beverages. The on-trade channel, encompassing bars, restaurants, and hotels, is expected to witness considerable growth due to the reopening of hospitality sectors post-pandemic, while the off-trade segment (retail stores and online sales) continues to benefit from e-commerce expansion and evolving consumer purchasing habits. However, government regulations on alcohol consumption, particularly in some Asian countries with stricter licensing and advertising restrictions, pose a significant challenge. Furthermore, health consciousness and increasing awareness of alcohol's health implications may slightly curb overall market expansion. Competition within the APAC alcoholic drinks market is intense, with both international and local players vying for market share. This competitive landscape necessitates strategic brand positioning, innovative product development, and effective marketing campaigns to succeed.
The segmentation within the APAC market showcases distinct regional preferences. While beer remains a dominant category across most APAC nations, the spirits segment is experiencing rapid growth, particularly in emerging economies, driven by the rising popularity of premium whiskeys, vodkas, and local spirits. Wine consumption is also steadily increasing in countries like China and Japan, reflecting evolving tastes and a growing appreciation for global wines. The distribution channels are also evolving, with online sales gaining traction, particularly among younger demographics. Successful companies are adapting their strategies to address the unique characteristics of each market, adapting product offerings, distribution networks, and marketing approaches to resonate with local consumer preferences and cultural nuances. Understanding these intricacies is key for sustained growth and market leadership within the highly competitive APAC alcoholic drinks sector.
APAC Alcoholic Drinks Industry: 2019-2033 Market Analysis & Forecast
This comprehensive report provides an in-depth analysis of the Asia-Pacific (APAC) alcoholic drinks industry, covering the period from 2019 to 2033. It offers valuable insights into market trends, competitive dynamics, and future growth opportunities, equipping stakeholders with actionable intelligence for strategic decision-making. The report utilizes data from 2019-2024 as the historical period, 2025 as the base and estimated year, and 2025-2033 as the forecast period. Market sizes are expressed in Millions.
APAC Alcoholic Drinks Industry Market Concentration & Innovation
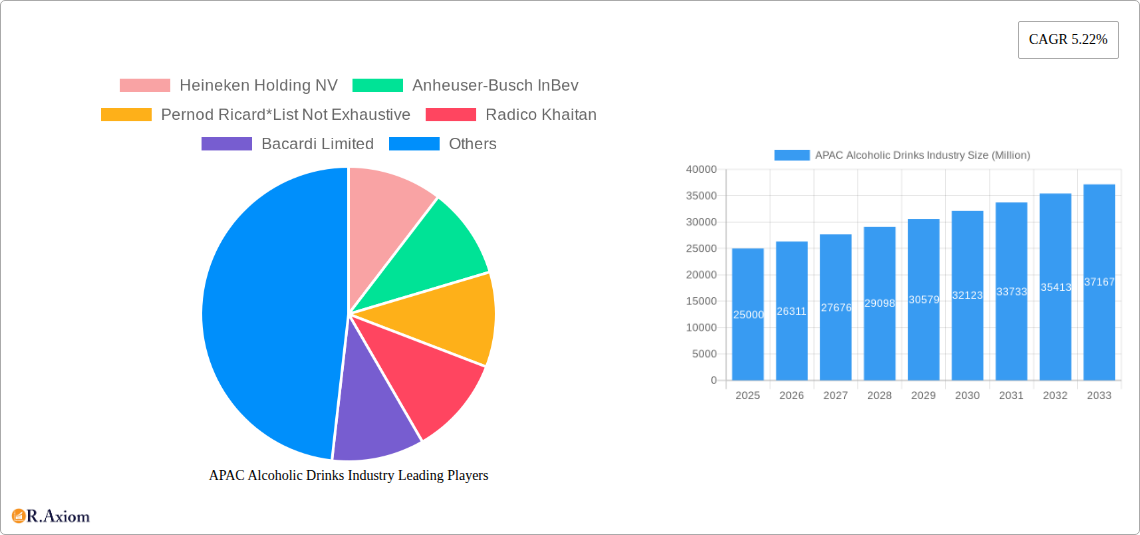
The APAC alcoholic drinks market exhibits a moderately concentrated structure, dominated by global giants like Heineken Holding NV, Anheuser-Busch InBev, and Pernod Ricard, alongside significant regional players such as Radico Khaitan, Bacardi Limited, Suntory Beverages & Food Limited, Brown-Forman, Molson Coors Brewing Company, Diageo PLC, and The Wine Group LLC. These companies hold a combined market share of approximately xx%, reflecting the industry's oligopolistic nature. However, the market also features numerous smaller, niche players, particularly in the craft beer and artisanal spirits segments.
Innovation is a key driver, with companies investing heavily in R&D to develop new product variations, enhance existing brands, and cater to evolving consumer preferences. This includes exploring low/no-alcohol options, premiumization strategies, and innovative packaging solutions. The regulatory landscape, varying significantly across APAC nations, significantly influences innovation, with certain markets imposing stricter regulations on alcohol advertising and marketing. Product substitution, particularly from non-alcoholic beverages and health-conscious alternatives, poses a challenge. M&A activity is frequent, with deal values reaching xx Million annually in recent years, signaling consolidation and expansion strategies within the industry. End-user trends, primarily towards premiumization and health consciousness, are shaping product development and marketing strategies.
- Market Share: Leading players hold xx% combined share.
- M&A Deal Values: Approximately xx Million annually.
- Innovation Focus: Premiumization, low/no-alcohol options, and innovative packaging.
APAC Alcoholic Drinks Industry Industry Trends & Insights
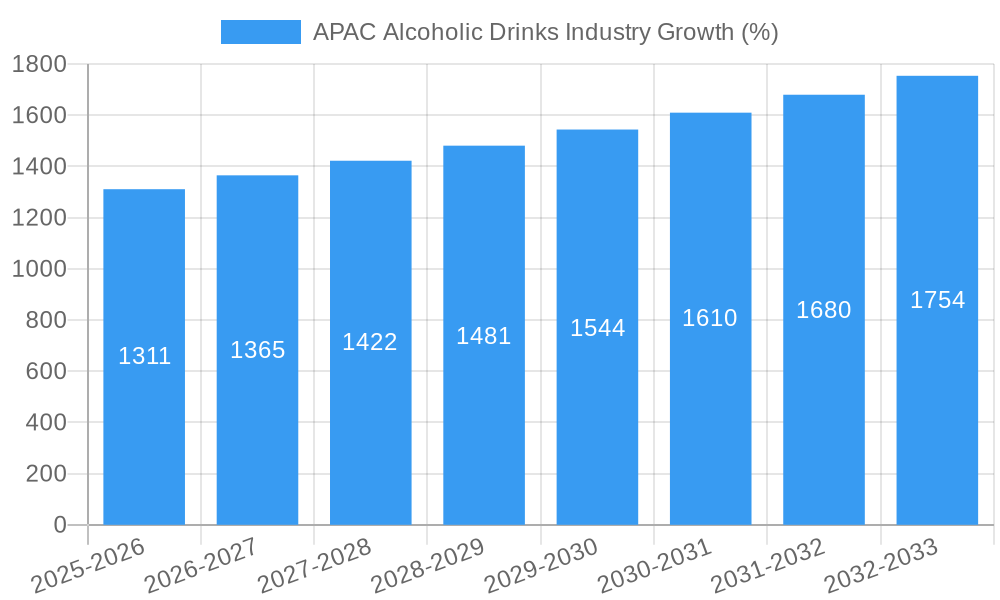
The APAC alcoholic drinks market is experiencing robust growth, driven by rising disposable incomes, changing lifestyles, and increasing urbanization across the region. The compound annual growth rate (CAGR) is projected to be xx% during the forecast period (2025-2033). Market penetration for premium products is increasing significantly, as consumers are willing to spend more on higher-quality drinks. Technological disruptions, such as e-commerce platforms and digital marketing, are transforming distribution channels and enhancing consumer reach. Consumer preferences are shifting towards healthier options, premiumization, and diverse flavor profiles. Competitive dynamics remain intense, with leading players engaging in fierce battles for market share through product innovation, strategic partnerships, and aggressive marketing campaigns.
Dominant Markets & Segments in APAC Alcoholic Drinks Industry
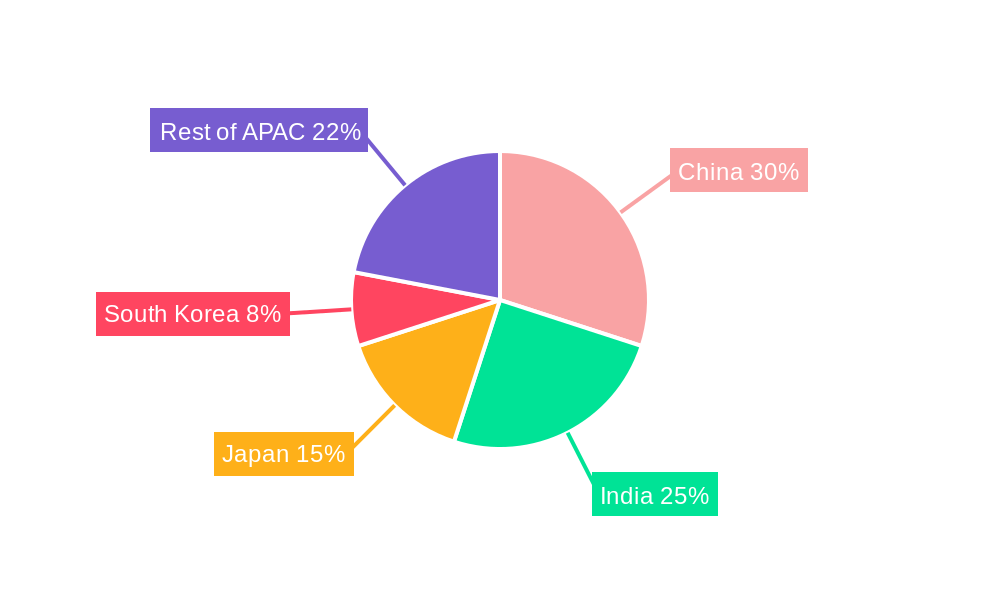
China and India represent the largest markets within the APAC alcoholic drinks industry, accounting for a combined xx% of total market value. Beer remains the dominant product type, followed by spirits and wine. The off-trade channel (retail sales) holds a larger market share compared to the on-trade (restaurants and bars).
- Key Drivers for China: Rising disposable incomes, expanding middle class, and evolving drinking culture.
- Key Drivers for India: Growing population, increasing urbanization, and rising alcohol consumption among young adults.
- Beer Dominance: High demand fueled by affordability and broad consumer appeal.
- Off-Trade Channel Dominance: Convenience and cost advantages for consumers.
Dominance Analysis: China and India's robust economic growth, combined with evolving consumer tastes, drives their dominance. The off-trade sector's convenience and reach significantly contribute to its larger market share. Beer's affordability and widespread appeal solidify its position as the leading product type.
APAC Alcoholic Drinks Industry Product Developments
Recent product innovations highlight a strong focus on premiumization, health-conscious options, and ready-to-drink (RTD) formats. Companies are leveraging technology to enhance production efficiency and improve product quality. For instance, the utilization of advanced fermentation techniques and precision brewing technologies are enhancing flavor profiles and production efficiency. The market fit for these innovations is strong, driven by consumer demand for premium and convenient products.
Report Scope & Segmentation Analysis
This report segments the APAC alcoholic drinks market based on product type (Beer, Wine, Spirits) and distribution channel (On-trade, Off-trade). Each segment's growth projections, market size, and competitive dynamics are analyzed.
Product Type:
- Beer: Dominated by large multinational brewers, with significant growth potential in craft beer segments.
- Wine: Growing steadily, fueled by increased consumption in major markets, particularly in China and India.
- Spirits: Premium segments are experiencing the fastest growth, with a focus on whiskies, vodkas, and premium gins.
Distribution Channel:
- On-trade: Moderately growing, with a shift toward premium experiences in restaurants and bars.
- Off-trade: Rapidly growing driven by e-commerce and increased retail presence.
Key Drivers of APAC Alcoholic Drinks Industry Growth
The APAC alcoholic drinks industry's growth is driven by factors such as:
- Rising Disposable Incomes: Increasing purchasing power fuels demand for premium and imported products.
- Changing Lifestyles: Urbanization and social changes have led to increased alcohol consumption.
- Evolving Consumer Preferences: Demand for premiumization, health-conscious options, and innovative product formats is rising.
Challenges in the APAC Alcoholic Drinks Industry Sector
Challenges include:
- Stricter Regulatory Environments: Stringent regulations vary widely across countries and impact marketing, sales, and distribution.
- Supply Chain Disruptions: Global events and geopolitical instability can disrupt ingredient sourcing and production.
- Intense Competition: The market is crowded, requiring companies to constantly innovate and adapt. This competition puts pressure on pricing and profitability.
Emerging Opportunities in APAP Alcoholic Drinks Industry
Emerging opportunities include:
- Growth in Emerging Markets: Expanding into less-penetrated markets offers immense growth potential.
- E-commerce Expansion: Leveraging online platforms to reach a wider audience.
- Health-Conscious Products: Catering to the growing demand for low/no-alcohol alternatives and healthier options.
Leading Players in the APAC Alcoholic Drinks Industry Market
- Heineken Holding NV
- Anheuser-Busch InBev
- Pernod Ricard
- Radico Khaitan
- Bacardi Limited
- Suntory Beverages & Food Limited
- Brown-Forman
- Molson Coors Brewing Company
- Diageo PLC
- The Wine Group LLC
Key Developments in APAC Alcoholic Drinks Industry Industry
- April 2022: Diageo India launched a new single malt whisky, leveraging local ingredients to cater to specific tastes.
- February 2022: Bacardi GTR introduced a new travel-retail exclusive Teeling Whiskey line in partnership with China Duty Free Group, capitalizing on the luxury travel retail segment.
- July 2021: The Boston Beer Company and Beam Suntory formed a strategic partnership to expand into RTDs and bottled spirits, highlighting the trend of cross-category collaboration.
Strategic Outlook for APAC Alcoholic Drinks Industry Market
The APAC alcoholic drinks market is poised for continued growth, driven by sustained economic expansion, evolving consumer preferences, and strategic investments by key players. Innovation and adaptation to changing regulations will be crucial for success. Focusing on premiumization, health-conscious options, and leveraging digital platforms will be vital to capitalize on future opportunities.
APAC Alcoholic Drinks Industry Segmentation
-
1. Product Type
- 1.1. Beer
- 1.2. Wine
- 1.3. Spirits
-
2. Distribution Channel
- 2.1. On-trade
-
2.2. Off-trade
- 2.2.1. Supermarkets/Hypermarkets
- 2.2.2. Specialist Stores
- 2.2.3. Online Retail Stores
- 2.2.4. Other Off-trade Channels
-
3. Geography
- 3.1. China
- 3.2. Japan
- 3.3. India
- 3.4. Australia
- 3.5. Rest of Asia-Pacific
APAC Alcoholic Drinks Industry Segmentation By Geography
- 1. China
- 2. Japan
- 3. India
- 4. Australia
- 5. Rest of Asia Pacific
APAC Alcoholic Drinks Industry REPORT HIGHLIGHTS
| Aspects | Details |
|---|---|
| Study Period | 2019-2033 |
| Base Year | 2024 |
| Estimated Year | 2025 |
| Forecast Period | 2025-2033 |
| Historical Period | 2019-2024 |
| Growth Rate | CAGR of 5.22% from 2019-2033 |
| Segmentation |
|
Table of Contents
- 1. Introduction
- 1.1. Research Scope
- 1.2. Market Segmentation
- 1.3. Research Methodology
- 1.4. Definitions and Assumptions
- 2. Executive Summary
- 2.1. Introduction
- 3. Market Dynamics
- 3.1. Introduction
- 3.2. Market Drivers
- 3.2.1. Convenience Offered By Online Food Delivery Services; Attractive Offers And Memberships Along With Advertisements And Marketing By Players
- 3.3. Market Restrains
- 3.3.1. Consumers Desire For Fine Dining Experience
- 3.4. Market Trends
- 3.4.1. Rising Demand for Cocktails and Other Mixed Drinks
- 4. Market Factor Analysis
- 4.1. Porters Five Forces
- 4.2. Supply/Value Chain
- 4.3. PESTEL analysis
- 4.4. Market Entropy
- 4.5. Patent/Trademark Analysis
- 5. Global APAC Alcoholic Drinks Industry Analysis, Insights and Forecast, 2019-2031
- 5.1. Market Analysis, Insights and Forecast - by Product Type
- 5.1.1. Beer
- 5.1.2. Wine
- 5.1.3. Spirits
- 5.2. Market Analysis, Insights and Forecast - by Distribution Channel
- 5.2.1. On-trade
- 5.2.2. Off-trade
- 5.2.2.1. Supermarkets/Hypermarkets
- 5.2.2.2. Specialist Stores
- 5.2.2.3. Online Retail Stores
- 5.2.2.4. Other Off-trade Channels
- 5.3. Market Analysis, Insights and Forecast - by Geography
- 5.3.1. China
- 5.3.2. Japan
- 5.3.3. India
- 5.3.4. Australia
- 5.3.5. Rest of Asia-Pacific
- 5.4. Market Analysis, Insights and Forecast - by Region
- 5.4.1. China
- 5.4.2. Japan
- 5.4.3. India
- 5.4.4. Australia
- 5.4.5. Rest of Asia Pacific
- 5.1. Market Analysis, Insights and Forecast - by Product Type
- 6. China APAC Alcoholic Drinks Industry Analysis, Insights and Forecast, 2019-2031
- 6.1. Market Analysis, Insights and Forecast - by Product Type
- 6.1.1. Beer
- 6.1.2. Wine
- 6.1.3. Spirits
- 6.2. Market Analysis, Insights and Forecast - by Distribution Channel
- 6.2.1. On-trade
- 6.2.2. Off-trade
- 6.2.2.1. Supermarkets/Hypermarkets
- 6.2.2.2. Specialist Stores
- 6.2.2.3. Online Retail Stores
- 6.2.2.4. Other Off-trade Channels
- 6.3. Market Analysis, Insights and Forecast - by Geography
- 6.3.1. China
- 6.3.2. Japan
- 6.3.3. India
- 6.3.4. Australia
- 6.3.5. Rest of Asia-Pacific
- 6.1. Market Analysis, Insights and Forecast - by Product Type
- 7. Japan APAC Alcoholic Drinks Industry Analysis, Insights and Forecast, 2019-2031
- 7.1. Market Analysis, Insights and Forecast - by Product Type
- 7.1.1. Beer
- 7.1.2. Wine
- 7.1.3. Spirits
- 7.2. Market Analysis, Insights and Forecast - by Distribution Channel
- 7.2.1. On-trade
- 7.2.2. Off-trade
- 7.2.2.1. Supermarkets/Hypermarkets
- 7.2.2.2. Specialist Stores
- 7.2.2.3. Online Retail Stores
- 7.2.2.4. Other Off-trade Channels
- 7.3. Market Analysis, Insights and Forecast - by Geography
- 7.3.1. China
- 7.3.2. Japan
- 7.3.3. India
- 7.3.4. Australia
- 7.3.5. Rest of Asia-Pacific
- 7.1. Market Analysis, Insights and Forecast - by Product Type
- 8. India APAC Alcoholic Drinks Industry Analysis, Insights and Forecast, 2019-2031
- 8.1. Market Analysis, Insights and Forecast - by Product Type
- 8.1.1. Beer
- 8.1.2. Wine
- 8.1.3. Spirits
- 8.2. Market Analysis, Insights and Forecast - by Distribution Channel
- 8.2.1. On-trade
- 8.2.2. Off-trade
- 8.2.2.1. Supermarkets/Hypermarkets
- 8.2.2.2. Specialist Stores
- 8.2.2.3. Online Retail Stores
- 8.2.2.4. Other Off-trade Channels
- 8.3. Market Analysis, Insights and Forecast - by Geography
- 8.3.1. China
- 8.3.2. Japan
- 8.3.3. India
- 8.3.4. Australia
- 8.3.5. Rest of Asia-Pacific
- 8.1. Market Analysis, Insights and Forecast - by Product Type
- 9. Australia APAC Alcoholic Drinks Industry Analysis, Insights and Forecast, 2019-2031
- 9.1. Market Analysis, Insights and Forecast - by Product Type
- 9.1.1. Beer
- 9.1.2. Wine
- 9.1.3. Spirits
- 9.2. Market Analysis, Insights and Forecast - by Distribution Channel
- 9.2.1. On-trade
- 9.2.2. Off-trade
- 9.2.2.1. Supermarkets/Hypermarkets
- 9.2.2.2. Specialist Stores
- 9.2.2.3. Online Retail Stores
- 9.2.2.4. Other Off-trade Channels
- 9.3. Market Analysis, Insights and Forecast - by Geography
- 9.3.1. China
- 9.3.2. Japan
- 9.3.3. India
- 9.3.4. Australia
- 9.3.5. Rest of Asia-Pacific
- 9.1. Market Analysis, Insights and Forecast - by Product Type
- 10. Rest of Asia Pacific APAC Alcoholic Drinks Industry Analysis, Insights and Forecast, 2019-2031
- 10.1. Market Analysis, Insights and Forecast - by Product Type
- 10.1.1. Beer
- 10.1.2. Wine
- 10.1.3. Spirits
- 10.2. Market Analysis, Insights and Forecast - by Distribution Channel
- 10.2.1. On-trade
- 10.2.2. Off-trade
- 10.2.2.1. Supermarkets/Hypermarkets
- 10.2.2.2. Specialist Stores
- 10.2.2.3. Online Retail Stores
- 10.2.2.4. Other Off-trade Channels
- 10.3. Market Analysis, Insights and Forecast - by Geography
- 10.3.1. China
- 10.3.2. Japan
- 10.3.3. India
- 10.3.4. Australia
- 10.3.5. Rest of Asia-Pacific
- 10.1. Market Analysis, Insights and Forecast - by Product Type
- 11. North America APAC Alcoholic Drinks Industry Analysis, Insights and Forecast, 2019-2031
- 11.1. Market Analysis, Insights and Forecast - By Country/Sub-region
- 11.1.1 United States
- 11.1.2 Canada
- 11.1.3 Mexico
- 12. Europe APAC Alcoholic Drinks Industry Analysis, Insights and Forecast, 2019-2031
- 12.1. Market Analysis, Insights and Forecast - By Country/Sub-region
- 12.1.1 Germany
- 12.1.2 United Kingdom
- 12.1.3 France
- 12.1.4 Spain
- 12.1.5 Italy
- 12.1.6 Spain
- 12.1.7 Belgium
- 12.1.8 Netherland
- 12.1.9 Nordics
- 12.1.10 Rest of Europe
- 13. Asia Pacific APAC Alcoholic Drinks Industry Analysis, Insights and Forecast, 2019-2031
- 13.1. Market Analysis, Insights and Forecast - By Country/Sub-region
- 13.1.1 China
- 13.1.2 Japan
- 13.1.3 India
- 13.1.4 South Korea
- 13.1.5 Southeast Asia
- 13.1.6 Australia
- 13.1.7 Indonesia
- 13.1.8 Phillipes
- 13.1.9 Singapore
- 13.1.10 Thailandc
- 13.1.11 Rest of Asia Pacific
- 14. South America APAC Alcoholic Drinks Industry Analysis, Insights and Forecast, 2019-2031
- 14.1. Market Analysis, Insights and Forecast - By Country/Sub-region
- 14.1.1 Brazil
- 14.1.2 Argentina
- 14.1.3 Peru
- 14.1.4 Chile
- 14.1.5 Colombia
- 14.1.6 Ecuador
- 14.1.7 Venezuela
- 14.1.8 Rest of South America
- 15. North America APAC Alcoholic Drinks Industry Analysis, Insights and Forecast, 2019-2031
- 15.1. Market Analysis, Insights and Forecast - By Country/Sub-region
- 15.1.1 United States
- 15.1.2 Canada
- 15.1.3 Mexico
- 16. MEA APAC Alcoholic Drinks Industry Analysis, Insights and Forecast, 2019-2031
- 16.1. Market Analysis, Insights and Forecast - By Country/Sub-region
- 16.1.1 United Arab Emirates
- 16.1.2 Saudi Arabia
- 16.1.3 South Africa
- 16.1.4 Rest of Middle East and Africa
- 17. Competitive Analysis
- 17.1. Global Market Share Analysis 2024
- 17.2. Company Profiles
- 17.2.1 Heineken Holding NV
- 17.2.1.1. Overview
- 17.2.1.2. Products
- 17.2.1.3. SWOT Analysis
- 17.2.1.4. Recent Developments
- 17.2.1.5. Financials (Based on Availability)
- 17.2.2 Anheuser-Busch InBev
- 17.2.2.1. Overview
- 17.2.2.2. Products
- 17.2.2.3. SWOT Analysis
- 17.2.2.4. Recent Developments
- 17.2.2.5. Financials (Based on Availability)
- 17.2.3 Pernod Ricard*List Not Exhaustive
- 17.2.3.1. Overview
- 17.2.3.2. Products
- 17.2.3.3. SWOT Analysis
- 17.2.3.4. Recent Developments
- 17.2.3.5. Financials (Based on Availability)
- 17.2.4 Radico Khaitan
- 17.2.4.1. Overview
- 17.2.4.2. Products
- 17.2.4.3. SWOT Analysis
- 17.2.4.4. Recent Developments
- 17.2.4.5. Financials (Based on Availability)
- 17.2.5 Bacardi Limited
- 17.2.5.1. Overview
- 17.2.5.2. Products
- 17.2.5.3. SWOT Analysis
- 17.2.5.4. Recent Developments
- 17.2.5.5. Financials (Based on Availability)
- 17.2.6 Suntory Beverages & Food Limited
- 17.2.6.1. Overview
- 17.2.6.2. Products
- 17.2.6.3. SWOT Analysis
- 17.2.6.4. Recent Developments
- 17.2.6.5. Financials (Based on Availability)
- 17.2.7 Brown-Forman
- 17.2.7.1. Overview
- 17.2.7.2. Products
- 17.2.7.3. SWOT Analysis
- 17.2.7.4. Recent Developments
- 17.2.7.5. Financials (Based on Availability)
- 17.2.8 Molson Coors Brewing Company
- 17.2.8.1. Overview
- 17.2.8.2. Products
- 17.2.8.3. SWOT Analysis
- 17.2.8.4. Recent Developments
- 17.2.8.5. Financials (Based on Availability)
- 17.2.9 Diageo PLC
- 17.2.9.1. Overview
- 17.2.9.2. Products
- 17.2.9.3. SWOT Analysis
- 17.2.9.4. Recent Developments
- 17.2.9.5. Financials (Based on Availability)
- 17.2.10 The Wine Group LLC
- 17.2.10.1. Overview
- 17.2.10.2. Products
- 17.2.10.3. SWOT Analysis
- 17.2.10.4. Recent Developments
- 17.2.10.5. Financials (Based on Availability)
- 17.2.1 Heineken Holding NV
List of Figures
- Figure 1: Global APAC Alcoholic Drinks Industry Revenue Breakdown (Million, %) by Region 2024 & 2032
- Figure 2: North America APAC Alcoholic Drinks Industry Revenue (Million), by Country 2024 & 2032
- Figure 3: North America APAC Alcoholic Drinks Industry Revenue Share (%), by Country 2024 & 2032
- Figure 4: Europe APAC Alcoholic Drinks Industry Revenue (Million), by Country 2024 & 2032
- Figure 5: Europe APAC Alcoholic Drinks Industry Revenue Share (%), by Country 2024 & 2032
- Figure 6: Asia Pacific APAC Alcoholic Drinks Industry Revenue (Million), by Country 2024 & 2032
- Figure 7: Asia Pacific APAC Alcoholic Drinks Industry Revenue Share (%), by Country 2024 & 2032
- Figure 8: South America APAC Alcoholic Drinks Industry Revenue (Million), by Country 2024 & 2032
- Figure 9: South America APAC Alcoholic Drinks Industry Revenue Share (%), by Country 2024 & 2032
- Figure 10: North America APAC Alcoholic Drinks Industry Revenue (Million), by Country 2024 & 2032
- Figure 11: North America APAC Alcoholic Drinks Industry Revenue Share (%), by Country 2024 & 2032
- Figure 12: MEA APAC Alcoholic Drinks Industry Revenue (Million), by Country 2024 & 2032
- Figure 13: MEA APAC Alcoholic Drinks Industry Revenue Share (%), by Country 2024 & 2032
- Figure 14: China APAC Alcoholic Drinks Industry Revenue (Million), by Product Type 2024 & 2032
- Figure 15: China APAC Alcoholic Drinks Industry Revenue Share (%), by Product Type 2024 & 2032
- Figure 16: China APAC Alcoholic Drinks Industry Revenue (Million), by Distribution Channel 2024 & 2032
- Figure 17: China APAC Alcoholic Drinks Industry Revenue Share (%), by Distribution Channel 2024 & 2032
- Figure 18: China APAC Alcoholic Drinks Industry Revenue (Million), by Geography 2024 & 2032
- Figure 19: China APAC Alcoholic Drinks Industry Revenue Share (%), by Geography 2024 & 2032
- Figure 20: China APAC Alcoholic Drinks Industry Revenue (Million), by Country 2024 & 2032
- Figure 21: China APAC Alcoholic Drinks Industry Revenue Share (%), by Country 2024 & 2032
- Figure 22: Japan APAC Alcoholic Drinks Industry Revenue (Million), by Product Type 2024 & 2032
- Figure 23: Japan APAC Alcoholic Drinks Industry Revenue Share (%), by Product Type 2024 & 2032
- Figure 24: Japan APAC Alcoholic Drinks Industry Revenue (Million), by Distribution Channel 2024 & 2032
- Figure 25: Japan APAC Alcoholic Drinks Industry Revenue Share (%), by Distribution Channel 2024 & 2032
- Figure 26: Japan APAC Alcoholic Drinks Industry Revenue (Million), by Geography 2024 & 2032
- Figure 27: Japan APAC Alcoholic Drinks Industry Revenue Share (%), by Geography 2024 & 2032
- Figure 28: Japan APAC Alcoholic Drinks Industry Revenue (Million), by Country 2024 & 2032
- Figure 29: Japan APAC Alcoholic Drinks Industry Revenue Share (%), by Country 2024 & 2032
- Figure 30: India APAC Alcoholic Drinks Industry Revenue (Million), by Product Type 2024 & 2032
- Figure 31: India APAC Alcoholic Drinks Industry Revenue Share (%), by Product Type 2024 & 2032
- Figure 32: India APAC Alcoholic Drinks Industry Revenue (Million), by Distribution Channel 2024 & 2032
- Figure 33: India APAC Alcoholic Drinks Industry Revenue Share (%), by Distribution Channel 2024 & 2032
- Figure 34: India APAC Alcoholic Drinks Industry Revenue (Million), by Geography 2024 & 2032
- Figure 35: India APAC Alcoholic Drinks Industry Revenue Share (%), by Geography 2024 & 2032
- Figure 36: India APAC Alcoholic Drinks Industry Revenue (Million), by Country 2024 & 2032
- Figure 37: India APAC Alcoholic Drinks Industry Revenue Share (%), by Country 2024 & 2032
- Figure 38: Australia APAC Alcoholic Drinks Industry Revenue (Million), by Product Type 2024 & 2032
- Figure 39: Australia APAC Alcoholic Drinks Industry Revenue Share (%), by Product Type 2024 & 2032
- Figure 40: Australia APAC Alcoholic Drinks Industry Revenue (Million), by Distribution Channel 2024 & 2032
- Figure 41: Australia APAC Alcoholic Drinks Industry Revenue Share (%), by Distribution Channel 2024 & 2032
- Figure 42: Australia APAC Alcoholic Drinks Industry Revenue (Million), by Geography 2024 & 2032
- Figure 43: Australia APAC Alcoholic Drinks Industry Revenue Share (%), by Geography 2024 & 2032
- Figure 44: Australia APAC Alcoholic Drinks Industry Revenue (Million), by Country 2024 & 2032
- Figure 45: Australia APAC Alcoholic Drinks Industry Revenue Share (%), by Country 2024 & 2032
- Figure 46: Rest of Asia Pacific APAC Alcoholic Drinks Industry Revenue (Million), by Product Type 2024 & 2032
- Figure 47: Rest of Asia Pacific APAC Alcoholic Drinks Industry Revenue Share (%), by Product Type 2024 & 2032
- Figure 48: Rest of Asia Pacific APAC Alcoholic Drinks Industry Revenue (Million), by Distribution Channel 2024 & 2032
- Figure 49: Rest of Asia Pacific APAC Alcoholic Drinks Industry Revenue Share (%), by Distribution Channel 2024 & 2032
- Figure 50: Rest of Asia Pacific APAC Alcoholic Drinks Industry Revenue (Million), by Geography 2024 & 2032
- Figure 51: Rest of Asia Pacific APAC Alcoholic Drinks Industry Revenue Share (%), by Geography 2024 & 2032
- Figure 52: Rest of Asia Pacific APAC Alcoholic Drinks Industry Revenue (Million), by Country 2024 & 2032
- Figure 53: Rest of Asia Pacific APAC Alcoholic Drinks Industry Revenue Share (%), by Country 2024 & 2032
List of Tables
- Table 1: Global APAC Alcoholic Drinks Industry Revenue Million Forecast, by Region 2019 & 2032
- Table 2: Global APAC Alcoholic Drinks Industry Revenue Million Forecast, by Product Type 2019 & 2032
- Table 3: Global APAC Alcoholic Drinks Industry Revenue Million Forecast, by Distribution Channel 2019 & 2032
- Table 4: Global APAC Alcoholic Drinks Industry Revenue Million Forecast, by Geography 2019 & 2032
- Table 5: Global APAC Alcoholic Drinks Industry Revenue Million Forecast, by Region 2019 & 2032
- Table 6: Global APAC Alcoholic Drinks Industry Revenue Million Forecast, by Country 2019 & 2032
- Table 7: United States APAC Alcoholic Drinks Industry Revenue (Million) Forecast, by Application 2019 & 2032
- Table 8: Canada APAC Alcoholic Drinks Industry Revenue (Million) Forecast, by Application 2019 & 2032
- Table 9: Mexico APAC Alcoholic Drinks Industry Revenue (Million) Forecast, by Application 2019 & 2032
- Table 10: Global APAC Alcoholic Drinks Industry Revenue Million Forecast, by Country 2019 & 2032
- Table 11: Germany APAC Alcoholic Drinks Industry Revenue (Million) Forecast, by Application 2019 & 2032
- Table 12: United Kingdom APAC Alcoholic Drinks Industry Revenue (Million) Forecast, by Application 2019 & 2032
- Table 13: France APAC Alcoholic Drinks Industry Revenue (Million) Forecast, by Application 2019 & 2032
- Table 14: Spain APAC Alcoholic Drinks Industry Revenue (Million) Forecast, by Application 2019 & 2032
- Table 15: Italy APAC Alcoholic Drinks Industry Revenue (Million) Forecast, by Application 2019 & 2032
- Table 16: Spain APAC Alcoholic Drinks Industry Revenue (Million) Forecast, by Application 2019 & 2032
- Table 17: Belgium APAC Alcoholic Drinks Industry Revenue (Million) Forecast, by Application 2019 & 2032
- Table 18: Netherland APAC Alcoholic Drinks Industry Revenue (Million) Forecast, by Application 2019 & 2032
- Table 19: Nordics APAC Alcoholic Drinks Industry Revenue (Million) Forecast, by Application 2019 & 2032
- Table 20: Rest of Europe APAC Alcoholic Drinks Industry Revenue (Million) Forecast, by Application 2019 & 2032
- Table 21: Global APAC Alcoholic Drinks Industry Revenue Million Forecast, by Country 2019 & 2032
- Table 22: China APAC Alcoholic Drinks Industry Revenue (Million) Forecast, by Application 2019 & 2032
- Table 23: Japan APAC Alcoholic Drinks Industry Revenue (Million) Forecast, by Application 2019 & 2032
- Table 24: India APAC Alcoholic Drinks Industry Revenue (Million) Forecast, by Application 2019 & 2032
- Table 25: South Korea APAC Alcoholic Drinks Industry Revenue (Million) Forecast, by Application 2019 & 2032
- Table 26: Southeast Asia APAC Alcoholic Drinks Industry Revenue (Million) Forecast, by Application 2019 & 2032
- Table 27: Australia APAC Alcoholic Drinks Industry Revenue (Million) Forecast, by Application 2019 & 2032
- Table 28: Indonesia APAC Alcoholic Drinks Industry Revenue (Million) Forecast, by Application 2019 & 2032
- Table 29: Phillipes APAC Alcoholic Drinks Industry Revenue (Million) Forecast, by Application 2019 & 2032
- Table 30: Singapore APAC Alcoholic Drinks Industry Revenue (Million) Forecast, by Application 2019 & 2032
- Table 31: Thailandc APAC Alcoholic Drinks Industry Revenue (Million) Forecast, by Application 2019 & 2032
- Table 32: Rest of Asia Pacific APAC Alcoholic Drinks Industry Revenue (Million) Forecast, by Application 2019 & 2032
- Table 33: Global APAC Alcoholic Drinks Industry Revenue Million Forecast, by Country 2019 & 2032
- Table 34: Brazil APAC Alcoholic Drinks Industry Revenue (Million) Forecast, by Application 2019 & 2032
- Table 35: Argentina APAC Alcoholic Drinks Industry Revenue (Million) Forecast, by Application 2019 & 2032
- Table 36: Peru APAC Alcoholic Drinks Industry Revenue (Million) Forecast, by Application 2019 & 2032
- Table 37: Chile APAC Alcoholic Drinks Industry Revenue (Million) Forecast, by Application 2019 & 2032
- Table 38: Colombia APAC Alcoholic Drinks Industry Revenue (Million) Forecast, by Application 2019 & 2032
- Table 39: Ecuador APAC Alcoholic Drinks Industry Revenue (Million) Forecast, by Application 2019 & 2032
- Table 40: Venezuela APAC Alcoholic Drinks Industry Revenue (Million) Forecast, by Application 2019 & 2032
- Table 41: Rest of South America APAC Alcoholic Drinks Industry Revenue (Million) Forecast, by Application 2019 & 2032
- Table 42: Global APAC Alcoholic Drinks Industry Revenue Million Forecast, by Country 2019 & 2032
- Table 43: United States APAC Alcoholic Drinks Industry Revenue (Million) Forecast, by Application 2019 & 2032
- Table 44: Canada APAC Alcoholic Drinks Industry Revenue (Million) Forecast, by Application 2019 & 2032
- Table 45: Mexico APAC Alcoholic Drinks Industry Revenue (Million) Forecast, by Application 2019 & 2032
- Table 46: Global APAC Alcoholic Drinks Industry Revenue Million Forecast, by Country 2019 & 2032
- Table 47: United Arab Emirates APAC Alcoholic Drinks Industry Revenue (Million) Forecast, by Application 2019 & 2032
- Table 48: Saudi Arabia APAC Alcoholic Drinks Industry Revenue (Million) Forecast, by Application 2019 & 2032
- Table 49: South Africa APAC Alcoholic Drinks Industry Revenue (Million) Forecast, by Application 2019 & 2032
- Table 50: Rest of Middle East and Africa APAC Alcoholic Drinks Industry Revenue (Million) Forecast, by Application 2019 & 2032
- Table 51: Global APAC Alcoholic Drinks Industry Revenue Million Forecast, by Product Type 2019 & 2032
- Table 52: Global APAC Alcoholic Drinks Industry Revenue Million Forecast, by Distribution Channel 2019 & 2032
- Table 53: Global APAC Alcoholic Drinks Industry Revenue Million Forecast, by Geography 2019 & 2032
- Table 54: Global APAC Alcoholic Drinks Industry Revenue Million Forecast, by Country 2019 & 2032
- Table 55: Global APAC Alcoholic Drinks Industry Revenue Million Forecast, by Product Type 2019 & 2032
- Table 56: Global APAC Alcoholic Drinks Industry Revenue Million Forecast, by Distribution Channel 2019 & 2032
- Table 57: Global APAC Alcoholic Drinks Industry Revenue Million Forecast, by Geography 2019 & 2032
- Table 58: Global APAC Alcoholic Drinks Industry Revenue Million Forecast, by Country 2019 & 2032
- Table 59: Global APAC Alcoholic Drinks Industry Revenue Million Forecast, by Product Type 2019 & 2032
- Table 60: Global APAC Alcoholic Drinks Industry Revenue Million Forecast, by Distribution Channel 2019 & 2032
- Table 61: Global APAC Alcoholic Drinks Industry Revenue Million Forecast, by Geography 2019 & 2032
- Table 62: Global APAC Alcoholic Drinks Industry Revenue Million Forecast, by Country 2019 & 2032
- Table 63: Global APAC Alcoholic Drinks Industry Revenue Million Forecast, by Product Type 2019 & 2032
- Table 64: Global APAC Alcoholic Drinks Industry Revenue Million Forecast, by Distribution Channel 2019 & 2032
- Table 65: Global APAC Alcoholic Drinks Industry Revenue Million Forecast, by Geography 2019 & 2032
- Table 66: Global APAC Alcoholic Drinks Industry Revenue Million Forecast, by Country 2019 & 2032
- Table 67: Global APAC Alcoholic Drinks Industry Revenue Million Forecast, by Product Type 2019 & 2032
- Table 68: Global APAC Alcoholic Drinks Industry Revenue Million Forecast, by Distribution Channel 2019 & 2032
- Table 69: Global APAC Alcoholic Drinks Industry Revenue Million Forecast, by Geography 2019 & 2032
- Table 70: Global APAC Alcoholic Drinks Industry Revenue Million Forecast, by Country 2019 & 2032
Frequently Asked Questions
1. What is the projected Compound Annual Growth Rate (CAGR) of the APAC Alcoholic Drinks Industry?
The projected CAGR is approximately 5.22%.
2. Which companies are prominent players in the APAC Alcoholic Drinks Industry?
Key companies in the market include Heineken Holding NV, Anheuser-Busch InBev, Pernod Ricard*List Not Exhaustive, Radico Khaitan, Bacardi Limited, Suntory Beverages & Food Limited, Brown-Forman, Molson Coors Brewing Company, Diageo PLC, The Wine Group LLC.
3. What are the main segments of the APAC Alcoholic Drinks Industry?
The market segments include Product Type, Distribution Channel, Geography.
4. Can you provide details about the market size?
The market size is estimated to be USD XX Million as of 2022.
5. What are some drivers contributing to market growth?
Convenience Offered By Online Food Delivery Services; Attractive Offers And Memberships Along With Advertisements And Marketing By Players.
6. What are the notable trends driving market growth?
Rising Demand for Cocktails and Other Mixed Drinks.
7. Are there any restraints impacting market growth?
Consumers Desire For Fine Dining Experience.
8. Can you provide examples of recent developments in the market?
In April 2022, Diageo India launched a new single malt whisky and two mixers for its Johnnie Walker and Black & White Scotch brands. The new whisky was created using Rajasthan-specific six-row barley grains and was aged at a heat of more than 100°F.
9. What pricing options are available for accessing the report?
Pricing options include single-user, multi-user, and enterprise licenses priced at USD 4750, USD 5250, and USD 8750 respectively.
10. Is the market size provided in terms of value or volume?
The market size is provided in terms of value, measured in Million.
11. Are there any specific market keywords associated with the report?
Yes, the market keyword associated with the report is "APAC Alcoholic Drinks Industry," which aids in identifying and referencing the specific market segment covered.
12. How do I determine which pricing option suits my needs best?
The pricing options vary based on user requirements and access needs. Individual users may opt for single-user licenses, while businesses requiring broader access may choose multi-user or enterprise licenses for cost-effective access to the report.
13. Are there any additional resources or data provided in the APAC Alcoholic Drinks Industry report?
While the report offers comprehensive insights, it's advisable to review the specific contents or supplementary materials provided to ascertain if additional resources or data are available.
14. How can I stay updated on further developments or reports in the APAC Alcoholic Drinks Industry?
To stay informed about further developments, trends, and reports in the APAC Alcoholic Drinks Industry, consider subscribing to industry newsletters, following relevant companies and organizations, or regularly checking reputable industry news sources and publications.
Methodology
Step 1 - Identification of Relevant Samples Size from Population Database


Step 2 - Approaches for Defining Global Market Size (Value, Volume* & Price*)

Note*: In applicable scenarios
Step 3 - Data Sources
Primary Research
- Web Analytics
- Survey Reports
- Research Institute
- Latest Research Reports
- Opinion Leaders
Secondary Research
- Annual Reports
- White Paper
- Latest Press Release
- Industry Association
- Paid Database
- Investor Presentations

Step 4 - Data Triangulation
Involves using different sources of information in order to increase the validity of a study
These sources are likely to be stakeholders in a program - participants, other researchers, program staff, other community members, and so on.
Then we put all data in single framework & apply various statistical tools to find out the dynamic on the market.
During the analysis stage, feedback from the stakeholder groups would be compared to determine areas of agreement as well as areas of divergence


