

Key Insights
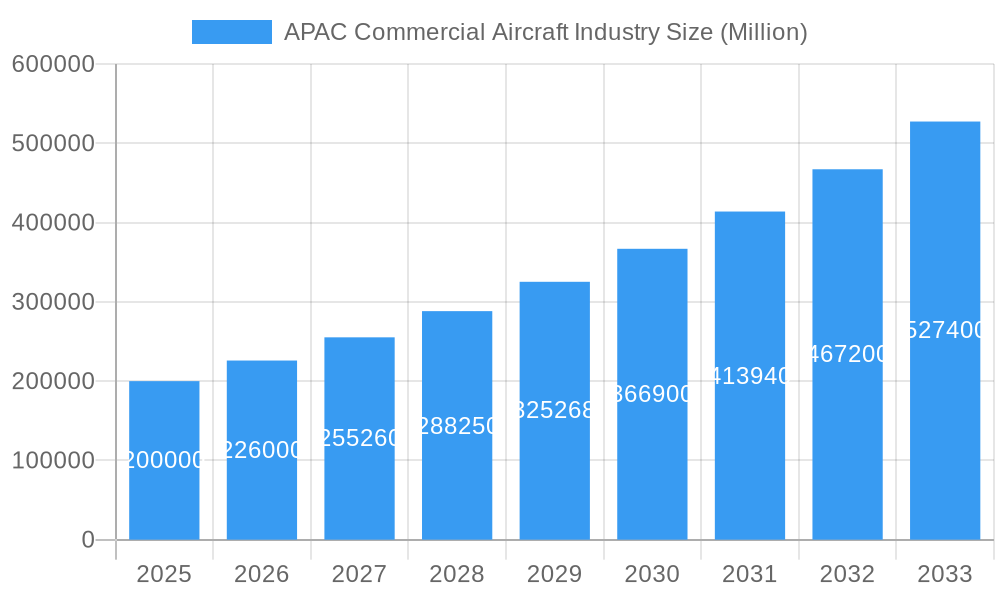
The Asia-Pacific (APAC) commercial aircraft market is experiencing robust growth, driven by increasing air passenger traffic, expanding airline fleets, and the region's burgeoning middle class fueling demand for air travel. A Compound Annual Growth Rate (CAGR) exceeding 13% from 2019 to 2033 indicates a significant expansion, projecting a substantial market value by 2033. Key drivers include infrastructure development at major airports across the region, supportive government policies promoting aviation growth, and the emergence of low-cost carriers (LCCs) which stimulate affordability and accessibility. The market is segmented by aircraft type (narrow-body, wide-body, regional), engine type (turbofan, turboprop), and application (passenger, freighter), reflecting diverse needs within the industry. Major players like Boeing, Airbus, Commercial Aircraft Corporation of China (COMAC), and Embraer are competing intensely, leveraging technological advancements and strategic partnerships to gain market share. While the market faces potential restraints such as geopolitical uncertainties and fluctuating fuel prices, the long-term outlook remains positive, with strong growth projections continuing through 2033.
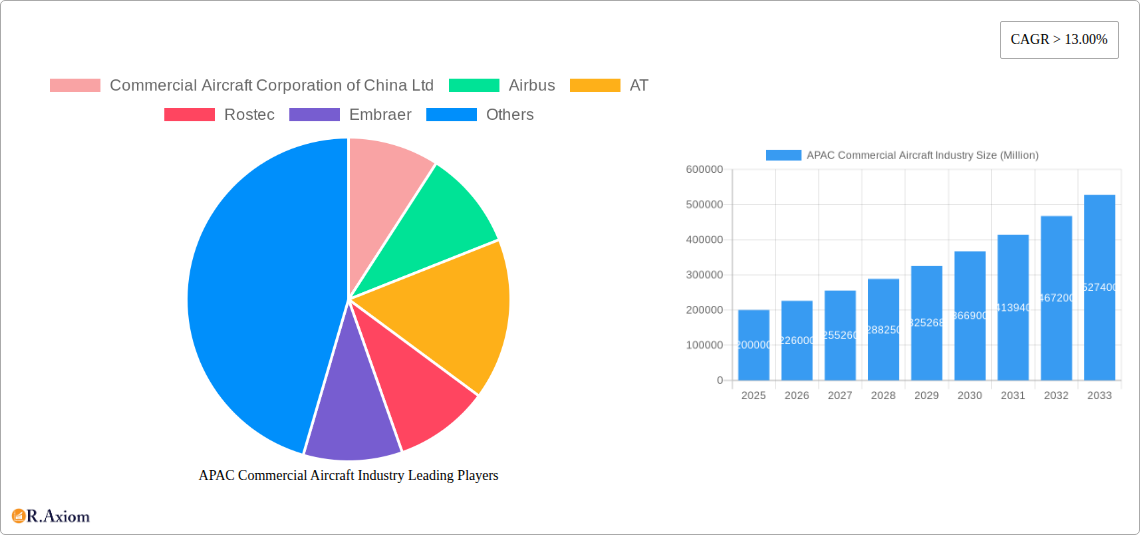
APAC Commercial Aircraft Industry Market Size (In Billion)
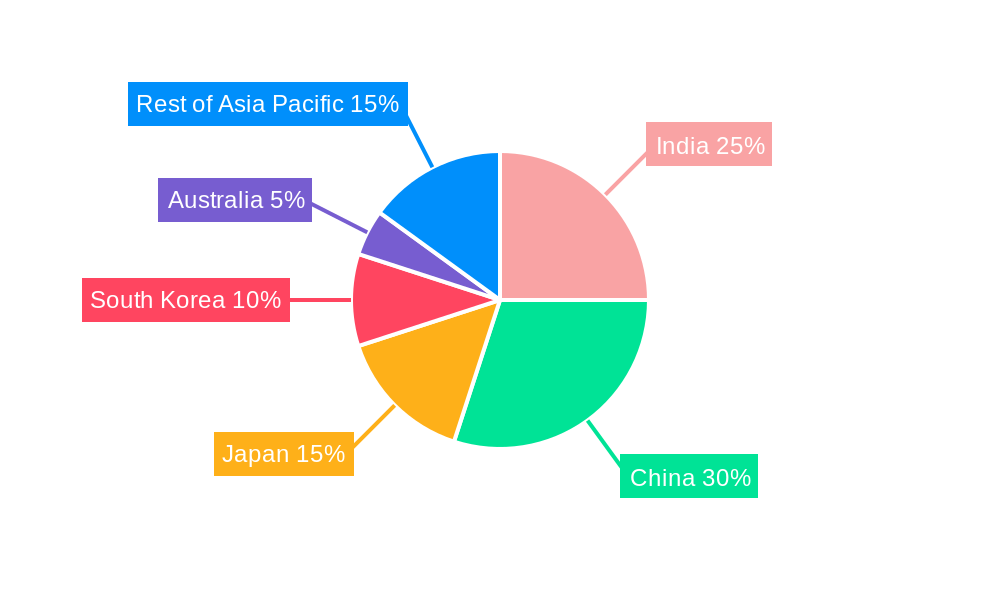
Growth is particularly strong in key markets such as India and China, which are witnessing rapid economic expansion and a corresponding surge in domestic and international air travel. Japan, South Korea, and Australia also contribute significantly, showcasing a balanced growth profile across the APAC region. The preference for fuel-efficient narrow-body aircraft is expected to remain prevalent due to their suitability for high-density routes and cost-effectiveness. However, the demand for wide-body aircraft is also projected to grow, driven by long-haul international travel. The increasing focus on sustainability within the aviation sector is likely to influence the adoption of more fuel-efficient engines and advanced aircraft technologies in the coming years. This will shape the competitive landscape, favoring manufacturers who prioritize innovation and environmental responsibility. Continued infrastructure investments, coupled with favorable economic conditions, are crucial for maintaining this positive trajectory in the APAC commercial aircraft market.
APAC Commercial Aircraft Industry Company Market Share
APAC Commercial Aircraft Industry: Market Analysis, Growth Forecasts & Competitive Landscape (2019-2033)
This comprehensive report provides a detailed analysis of the Asia-Pacific (APAC) commercial aircraft industry, offering in-depth insights into market dynamics, growth drivers, competitive landscape, and future outlook. The study period covers 2019-2033, with 2025 as the base and estimated year, and a forecast period of 2025-2033. The report utilizes a robust methodology, incorporating both historical data (2019-2024) and future projections, to provide actionable intelligence for industry stakeholders. The market is segmented by aircraft type (narrow-body, wide-body, regional), engine type (turbofan, turboprop), and application (passenger, freighter). Key players like Boeing, Airbus, Commercial Aircraft Corporation of China Ltd., Embraer, Mitsubishi Heavy Industries Ltd., Rostec, and AT are analyzed for their market share, strategies, and competitive advantages.
APAC Commercial Aircraft Industry Market Concentration & Innovation
The APAC commercial aircraft market exhibits a moderately concentrated structure, dominated by global giants like Boeing and Airbus, but with the increasing influence of Commercial Aircraft Corporation of China Ltd (COMAC). Market share analysis reveals Boeing and Airbus hold approximately xx% and xx%, respectively, in 2025, while COMAC's share is projected to reach xx% by 2033, driven by its C919 program. Innovation is fueled by the need for fuel efficiency, technological advancements (like advanced materials and AI-powered systems), and stringent environmental regulations. Regulatory frameworks, including those concerning emissions and safety, significantly impact industry players. The substitution of older aircraft with newer, more fuel-efficient models is a major trend. End-user trends, like the preference for larger aircraft and enhanced passenger experience, further shape industry developments. M&A activities have been relatively subdued in recent years, with total deal values estimated at $xx Million in 2024, although a rise is expected as companies seek to consolidate and leverage technological advances.
- Market Share (2025): Boeing – xx%, Airbus – xx%, COMAC – xx%, Others – xx%
- M&A Deal Value (2024): $xx Million
APAC Commercial Aircraft Industry Industry Trends & Insights
The APAC commercial aircraft market is experiencing robust growth, primarily driven by the region's expanding middle class, rising air travel demand, and government investments in aviation infrastructure. The CAGR for the forecast period (2025-2033) is projected to be xx%, exceeding the global average. Technological disruptions, particularly in areas like sustainable aviation fuels (SAFs) and electric propulsion, are reshaping the landscape. Consumer preferences are shifting towards enhanced passenger comfort, personalized services, and environmentally friendly aircraft. Competitive dynamics are characterized by intense rivalry between established players and the emergence of new entrants like COMAC, leading to price competition and innovation. Market penetration of narrow-body aircraft remains high, exceeding xx%, driven by their cost-effectiveness and suitability for short-to-medium haul flights. The market penetration of wide-body and regional aircraft is significantly lower, but will witness growth with the continued infrastructure development.
Dominant Markets & Segments in APAC Commercial Aircraft Industry
China is the dominant market in the APAC region, followed by India and other Southeast Asian countries. This dominance is largely attributed to robust economic growth, rapid urbanization, and substantial investments in airport infrastructure.
- By Aircraft Type:
- Narrow-body Aircraft: Dominates the market due to high demand for short-to-medium haul flights. Key drivers include cost-effectiveness and high passenger capacity.
- Wide-body Aircraft: Growth is driven by increasing long-haul travel demand and the expansion of airline hubs.
- Regional Aircraft: Demand is fueled by the growth of regional air connectivity and the development of secondary airports.
- By Engine Type:
- Turbofan: The prevalent engine type, due to high fuel efficiency and superior performance.
- Turboprop: Used mainly in regional aircraft, offering cost-effectiveness for shorter routes.
- By Application:
- Passenger Aircraft: Forms the largest segment, driven by the exponential growth in air passenger traffic.
- Freighter Aircraft: Growth is driven by the expansion of e-commerce and global trade. The impact of global supply chain disruptions is significant in this segment.
The growth of each segment is intertwined with factors such as government policies supporting aviation, economic growth, and the development of supporting infrastructure.
APAP Commercial Aircraft Industry Product Developments
Recent product innovations focus on enhancing fuel efficiency, improving passenger experience, and incorporating advanced technologies. Manufacturers are investing heavily in lightweight materials, advanced aerodynamics, and more efficient engines to reduce operating costs and environmental impact. The integration of advanced avionics systems and in-flight entertainment enhances the passenger experience, while advancements in manufacturing processes lead to quicker turnaround times and reduce production costs. This aligns well with the market's demand for more sustainable, efficient and comfortable air travel.
Report Scope & Segmentation Analysis
This report offers a comprehensive segmentation analysis of the APAC commercial aircraft market based on aircraft type, engine type, and application. Each segment's growth projections, market size, and competitive dynamics are assessed in detail. Growth projections vary significantly across segments: narrow-body aircraft are expected to see robust growth, while wide-body aircraft will witness a more moderate expansion, contingent on global economic conditions. Regional aircraft are expected to experience a steady growth, mainly driven by improved connectivity across APAC. The market size for each segment is expressed in Million USD, reflecting current and projected values. Competitive dynamics within each segment differ based on technological capabilities, pricing strategies, and market share.
Key Drivers of APAC Commercial Aircraft Industry Growth
Several factors contribute to the APAC commercial aircraft industry's robust growth trajectory. Rapid economic expansion in many APAC nations fuels increased disposable income, driving air travel demand. Government initiatives to improve aviation infrastructure, including airport expansions and improved air traffic management systems, are instrumental in facilitating increased flight operations. Furthermore, the burgeoning middle class in APAC is a significant contributor to the market’s growth, leading to increased demand for affordable and convenient air travel.
Challenges in the APAC Commercial Aircraft Industry Sector
The APAC commercial aircraft industry faces several challenges. Supply chain disruptions, particularly concerning critical components and materials, can significantly impact production schedules and lead to cost overruns. Stringent environmental regulations necessitate investment in cleaner technologies and sustainable aviation fuels, adding to operational expenses. Intense competition, particularly from Chinese manufacturers, puts pressure on pricing and margins. The impact of these challenges can lead to project delays, increased costs, and diminished profitability.
Emerging Opportunities in APAC Commercial Aircraft Industry
The APAC commercial aircraft industry presents significant opportunities. The growth of low-cost carriers and regional airlines opens up new markets for smaller, more fuel-efficient aircraft. The increasing adoption of sustainable aviation fuels and the development of electric or hybrid-electric propulsion systems present attractive prospects. Furthermore, the expansion of air travel in secondary cities and emerging markets offers significant growth potential.
Leading Players in the APAC Commercial Aircraft Industry Market
- Embraer
- Airbus
- Boeing
- MITSUBISHI HEAVY INDUSTRIES Ltd
- Commercial Aircraft Corporation of China Ltd
- Rostec
- AT
Key Developments in APAC Commercial Aircraft Industry Industry
- 2022-Q4: COMAC delivers first C919 aircraft to China Eastern Airlines.
- 2023-Q1: Airbus announces significant order from an APAC airline for A320neo family aircraft.
- 2023-Q3: Boeing secures large order for 737 MAX aircraft from a major APAC carrier.
- 2024-Q2: Significant investment in sustainable aviation fuel infrastructure announced by a regional government.
Strategic Outlook for APAC Commercial Aircraft Industry Market
The APAC commercial aircraft market is poised for sustained growth over the next decade. Continued economic expansion, rising air travel demand, and infrastructural development will be key catalysts. However, successfully navigating challenges like supply chain disruptions and environmental regulations will be crucial for sustained success. Companies that prioritize innovation, sustainability, and customer experience are best positioned to capitalize on the immense opportunities presented by this dynamic market.
APAC Commercial Aircraft Industry Segmentation
-
1. Engine Type
- 1.1. Turbofan
- 1.2. Turboprop
-
2. Application
- 2.1. Passenger Aircraft
- 2.2. Freighter
-
3. Geography
- 3.1. India
- 3.2. China
- 3.3. Japan
- 3.4. South Korea
- 3.5. Australia
- 3.6. Rest of Asia-Pacific
APAC Commercial Aircraft Industry Segmentation By Geography
- 1. India
- 2. China
- 3. Japan
- 4. South Korea
- 5. Australia
- 6. Rest of Asia Pacific
APAC Commercial Aircraft Industry Regional Market Share
Geographic Coverage of APAC Commercial Aircraft Industry
APAC Commercial Aircraft Industry REPORT HIGHLIGHTS
| Aspects | Details |
|---|---|
| Study Period | 2020-2034 |
| Base Year | 2025 |
| Estimated Year | 2026 |
| Forecast Period | 2026-2034 |
| Historical Period | 2020-2025 |
| Growth Rate | CAGR of 13.5% from 2020-2034 |
| Segmentation |
|
Table of Contents
- 1. Introduction
- 1.1. Research Scope
- 1.2. Market Segmentation
- 1.3. Research Methodology
- 1.4. Definitions and Assumptions
- 2. Executive Summary
- 2.1. Introduction
- 3. Market Dynamics
- 3.1. Introduction
- 3.2. Market Drivers
- 3.3. Market Restrains
- 3.4. Market Trends
- 3.4.1. The Revitalization in Aircraft Orders and Deliveries is Driving the Market
- 4. Market Factor Analysis
- 4.1. Porters Five Forces
- 4.2. Supply/Value Chain
- 4.3. PESTEL analysis
- 4.4. Market Entropy
- 4.5. Patent/Trademark Analysis
- 5. Global APAC Commercial Aircraft Industry Analysis, Insights and Forecast, 2020-2032
- 5.1. Market Analysis, Insights and Forecast - by Engine Type
- 5.1.1. Turbofan
- 5.1.2. Turboprop
- 5.2. Market Analysis, Insights and Forecast - by Application
- 5.2.1. Passenger Aircraft
- 5.2.2. Freighter
- 5.3. Market Analysis, Insights and Forecast - by Geography
- 5.3.1. India
- 5.3.2. China
- 5.3.3. Japan
- 5.3.4. South Korea
- 5.3.5. Australia
- 5.3.6. Rest of Asia-Pacific
- 5.4. Market Analysis, Insights and Forecast - by Region
- 5.4.1. India
- 5.4.2. China
- 5.4.3. Japan
- 5.4.4. South Korea
- 5.4.5. Australia
- 5.4.6. Rest of Asia Pacific
- 5.1. Market Analysis, Insights and Forecast - by Engine Type
- 6. India APAC Commercial Aircraft Industry Analysis, Insights and Forecast, 2020-2032
- 6.1. Market Analysis, Insights and Forecast - by Engine Type
- 6.1.1. Turbofan
- 6.1.2. Turboprop
- 6.2. Market Analysis, Insights and Forecast - by Application
- 6.2.1. Passenger Aircraft
- 6.2.2. Freighter
- 6.3. Market Analysis, Insights and Forecast - by Geography
- 6.3.1. India
- 6.3.2. China
- 6.3.3. Japan
- 6.3.4. South Korea
- 6.3.5. Australia
- 6.3.6. Rest of Asia-Pacific
- 6.1. Market Analysis, Insights and Forecast - by Engine Type
- 7. China APAC Commercial Aircraft Industry Analysis, Insights and Forecast, 2020-2032
- 7.1. Market Analysis, Insights and Forecast - by Engine Type
- 7.1.1. Turbofan
- 7.1.2. Turboprop
- 7.2. Market Analysis, Insights and Forecast - by Application
- 7.2.1. Passenger Aircraft
- 7.2.2. Freighter
- 7.3. Market Analysis, Insights and Forecast - by Geography
- 7.3.1. India
- 7.3.2. China
- 7.3.3. Japan
- 7.3.4. South Korea
- 7.3.5. Australia
- 7.3.6. Rest of Asia-Pacific
- 7.1. Market Analysis, Insights and Forecast - by Engine Type
- 8. Japan APAC Commercial Aircraft Industry Analysis, Insights and Forecast, 2020-2032
- 8.1. Market Analysis, Insights and Forecast - by Engine Type
- 8.1.1. Turbofan
- 8.1.2. Turboprop
- 8.2. Market Analysis, Insights and Forecast - by Application
- 8.2.1. Passenger Aircraft
- 8.2.2. Freighter
- 8.3. Market Analysis, Insights and Forecast - by Geography
- 8.3.1. India
- 8.3.2. China
- 8.3.3. Japan
- 8.3.4. South Korea
- 8.3.5. Australia
- 8.3.6. Rest of Asia-Pacific
- 8.1. Market Analysis, Insights and Forecast - by Engine Type
- 9. South Korea APAC Commercial Aircraft Industry Analysis, Insights and Forecast, 2020-2032
- 9.1. Market Analysis, Insights and Forecast - by Engine Type
- 9.1.1. Turbofan
- 9.1.2. Turboprop
- 9.2. Market Analysis, Insights and Forecast - by Application
- 9.2.1. Passenger Aircraft
- 9.2.2. Freighter
- 9.3. Market Analysis, Insights and Forecast - by Geography
- 9.3.1. India
- 9.3.2. China
- 9.3.3. Japan
- 9.3.4. South Korea
- 9.3.5. Australia
- 9.3.6. Rest of Asia-Pacific
- 9.1. Market Analysis, Insights and Forecast - by Engine Type
- 10. Australia APAC Commercial Aircraft Industry Analysis, Insights and Forecast, 2020-2032
- 10.1. Market Analysis, Insights and Forecast - by Engine Type
- 10.1.1. Turbofan
- 10.1.2. Turboprop
- 10.2. Market Analysis, Insights and Forecast - by Application
- 10.2.1. Passenger Aircraft
- 10.2.2. Freighter
- 10.3. Market Analysis, Insights and Forecast - by Geography
- 10.3.1. India
- 10.3.2. China
- 10.3.3. Japan
- 10.3.4. South Korea
- 10.3.5. Australia
- 10.3.6. Rest of Asia-Pacific
- 10.1. Market Analysis, Insights and Forecast - by Engine Type
- 11. Rest of Asia Pacific APAC Commercial Aircraft Industry Analysis, Insights and Forecast, 2020-2032
- 11.1. Market Analysis, Insights and Forecast - by Engine Type
- 11.1.1. Turbofan
- 11.1.2. Turboprop
- 11.2. Market Analysis, Insights and Forecast - by Application
- 11.2.1. Passenger Aircraft
- 11.2.2. Freighter
- 11.3. Market Analysis, Insights and Forecast - by Geography
- 11.3.1. India
- 11.3.2. China
- 11.3.3. Japan
- 11.3.4. South Korea
- 11.3.5. Australia
- 11.3.6. Rest of Asia-Pacific
- 11.1. Market Analysis, Insights and Forecast - by Engine Type
- 12. Competitive Analysis
- 12.1. Global Market Share Analysis 2025
- 12.2. Company Profiles
- 12.2.1 Commercial Aircraft Corporation of China Ltd
- 12.2.1.1. Overview
- 12.2.1.2. Products
- 12.2.1.3. SWOT Analysis
- 12.2.1.4. Recent Developments
- 12.2.1.5. Financials (Based on Availability)
- 12.2.2 Airbus
- 12.2.2.1. Overview
- 12.2.2.2. Products
- 12.2.2.3. SWOT Analysis
- 12.2.2.4. Recent Developments
- 12.2.2.5. Financials (Based on Availability)
- 12.2.3 AT
- 12.2.3.1. Overview
- 12.2.3.2. Products
- 12.2.3.3. SWOT Analysis
- 12.2.3.4. Recent Developments
- 12.2.3.5. Financials (Based on Availability)
- 12.2.4 Rostec
- 12.2.4.1. Overview
- 12.2.4.2. Products
- 12.2.4.3. SWOT Analysis
- 12.2.4.4. Recent Developments
- 12.2.4.5. Financials (Based on Availability)
- 12.2.5 Embraer
- 12.2.5.1. Overview
- 12.2.5.2. Products
- 12.2.5.3. SWOT Analysis
- 12.2.5.4. Recent Developments
- 12.2.5.5. Financials (Based on Availability)
- 12.2.6 MITSUBISHI HEAVY INDUSTRIES Ltd
- 12.2.6.1. Overview
- 12.2.6.2. Products
- 12.2.6.3. SWOT Analysis
- 12.2.6.4. Recent Developments
- 12.2.6.5. Financials (Based on Availability)
- 12.2.7 Boeing
- 12.2.7.1. Overview
- 12.2.7.2. Products
- 12.2.7.3. SWOT Analysis
- 12.2.7.4. Recent Developments
- 12.2.7.5. Financials (Based on Availability)
- 12.2.1 Commercial Aircraft Corporation of China Ltd
List of Figures
- Figure 1: Global APAC Commercial Aircraft Industry Revenue Breakdown (undefined, %) by Region 2025 & 2033
- Figure 2: India APAC Commercial Aircraft Industry Revenue (undefined), by Engine Type 2025 & 2033
- Figure 3: India APAC Commercial Aircraft Industry Revenue Share (%), by Engine Type 2025 & 2033
- Figure 4: India APAC Commercial Aircraft Industry Revenue (undefined), by Application 2025 & 2033
- Figure 5: India APAC Commercial Aircraft Industry Revenue Share (%), by Application 2025 & 2033
- Figure 6: India APAC Commercial Aircraft Industry Revenue (undefined), by Geography 2025 & 2033
- Figure 7: India APAC Commercial Aircraft Industry Revenue Share (%), by Geography 2025 & 2033
- Figure 8: India APAC Commercial Aircraft Industry Revenue (undefined), by Country 2025 & 2033
- Figure 9: India APAC Commercial Aircraft Industry Revenue Share (%), by Country 2025 & 2033
- Figure 10: China APAC Commercial Aircraft Industry Revenue (undefined), by Engine Type 2025 & 2033
- Figure 11: China APAC Commercial Aircraft Industry Revenue Share (%), by Engine Type 2025 & 2033
- Figure 12: China APAC Commercial Aircraft Industry Revenue (undefined), by Application 2025 & 2033
- Figure 13: China APAC Commercial Aircraft Industry Revenue Share (%), by Application 2025 & 2033
- Figure 14: China APAC Commercial Aircraft Industry Revenue (undefined), by Geography 2025 & 2033
- Figure 15: China APAC Commercial Aircraft Industry Revenue Share (%), by Geography 2025 & 2033
- Figure 16: China APAC Commercial Aircraft Industry Revenue (undefined), by Country 2025 & 2033
- Figure 17: China APAC Commercial Aircraft Industry Revenue Share (%), by Country 2025 & 2033
- Figure 18: Japan APAC Commercial Aircraft Industry Revenue (undefined), by Engine Type 2025 & 2033
- Figure 19: Japan APAC Commercial Aircraft Industry Revenue Share (%), by Engine Type 2025 & 2033
- Figure 20: Japan APAC Commercial Aircraft Industry Revenue (undefined), by Application 2025 & 2033
- Figure 21: Japan APAC Commercial Aircraft Industry Revenue Share (%), by Application 2025 & 2033
- Figure 22: Japan APAC Commercial Aircraft Industry Revenue (undefined), by Geography 2025 & 2033
- Figure 23: Japan APAC Commercial Aircraft Industry Revenue Share (%), by Geography 2025 & 2033
- Figure 24: Japan APAC Commercial Aircraft Industry Revenue (undefined), by Country 2025 & 2033
- Figure 25: Japan APAC Commercial Aircraft Industry Revenue Share (%), by Country 2025 & 2033
- Figure 26: South Korea APAC Commercial Aircraft Industry Revenue (undefined), by Engine Type 2025 & 2033
- Figure 27: South Korea APAC Commercial Aircraft Industry Revenue Share (%), by Engine Type 2025 & 2033
- Figure 28: South Korea APAC Commercial Aircraft Industry Revenue (undefined), by Application 2025 & 2033
- Figure 29: South Korea APAC Commercial Aircraft Industry Revenue Share (%), by Application 2025 & 2033
- Figure 30: South Korea APAC Commercial Aircraft Industry Revenue (undefined), by Geography 2025 & 2033
- Figure 31: South Korea APAC Commercial Aircraft Industry Revenue Share (%), by Geography 2025 & 2033
- Figure 32: South Korea APAC Commercial Aircraft Industry Revenue (undefined), by Country 2025 & 2033
- Figure 33: South Korea APAC Commercial Aircraft Industry Revenue Share (%), by Country 2025 & 2033
- Figure 34: Australia APAC Commercial Aircraft Industry Revenue (undefined), by Engine Type 2025 & 2033
- Figure 35: Australia APAC Commercial Aircraft Industry Revenue Share (%), by Engine Type 2025 & 2033
- Figure 36: Australia APAC Commercial Aircraft Industry Revenue (undefined), by Application 2025 & 2033
- Figure 37: Australia APAC Commercial Aircraft Industry Revenue Share (%), by Application 2025 & 2033
- Figure 38: Australia APAC Commercial Aircraft Industry Revenue (undefined), by Geography 2025 & 2033
- Figure 39: Australia APAC Commercial Aircraft Industry Revenue Share (%), by Geography 2025 & 2033
- Figure 40: Australia APAC Commercial Aircraft Industry Revenue (undefined), by Country 2025 & 2033
- Figure 41: Australia APAC Commercial Aircraft Industry Revenue Share (%), by Country 2025 & 2033
- Figure 42: Rest of Asia Pacific APAC Commercial Aircraft Industry Revenue (undefined), by Engine Type 2025 & 2033
- Figure 43: Rest of Asia Pacific APAC Commercial Aircraft Industry Revenue Share (%), by Engine Type 2025 & 2033
- Figure 44: Rest of Asia Pacific APAC Commercial Aircraft Industry Revenue (undefined), by Application 2025 & 2033
- Figure 45: Rest of Asia Pacific APAC Commercial Aircraft Industry Revenue Share (%), by Application 2025 & 2033
- Figure 46: Rest of Asia Pacific APAC Commercial Aircraft Industry Revenue (undefined), by Geography 2025 & 2033
- Figure 47: Rest of Asia Pacific APAC Commercial Aircraft Industry Revenue Share (%), by Geography 2025 & 2033
- Figure 48: Rest of Asia Pacific APAC Commercial Aircraft Industry Revenue (undefined), by Country 2025 & 2033
- Figure 49: Rest of Asia Pacific APAC Commercial Aircraft Industry Revenue Share (%), by Country 2025 & 2033
List of Tables
- Table 1: Global APAC Commercial Aircraft Industry Revenue undefined Forecast, by Engine Type 2020 & 2033
- Table 2: Global APAC Commercial Aircraft Industry Revenue undefined Forecast, by Application 2020 & 2033
- Table 3: Global APAC Commercial Aircraft Industry Revenue undefined Forecast, by Geography 2020 & 2033
- Table 4: Global APAC Commercial Aircraft Industry Revenue undefined Forecast, by Region 2020 & 2033
- Table 5: Global APAC Commercial Aircraft Industry Revenue undefined Forecast, by Engine Type 2020 & 2033
- Table 6: Global APAC Commercial Aircraft Industry Revenue undefined Forecast, by Application 2020 & 2033
- Table 7: Global APAC Commercial Aircraft Industry Revenue undefined Forecast, by Geography 2020 & 2033
- Table 8: Global APAC Commercial Aircraft Industry Revenue undefined Forecast, by Country 2020 & 2033
- Table 9: Global APAC Commercial Aircraft Industry Revenue undefined Forecast, by Engine Type 2020 & 2033
- Table 10: Global APAC Commercial Aircraft Industry Revenue undefined Forecast, by Application 2020 & 2033
- Table 11: Global APAC Commercial Aircraft Industry Revenue undefined Forecast, by Geography 2020 & 2033
- Table 12: Global APAC Commercial Aircraft Industry Revenue undefined Forecast, by Country 2020 & 2033
- Table 13: Global APAC Commercial Aircraft Industry Revenue undefined Forecast, by Engine Type 2020 & 2033
- Table 14: Global APAC Commercial Aircraft Industry Revenue undefined Forecast, by Application 2020 & 2033
- Table 15: Global APAC Commercial Aircraft Industry Revenue undefined Forecast, by Geography 2020 & 2033
- Table 16: Global APAC Commercial Aircraft Industry Revenue undefined Forecast, by Country 2020 & 2033
- Table 17: Global APAC Commercial Aircraft Industry Revenue undefined Forecast, by Engine Type 2020 & 2033
- Table 18: Global APAC Commercial Aircraft Industry Revenue undefined Forecast, by Application 2020 & 2033
- Table 19: Global APAC Commercial Aircraft Industry Revenue undefined Forecast, by Geography 2020 & 2033
- Table 20: Global APAC Commercial Aircraft Industry Revenue undefined Forecast, by Country 2020 & 2033
- Table 21: Global APAC Commercial Aircraft Industry Revenue undefined Forecast, by Engine Type 2020 & 2033
- Table 22: Global APAC Commercial Aircraft Industry Revenue undefined Forecast, by Application 2020 & 2033
- Table 23: Global APAC Commercial Aircraft Industry Revenue undefined Forecast, by Geography 2020 & 2033
- Table 24: Global APAC Commercial Aircraft Industry Revenue undefined Forecast, by Country 2020 & 2033
- Table 25: Global APAC Commercial Aircraft Industry Revenue undefined Forecast, by Engine Type 2020 & 2033
- Table 26: Global APAC Commercial Aircraft Industry Revenue undefined Forecast, by Application 2020 & 2033
- Table 27: Global APAC Commercial Aircraft Industry Revenue undefined Forecast, by Geography 2020 & 2033
- Table 28: Global APAC Commercial Aircraft Industry Revenue undefined Forecast, by Country 2020 & 2033
Frequently Asked Questions
1. What is the projected Compound Annual Growth Rate (CAGR) of the APAC Commercial Aircraft Industry?
The projected CAGR is approximately 13.5%.
2. Which companies are prominent players in the APAC Commercial Aircraft Industry?
Key companies in the market include Commercial Aircraft Corporation of China Ltd, Airbus, AT, Rostec, Embraer, MITSUBISHI HEAVY INDUSTRIES Ltd, Boeing.
3. What are the main segments of the APAC Commercial Aircraft Industry?
The market segments include Engine Type, Application, Geography.
4. Can you provide details about the market size?
The market size is estimated to be USD XXX N/A as of 2022.
5. What are some drivers contributing to market growth?
N/A
6. What are the notable trends driving market growth?
The Revitalization in Aircraft Orders and Deliveries is Driving the Market.
7. Are there any restraints impacting market growth?
N/A
8. Can you provide examples of recent developments in the market?
N/A
9. What pricing options are available for accessing the report?
Pricing options include single-user, multi-user, and enterprise licenses priced at USD 4750, USD 5250, and USD 8750 respectively.
10. Is the market size provided in terms of value or volume?
The market size is provided in terms of value, measured in N/A.
11. Are there any specific market keywords associated with the report?
Yes, the market keyword associated with the report is "APAC Commercial Aircraft Industry," which aids in identifying and referencing the specific market segment covered.
12. How do I determine which pricing option suits my needs best?
The pricing options vary based on user requirements and access needs. Individual users may opt for single-user licenses, while businesses requiring broader access may choose multi-user or enterprise licenses for cost-effective access to the report.
13. Are there any additional resources or data provided in the APAC Commercial Aircraft Industry report?
While the report offers comprehensive insights, it's advisable to review the specific contents or supplementary materials provided to ascertain if additional resources or data are available.
14. How can I stay updated on further developments or reports in the APAC Commercial Aircraft Industry?
To stay informed about further developments, trends, and reports in the APAC Commercial Aircraft Industry, consider subscribing to industry newsletters, following relevant companies and organizations, or regularly checking reputable industry news sources and publications.
Methodology
Step 1 - Identification of Relevant Samples Size from Population Database


Step 2 - Approaches for Defining Global Market Size (Value, Volume* & Price*)

Note*: In applicable scenarios
Step 3 - Data Sources
Primary Research
- Web Analytics
- Survey Reports
- Research Institute
- Latest Research Reports
- Opinion Leaders
Secondary Research
- Annual Reports
- White Paper
- Latest Press Release
- Industry Association
- Paid Database
- Investor Presentations

Step 4 - Data Triangulation
Involves using different sources of information in order to increase the validity of a study
These sources are likely to be stakeholders in a program - participants, other researchers, program staff, other community members, and so on.
Then we put all data in single framework & apply various statistical tools to find out the dynamic on the market.
During the analysis stage, feedback from the stakeholder groups would be compared to determine areas of agreement as well as areas of divergence