
Key Insights
The global caprolactam market, valued at approximately $XX million in 2025, is projected to experience robust growth, exhibiting a compound annual growth rate (CAGR) exceeding 3.00% from 2025 to 2033. This expansion is driven by several key factors. The increasing demand for nylon 6 resins and fibers in diverse applications, including automotive parts (e.g., dashboards, interior components), textiles (clothing, carpets), and engineering plastics, fuels market growth. Technological advancements leading to improved caprolactam production efficiency and the development of high-performance nylon 6 materials further contribute to the market's positive trajectory. Strong growth in developing economies, particularly in Asia-Pacific, especially China, fuels significant demand for caprolactam-based products. However, fluctuating raw material prices (phenol and cyclohexane) and environmental concerns regarding the production process pose potential challenges. The market is segmented by raw material, end product (nylon 6 resins, fibers, and others), application (engineering resins, industrial yarns, textiles, and others), and end-user industry (automotive, carpet, textile, and others). Major players like Sumitomo Chemical, BASF, and Toray Industries are key competitors, constantly innovating to maintain their market share.
The regional distribution of the caprolactam market reflects the global trends in industrialization and consumption. Asia-Pacific, led by China's substantial manufacturing base and burgeoning domestic demand, holds a significant market share. North America and Europe also contribute substantially, driven by established automotive and textile industries. However, emerging economies in South America and the Middle East & Africa present promising, albeit smaller, growth opportunities. The competitive landscape is characterized by both established multinational corporations and regional players. Strategic collaborations, mergers and acquisitions, and capacity expansions are expected to shape the market's competitive dynamics in the forecast period. Future growth will likely be influenced by advancements in sustainable production practices, stricter environmental regulations, and the continuous development of high-performance nylon 6 materials tailored to specific applications. A focus on circular economy principles and recycled nylon 6 will also be increasingly important factors in the coming decade.
Caprolactam Industry: A Comprehensive Market Report (2019-2033)
This comprehensive report provides an in-depth analysis of the global caprolactam industry, covering market size, growth drivers, key players, and future trends. The study period spans from 2019 to 2033, with 2025 serving as the base and estimated year. This report is essential for industry stakeholders, investors, and strategic decision-makers seeking actionable insights into this dynamic market.
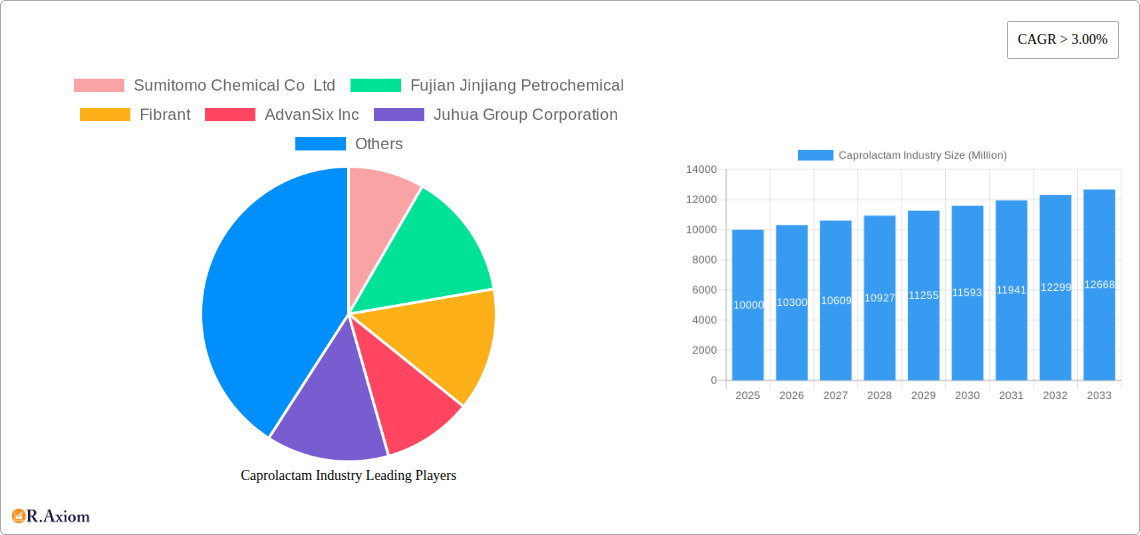
Caprolactam Industry Market Concentration & Innovation
The global caprolactam market exhibits a moderately concentrated structure, with a few major players holding significant market share. While precise market share figures for each company are not publicly available and vary based on the year and specific market segment, players such as BASF SE, Sumitomo Chemical Co Ltd, and Domo Chemicals hold substantial influence. However, the presence of several regional players creates a competitive landscape.
Innovation in the caprolactam industry is driven by several factors:
- Sustainable production methods: Growing environmental concerns are pushing companies to adopt more efficient and eco-friendly manufacturing processes, reducing waste and carbon footprint.
- Product diversification: Companies are constantly developing new grades of caprolactam and exploring applications beyond traditional Nylon 6, leading to product diversification.
- Technological advancements: Improvements in polymerization processes, catalyst technology, and process optimization enhance efficiency and reduce production costs.
Regulatory frameworks, while aiming for sustainable practices, can sometimes present challenges. Product substitutes, such as other polyamides or bio-based polymers, pose some competitive threat. M&A activity in the industry has been moderate in recent years, with deal values varying widely depending on the size and scope of the transaction. A few major acquisitions and joint ventures have reshaped the market landscape in the past, though detailed value figures are not publicly accessible in all cases for this specific sector. End-user trends, particularly shifting demand within the automotive and textile industries, significantly influence caprolactam consumption patterns.
Caprolactam Industry Industry Trends & Insights
The global caprolactam market is projected to experience a Compound Annual Growth Rate (CAGR) of xx% during the forecast period (2025-2033). Several factors drive this growth:
The increasing demand for Nylon 6 fibers and resins in various applications, particularly in the automotive and textile industries, fuels substantial growth. Technological advancements like improved catalyst systems and more efficient production processes are contributing to cost reductions and boosting output. Consumer preference for high-performance, durable materials further supports market expansion. However, the market is sensitive to fluctuations in raw material prices, particularly phenol and cyclohexane. Competitive dynamics are shaped by factors like production capacity expansions, product differentiation, and pricing strategies. Market penetration of caprolactam in niche applications, such as engineering plastics, also adds to growth.

Dominant Markets & Segments in Caprolactam Industry
Asia Pacific, particularly China, is a dominant region in the caprolactam market. This dominance is primarily attributed to several key factors:
- Large and growing textile industry: China's massive textile sector serves as a major consumer of caprolactam-based Nylon 6 fibers.
- Automotive sector expansion: The burgeoning automotive industry in Asia Pacific fuels significant demand for engineering plastics made from caprolactam.
- Favorable government policies: Supportive economic policies and infrastructure development facilitate the growth of the chemical industry in the region.
Among the segments, Nylon 6 fibers dominate the end-product market due to their widespread use in textiles and carpets. Cyclohexane is the most commonly used raw material, contributing to the largest segment share. The automotive and textile industries are the largest end-user segments.
Caprolactam Industry Product Developments
Recent developments in the caprolactam industry focus on improving product quality, enhancing process efficiency, and developing sustainable production methods. Innovations include the use of advanced catalysts to improve yield and reduce waste, the development of high-performance Nylon 6 grades with specialized properties, and the exploration of bio-based raw materials for caprolactam synthesis. These advancements address market demands for more sustainable, higher-performance materials, improving product market fit and enhancing competitive advantages.
Report Scope & Segmentation Analysis
This report segments the caprolactam market based on raw materials (Phenol and Cyclohexane), end products (Nylon 6 Resins, Nylon 6 Fibers, Other End Products), applications (Engineering Resins and Films, Industrial Yarns, Textiles and Carpets, Other Applications), and end-user industries (Automotive, Carpet, Textile, Other End-user Industries). Growth projections for each segment vary, with Nylon 6 fibers and the Asia-Pacific region expected to demonstrate strong growth. Market size for each segment is detailed in the full report. Competitive dynamics are analyzed within each segment, highlighting key players and their market positions.
Key Drivers of Caprolactam Industry Growth
Several factors drive the growth of the caprolactam industry. Firstly, strong demand from the automotive sector, driven by the increasing preference for lightweight and high-strength materials, fuels considerable growth. Secondly, economic growth in emerging markets boosts consumption in textiles and other industries. Thirdly, technological advancements lead to cost-effective and sustainable manufacturing methods.
Challenges in the Caprolactam Industry Sector
The caprolactam industry faces several challenges, including volatility in raw material prices, which directly impacts production costs and profitability. Stringent environmental regulations impose compliance costs and necessitate the adoption of cleaner technologies. Intense competition from other polymers and bio-based alternatives also puts pressure on the industry's pricing and margins.
Emerging Opportunities in Caprolactam Industry
Emerging opportunities lie in developing specialized Nylon 6 grades for niche applications, such as high-performance engineering plastics and medical devices. Expansion into emerging markets and exploring bio-based or recycled raw materials to enhance sustainability are also promising avenues. The growing focus on circular economy practices will likely create further opportunities for the development and use of recycled caprolactam-based materials.
Leading Players in the Caprolactam Industry Market
- Sumitomo Chemical Co Ltd
- Fujian Jinjiang Petrochemical
- Fibrant
- AdvanSix Inc
- Juhua Group Corporation
- UBE Corporation
- Fertilisers And Chemicals Travancore Limited (FACT)
- Alpek S A B de CV
- Toray Industries Inc
- Domo Chemicals
- Capro Co
- China Petrochemical Development Corporation
- BASF SE
- Shandong Haili Chemical Industry Co Ltd
- Lanxess
- PJSC Kuibyshevazot
- Xuyang Group
- China Petroleum & Chemical Corporation (Sinopec)
Key Developments in Caprolactam Industry Industry
- September 2022: Xuyang Group expanded its caprolactam production capacity to 750,000 tons per year.
- April 2022: Sumitomo Chemical exited the caprolactam business by closing its production facilities.
- March 2022: Domo Chemicals increased its caprolactam production capacity to 500,000 tons/year.
Strategic Outlook for Caprolactam Industry Market
The caprolactam market is poised for continued growth, driven by expanding applications in various end-use sectors and ongoing technological advancements. The focus on sustainability and the development of bio-based alternatives will shape future market dynamics. Opportunities exist for companies to invest in capacity expansions, innovation, and sustainable practices to capitalize on the growing demand for caprolactam-based products.
Caprolactam Industry Segmentation
-
1. Raw Material
- 1.1. Phenol
- 1.2. Cyclohexane
-
2. End Product
- 2.1. Nylon 6 Resins
- 2.2. Nylon 6 Fibers
- 2.3. Other End Products
-
3. Application
- 3.1. Engineering Resins and Films
- 3.2. Industrial Yarns
- 3.3. Textiles and Carpets
- 3.4. Other Applications
-
4. End-user Industry
- 4.1. Automotive
- 4.2. Carpet
- 4.3. Textile
- 4.4. Other End-user Industries
Caprolactam Industry Segmentation By Geography
-
1. Asia Pacific
- 1.1. China
- 1.2. Japan
- 1.3. South Korea
- 1.4. Rest of Asia Pacific
-
2. North America
- 2.1. United States
- 2.2. Canada
- 2.3. Mexico
-
3. Europe
- 3.1. Germany
- 3.2. United Kingdom
- 3.3. France
- 3.4. Italy
- 3.5. Rest of Europe
-
4. South America
- 4.1. Brazil
- 4.2. Argentina
- 4.3. Rest of South America
-
5. Middle East and Africa
- 5.1. Saudi Arabia
- 5.2. South Africa
- 5.3. Rest of Middle East and Africa

Caprolactam Industry REPORT HIGHLIGHTS
| Aspects | Details |
|---|---|
| Study Period | 2019-2033 |
| Base Year | 2024 |
| Estimated Year | 2025 |
| Forecast Period | 2025-2033 |
| Historical Period | 2019-2024 |
| Growth Rate | CAGR of > 3.00% from 2019-2033 |
| Segmentation |
|
Table of Contents
- 1. Introduction
- 1.1. Research Scope
- 1.2. Market Segmentation
- 1.3. Research Methodology
- 1.4. Definitions and Assumptions
- 2. Executive Summary
- 2.1. Introduction
- 3. Market Dynamics
- 3.1. Introduction
- 3.2. Market Drivers
- 3.2.1. Growing Production Capacity of Nylon 6
- 3.3. Market Restrains
- 3.3.1. Toxicity of caprolactam; Presence of substitute products for Nylon-6
- 3.4. Market Trends
- 3.4.1. Increasing Demand for Textile and Carpets
- 4. Market Factor Analysis
- 4.1. Porters Five Forces
- 4.2. Supply/Value Chain
- 4.3. PESTEL analysis
- 4.4. Market Entropy
- 4.5. Patent/Trademark Analysis
- 5. Global Caprolactam Industry Analysis, Insights and Forecast, 2019-2031
- 5.1. Market Analysis, Insights and Forecast - by Raw Material
- 5.1.1. Phenol
- 5.1.2. Cyclohexane
- 5.2. Market Analysis, Insights and Forecast - by End Product
- 5.2.1. Nylon 6 Resins
- 5.2.2. Nylon 6 Fibers
- 5.2.3. Other End Products
- 5.3. Market Analysis, Insights and Forecast - by Application
- 5.3.1. Engineering Resins and Films
- 5.3.2. Industrial Yarns
- 5.3.3. Textiles and Carpets
- 5.3.4. Other Applications
- 5.4. Market Analysis, Insights and Forecast - by End-user Industry
- 5.4.1. Automotive
- 5.4.2. Carpet
- 5.4.3. Textile
- 5.4.4. Other End-user Industries
- 5.5. Market Analysis, Insights and Forecast - by Region
- 5.5.1. Asia Pacific
- 5.5.2. North America
- 5.5.3. Europe
- 5.5.4. South America
- 5.5.5. Middle East and Africa
- 5.1. Market Analysis, Insights and Forecast - by Raw Material
- 6. Asia Pacific Caprolactam Industry Analysis, Insights and Forecast, 2019-2031
- 6.1. Market Analysis, Insights and Forecast - by Raw Material
- 6.1.1. Phenol
- 6.1.2. Cyclohexane
- 6.2. Market Analysis, Insights and Forecast - by End Product
- 6.2.1. Nylon 6 Resins
- 6.2.2. Nylon 6 Fibers
- 6.2.3. Other End Products
- 6.3. Market Analysis, Insights and Forecast - by Application
- 6.3.1. Engineering Resins and Films
- 6.3.2. Industrial Yarns
- 6.3.3. Textiles and Carpets
- 6.3.4. Other Applications
- 6.4. Market Analysis, Insights and Forecast - by End-user Industry
- 6.4.1. Automotive
- 6.4.2. Carpet
- 6.4.3. Textile
- 6.4.4. Other End-user Industries
- 6.1. Market Analysis, Insights and Forecast - by Raw Material
- 7. North America Caprolactam Industry Analysis, Insights and Forecast, 2019-2031
- 7.1. Market Analysis, Insights and Forecast - by Raw Material
- 7.1.1. Phenol
- 7.1.2. Cyclohexane
- 7.2. Market Analysis, Insights and Forecast - by End Product
- 7.2.1. Nylon 6 Resins
- 7.2.2. Nylon 6 Fibers
- 7.2.3. Other End Products
- 7.3. Market Analysis, Insights and Forecast - by Application
- 7.3.1. Engineering Resins and Films
- 7.3.2. Industrial Yarns
- 7.3.3. Textiles and Carpets
- 7.3.4. Other Applications
- 7.4. Market Analysis, Insights and Forecast - by End-user Industry
- 7.4.1. Automotive
- 7.4.2. Carpet
- 7.4.3. Textile
- 7.4.4. Other End-user Industries
- 7.1. Market Analysis, Insights and Forecast - by Raw Material
- 8. Europe Caprolactam Industry Analysis, Insights and Forecast, 2019-2031
- 8.1. Market Analysis, Insights and Forecast - by Raw Material
- 8.1.1. Phenol
- 8.1.2. Cyclohexane
- 8.2. Market Analysis, Insights and Forecast - by End Product
- 8.2.1. Nylon 6 Resins
- 8.2.2. Nylon 6 Fibers
- 8.2.3. Other End Products
- 8.3. Market Analysis, Insights and Forecast - by Application
- 8.3.1. Engineering Resins and Films
- 8.3.2. Industrial Yarns
- 8.3.3. Textiles and Carpets
- 8.3.4. Other Applications
- 8.4. Market Analysis, Insights and Forecast - by End-user Industry
- 8.4.1. Automotive
- 8.4.2. Carpet
- 8.4.3. Textile
- 8.4.4. Other End-user Industries
- 8.1. Market Analysis, Insights and Forecast - by Raw Material
- 9. South America Caprolactam Industry Analysis, Insights and Forecast, 2019-2031
- 9.1. Market Analysis, Insights and Forecast - by Raw Material
- 9.1.1. Phenol
- 9.1.2. Cyclohexane
- 9.2. Market Analysis, Insights and Forecast - by End Product
- 9.2.1. Nylon 6 Resins
- 9.2.2. Nylon 6 Fibers
- 9.2.3. Other End Products
- 9.3. Market Analysis, Insights and Forecast - by Application
- 9.3.1. Engineering Resins and Films
- 9.3.2. Industrial Yarns
- 9.3.3. Textiles and Carpets
- 9.3.4. Other Applications
- 9.4. Market Analysis, Insights and Forecast - by End-user Industry
- 9.4.1. Automotive
- 9.4.2. Carpet
- 9.4.3. Textile
- 9.4.4. Other End-user Industries
- 9.1. Market Analysis, Insights and Forecast - by Raw Material
- 10. Middle East and Africa Caprolactam Industry Analysis, Insights and Forecast, 2019-2031
- 10.1. Market Analysis, Insights and Forecast - by Raw Material
- 10.1.1. Phenol
- 10.1.2. Cyclohexane
- 10.2. Market Analysis, Insights and Forecast - by End Product
- 10.2.1. Nylon 6 Resins
- 10.2.2. Nylon 6 Fibers
- 10.2.3. Other End Products
- 10.3. Market Analysis, Insights and Forecast - by Application
- 10.3.1. Engineering Resins and Films
- 10.3.2. Industrial Yarns
- 10.3.3. Textiles and Carpets
- 10.3.4. Other Applications
- 10.4. Market Analysis, Insights and Forecast - by End-user Industry
- 10.4.1. Automotive
- 10.4.2. Carpet
- 10.4.3. Textile
- 10.4.4. Other End-user Industries
- 10.1. Market Analysis, Insights and Forecast - by Raw Material
- 11. Asia Pacific Caprolactam Industry Analysis, Insights and Forecast, 2019-2031
- 11.1. Market Analysis, Insights and Forecast - By Country/Sub-region
- 11.1.1 China
- 11.1.2 Japan
- 11.1.3 South Korea
- 11.1.4 Rest of Asia Pacific
- 12. North America Caprolactam Industry Analysis, Insights and Forecast, 2019-2031
- 12.1. Market Analysis, Insights and Forecast - By Country/Sub-region
- 12.1.1 United States
- 12.1.2 Canada
- 12.1.3 Mexico
- 13. Europe Caprolactam Industry Analysis, Insights and Forecast, 2019-2031
- 13.1. Market Analysis, Insights and Forecast - By Country/Sub-region
- 13.1.1 Germany
- 13.1.2 United Kingdom
- 13.1.3 France
- 13.1.4 Italy
- 13.1.5 Rest of Europe
- 14. South America Caprolactam Industry Analysis, Insights and Forecast, 2019-2031
- 14.1. Market Analysis, Insights and Forecast - By Country/Sub-region
- 14.1.1 Brazil
- 14.1.2 Argentina
- 14.1.3 Rest of South America
- 15. Middle East and Africa Caprolactam Industry Analysis, Insights and Forecast, 2019-2031
- 15.1. Market Analysis, Insights and Forecast - By Country/Sub-region
- 15.1.1 Saudi Arabia
- 15.1.2 South Africa
- 15.1.3 Rest of Middle East and Africa
- 16. Competitive Analysis
- 16.1. Global Market Share Analysis 2024
- 16.2. Company Profiles
- 16.2.1 Sumitomo Chemical Co Ltd
- 16.2.1.1. Overview
- 16.2.1.2. Products
- 16.2.1.3. SWOT Analysis
- 16.2.1.4. Recent Developments
- 16.2.1.5. Financials (Based on Availability)
- 16.2.2 Fujian Jinjiang Petrochemical
- 16.2.2.1. Overview
- 16.2.2.2. Products
- 16.2.2.3. SWOT Analysis
- 16.2.2.4. Recent Developments
- 16.2.2.5. Financials (Based on Availability)
- 16.2.3 Fibrant
- 16.2.3.1. Overview
- 16.2.3.2. Products
- 16.2.3.3. SWOT Analysis
- 16.2.3.4. Recent Developments
- 16.2.3.5. Financials (Based on Availability)
- 16.2.4 AdvanSix Inc
- 16.2.4.1. Overview
- 16.2.4.2. Products
- 16.2.4.3. SWOT Analysis
- 16.2.4.4. Recent Developments
- 16.2.4.5. Financials (Based on Availability)
- 16.2.5 Juhua Group Corporation
- 16.2.5.1. Overview
- 16.2.5.2. Products
- 16.2.5.3. SWOT Analysis
- 16.2.5.4. Recent Developments
- 16.2.5.5. Financials (Based on Availability)
- 16.2.6 UBE Corporation
- 16.2.6.1. Overview
- 16.2.6.2. Products
- 16.2.6.3. SWOT Analysis
- 16.2.6.4. Recent Developments
- 16.2.6.5. Financials (Based on Availability)
- 16.2.7 Fertilisers And Chemicals Travancore Limited (FACT)
- 16.2.7.1. Overview
- 16.2.7.2. Products
- 16.2.7.3. SWOT Analysis
- 16.2.7.4. Recent Developments
- 16.2.7.5. Financials (Based on Availability)
- 16.2.8 Alpek S A B de CV
- 16.2.8.1. Overview
- 16.2.8.2. Products
- 16.2.8.3. SWOT Analysis
- 16.2.8.4. Recent Developments
- 16.2.8.5. Financials (Based on Availability)
- 16.2.9 Toray Industries Inc
- 16.2.9.1. Overview
- 16.2.9.2. Products
- 16.2.9.3. SWOT Analysis
- 16.2.9.4. Recent Developments
- 16.2.9.5. Financials (Based on Availability)
- 16.2.10 Domo Chemicals
- 16.2.10.1. Overview
- 16.2.10.2. Products
- 16.2.10.3. SWOT Analysis
- 16.2.10.4. Recent Developments
- 16.2.10.5. Financials (Based on Availability)
- 16.2.11 Capro Co
- 16.2.11.1. Overview
- 16.2.11.2. Products
- 16.2.11.3. SWOT Analysis
- 16.2.11.4. Recent Developments
- 16.2.11.5. Financials (Based on Availability)
- 16.2.12 China Petrochemical Development Corporation
- 16.2.12.1. Overview
- 16.2.12.2. Products
- 16.2.12.3. SWOT Analysis
- 16.2.12.4. Recent Developments
- 16.2.12.5. Financials (Based on Availability)
- 16.2.13 BASF SE
- 16.2.13.1. Overview
- 16.2.13.2. Products
- 16.2.13.3. SWOT Analysis
- 16.2.13.4. Recent Developments
- 16.2.13.5. Financials (Based on Availability)
- 16.2.14 Shandong Haili Chemical Industry Co Ltd
- 16.2.14.1. Overview
- 16.2.14.2. Products
- 16.2.14.3. SWOT Analysis
- 16.2.14.4. Recent Developments
- 16.2.14.5. Financials (Based on Availability)
- 16.2.15 Lanxess
- 16.2.15.1. Overview
- 16.2.15.2. Products
- 16.2.15.3. SWOT Analysis
- 16.2.15.4. Recent Developments
- 16.2.15.5. Financials (Based on Availability)
- 16.2.16 PJSC Kuibyshevazot
- 16.2.16.1. Overview
- 16.2.16.2. Products
- 16.2.16.3. SWOT Analysis
- 16.2.16.4. Recent Developments
- 16.2.16.5. Financials (Based on Availability)
- 16.2.17 Xuyang Group*List Not Exhaustive
- 16.2.17.1. Overview
- 16.2.17.2. Products
- 16.2.17.3. SWOT Analysis
- 16.2.17.4. Recent Developments
- 16.2.17.5. Financials (Based on Availability)
- 16.2.18 China Petroleum & Chemical Corporation (Sinopec)
- 16.2.18.1. Overview
- 16.2.18.2. Products
- 16.2.18.3. SWOT Analysis
- 16.2.18.4. Recent Developments
- 16.2.18.5. Financials (Based on Availability)
- 16.2.1 Sumitomo Chemical Co Ltd
List of Figures
- Figure 1: Global Caprolactam Industry Revenue Breakdown (Million, %) by Region 2024 & 2032
- Figure 2: Asia Pacific Caprolactam Industry Revenue (Million), by Country 2024 & 2032
- Figure 3: Asia Pacific Caprolactam Industry Revenue Share (%), by Country 2024 & 2032
- Figure 4: North America Caprolactam Industry Revenue (Million), by Country 2024 & 2032
- Figure 5: North America Caprolactam Industry Revenue Share (%), by Country 2024 & 2032
- Figure 6: Europe Caprolactam Industry Revenue (Million), by Country 2024 & 2032
- Figure 7: Europe Caprolactam Industry Revenue Share (%), by Country 2024 & 2032
- Figure 8: South America Caprolactam Industry Revenue (Million), by Country 2024 & 2032
- Figure 9: South America Caprolactam Industry Revenue Share (%), by Country 2024 & 2032
- Figure 10: Middle East and Africa Caprolactam Industry Revenue (Million), by Country 2024 & 2032
- Figure 11: Middle East and Africa Caprolactam Industry Revenue Share (%), by Country 2024 & 2032
- Figure 12: Asia Pacific Caprolactam Industry Revenue (Million), by Raw Material 2024 & 2032
- Figure 13: Asia Pacific Caprolactam Industry Revenue Share (%), by Raw Material 2024 & 2032
- Figure 14: Asia Pacific Caprolactam Industry Revenue (Million), by End Product 2024 & 2032
- Figure 15: Asia Pacific Caprolactam Industry Revenue Share (%), by End Product 2024 & 2032
- Figure 16: Asia Pacific Caprolactam Industry Revenue (Million), by Application 2024 & 2032
- Figure 17: Asia Pacific Caprolactam Industry Revenue Share (%), by Application 2024 & 2032
- Figure 18: Asia Pacific Caprolactam Industry Revenue (Million), by End-user Industry 2024 & 2032
- Figure 19: Asia Pacific Caprolactam Industry Revenue Share (%), by End-user Industry 2024 & 2032
- Figure 20: Asia Pacific Caprolactam Industry Revenue (Million), by Country 2024 & 2032
- Figure 21: Asia Pacific Caprolactam Industry Revenue Share (%), by Country 2024 & 2032
- Figure 22: North America Caprolactam Industry Revenue (Million), by Raw Material 2024 & 2032
- Figure 23: North America Caprolactam Industry Revenue Share (%), by Raw Material 2024 & 2032
- Figure 24: North America Caprolactam Industry Revenue (Million), by End Product 2024 & 2032
- Figure 25: North America Caprolactam Industry Revenue Share (%), by End Product 2024 & 2032
- Figure 26: North America Caprolactam Industry Revenue (Million), by Application 2024 & 2032
- Figure 27: North America Caprolactam Industry Revenue Share (%), by Application 2024 & 2032
- Figure 28: North America Caprolactam Industry Revenue (Million), by End-user Industry 2024 & 2032
- Figure 29: North America Caprolactam Industry Revenue Share (%), by End-user Industry 2024 & 2032
- Figure 30: North America Caprolactam Industry Revenue (Million), by Country 2024 & 2032
- Figure 31: North America Caprolactam Industry Revenue Share (%), by Country 2024 & 2032
- Figure 32: Europe Caprolactam Industry Revenue (Million), by Raw Material 2024 & 2032
- Figure 33: Europe Caprolactam Industry Revenue Share (%), by Raw Material 2024 & 2032
- Figure 34: Europe Caprolactam Industry Revenue (Million), by End Product 2024 & 2032
- Figure 35: Europe Caprolactam Industry Revenue Share (%), by End Product 2024 & 2032
- Figure 36: Europe Caprolactam Industry Revenue (Million), by Application 2024 & 2032
- Figure 37: Europe Caprolactam Industry Revenue Share (%), by Application 2024 & 2032
- Figure 38: Europe Caprolactam Industry Revenue (Million), by End-user Industry 2024 & 2032
- Figure 39: Europe Caprolactam Industry Revenue Share (%), by End-user Industry 2024 & 2032
- Figure 40: Europe Caprolactam Industry Revenue (Million), by Country 2024 & 2032
- Figure 41: Europe Caprolactam Industry Revenue Share (%), by Country 2024 & 2032
- Figure 42: South America Caprolactam Industry Revenue (Million), by Raw Material 2024 & 2032
- Figure 43: South America Caprolactam Industry Revenue Share (%), by Raw Material 2024 & 2032
- Figure 44: South America Caprolactam Industry Revenue (Million), by End Product 2024 & 2032
- Figure 45: South America Caprolactam Industry Revenue Share (%), by End Product 2024 & 2032
- Figure 46: South America Caprolactam Industry Revenue (Million), by Application 2024 & 2032
- Figure 47: South America Caprolactam Industry Revenue Share (%), by Application 2024 & 2032
- Figure 48: South America Caprolactam Industry Revenue (Million), by End-user Industry 2024 & 2032
- Figure 49: South America Caprolactam Industry Revenue Share (%), by End-user Industry 2024 & 2032
- Figure 50: South America Caprolactam Industry Revenue (Million), by Country 2024 & 2032
- Figure 51: South America Caprolactam Industry Revenue Share (%), by Country 2024 & 2032
- Figure 52: Middle East and Africa Caprolactam Industry Revenue (Million), by Raw Material 2024 & 2032
- Figure 53: Middle East and Africa Caprolactam Industry Revenue Share (%), by Raw Material 2024 & 2032
- Figure 54: Middle East and Africa Caprolactam Industry Revenue (Million), by End Product 2024 & 2032
- Figure 55: Middle East and Africa Caprolactam Industry Revenue Share (%), by End Product 2024 & 2032
- Figure 56: Middle East and Africa Caprolactam Industry Revenue (Million), by Application 2024 & 2032
- Figure 57: Middle East and Africa Caprolactam Industry Revenue Share (%), by Application 2024 & 2032
- Figure 58: Middle East and Africa Caprolactam Industry Revenue (Million), by End-user Industry 2024 & 2032
- Figure 59: Middle East and Africa Caprolactam Industry Revenue Share (%), by End-user Industry 2024 & 2032
- Figure 60: Middle East and Africa Caprolactam Industry Revenue (Million), by Country 2024 & 2032
- Figure 61: Middle East and Africa Caprolactam Industry Revenue Share (%), by Country 2024 & 2032
List of Tables
- Table 1: Global Caprolactam Industry Revenue Million Forecast, by Region 2019 & 2032
- Table 2: Global Caprolactam Industry Revenue Million Forecast, by Raw Material 2019 & 2032
- Table 3: Global Caprolactam Industry Revenue Million Forecast, by End Product 2019 & 2032
- Table 4: Global Caprolactam Industry Revenue Million Forecast, by Application 2019 & 2032
- Table 5: Global Caprolactam Industry Revenue Million Forecast, by End-user Industry 2019 & 2032
- Table 6: Global Caprolactam Industry Revenue Million Forecast, by Region 2019 & 2032
- Table 7: Global Caprolactam Industry Revenue Million Forecast, by Country 2019 & 2032
- Table 8: China Caprolactam Industry Revenue (Million) Forecast, by Application 2019 & 2032
- Table 9: Japan Caprolactam Industry Revenue (Million) Forecast, by Application 2019 & 2032
- Table 10: South Korea Caprolactam Industry Revenue (Million) Forecast, by Application 2019 & 2032
- Table 11: Rest of Asia Pacific Caprolactam Industry Revenue (Million) Forecast, by Application 2019 & 2032
- Table 12: Global Caprolactam Industry Revenue Million Forecast, by Country 2019 & 2032
- Table 13: United States Caprolactam Industry Revenue (Million) Forecast, by Application 2019 & 2032
- Table 14: Canada Caprolactam Industry Revenue (Million) Forecast, by Application 2019 & 2032
- Table 15: Mexico Caprolactam Industry Revenue (Million) Forecast, by Application 2019 & 2032
- Table 16: Global Caprolactam Industry Revenue Million Forecast, by Country 2019 & 2032
- Table 17: Germany Caprolactam Industry Revenue (Million) Forecast, by Application 2019 & 2032
- Table 18: United Kingdom Caprolactam Industry Revenue (Million) Forecast, by Application 2019 & 2032
- Table 19: France Caprolactam Industry Revenue (Million) Forecast, by Application 2019 & 2032
- Table 20: Italy Caprolactam Industry Revenue (Million) Forecast, by Application 2019 & 2032
- Table 21: Rest of Europe Caprolactam Industry Revenue (Million) Forecast, by Application 2019 & 2032
- Table 22: Global Caprolactam Industry Revenue Million Forecast, by Country 2019 & 2032
- Table 23: Brazil Caprolactam Industry Revenue (Million) Forecast, by Application 2019 & 2032
- Table 24: Argentina Caprolactam Industry Revenue (Million) Forecast, by Application 2019 & 2032
- Table 25: Rest of South America Caprolactam Industry Revenue (Million) Forecast, by Application 2019 & 2032
- Table 26: Global Caprolactam Industry Revenue Million Forecast, by Country 2019 & 2032
- Table 27: Saudi Arabia Caprolactam Industry Revenue (Million) Forecast, by Application 2019 & 2032
- Table 28: South Africa Caprolactam Industry Revenue (Million) Forecast, by Application 2019 & 2032
- Table 29: Rest of Middle East and Africa Caprolactam Industry Revenue (Million) Forecast, by Application 2019 & 2032
- Table 30: Global Caprolactam Industry Revenue Million Forecast, by Raw Material 2019 & 2032
- Table 31: Global Caprolactam Industry Revenue Million Forecast, by End Product 2019 & 2032
- Table 32: Global Caprolactam Industry Revenue Million Forecast, by Application 2019 & 2032
- Table 33: Global Caprolactam Industry Revenue Million Forecast, by End-user Industry 2019 & 2032
- Table 34: Global Caprolactam Industry Revenue Million Forecast, by Country 2019 & 2032
- Table 35: China Caprolactam Industry Revenue (Million) Forecast, by Application 2019 & 2032
- Table 36: Japan Caprolactam Industry Revenue (Million) Forecast, by Application 2019 & 2032
- Table 37: South Korea Caprolactam Industry Revenue (Million) Forecast, by Application 2019 & 2032
- Table 38: Rest of Asia Pacific Caprolactam Industry Revenue (Million) Forecast, by Application 2019 & 2032
- Table 39: Global Caprolactam Industry Revenue Million Forecast, by Raw Material 2019 & 2032
- Table 40: Global Caprolactam Industry Revenue Million Forecast, by End Product 2019 & 2032
- Table 41: Global Caprolactam Industry Revenue Million Forecast, by Application 2019 & 2032
- Table 42: Global Caprolactam Industry Revenue Million Forecast, by End-user Industry 2019 & 2032
- Table 43: Global Caprolactam Industry Revenue Million Forecast, by Country 2019 & 2032
- Table 44: United States Caprolactam Industry Revenue (Million) Forecast, by Application 2019 & 2032
- Table 45: Canada Caprolactam Industry Revenue (Million) Forecast, by Application 2019 & 2032
- Table 46: Mexico Caprolactam Industry Revenue (Million) Forecast, by Application 2019 & 2032
- Table 47: Global Caprolactam Industry Revenue Million Forecast, by Raw Material 2019 & 2032
- Table 48: Global Caprolactam Industry Revenue Million Forecast, by End Product 2019 & 2032
- Table 49: Global Caprolactam Industry Revenue Million Forecast, by Application 2019 & 2032
- Table 50: Global Caprolactam Industry Revenue Million Forecast, by End-user Industry 2019 & 2032
- Table 51: Global Caprolactam Industry Revenue Million Forecast, by Country 2019 & 2032
- Table 52: Germany Caprolactam Industry Revenue (Million) Forecast, by Application 2019 & 2032
- Table 53: United Kingdom Caprolactam Industry Revenue (Million) Forecast, by Application 2019 & 2032
- Table 54: France Caprolactam Industry Revenue (Million) Forecast, by Application 2019 & 2032
- Table 55: Italy Caprolactam Industry Revenue (Million) Forecast, by Application 2019 & 2032
- Table 56: Rest of Europe Caprolactam Industry Revenue (Million) Forecast, by Application 2019 & 2032
- Table 57: Global Caprolactam Industry Revenue Million Forecast, by Raw Material 2019 & 2032
- Table 58: Global Caprolactam Industry Revenue Million Forecast, by End Product 2019 & 2032
- Table 59: Global Caprolactam Industry Revenue Million Forecast, by Application 2019 & 2032
- Table 60: Global Caprolactam Industry Revenue Million Forecast, by End-user Industry 2019 & 2032
- Table 61: Global Caprolactam Industry Revenue Million Forecast, by Country 2019 & 2032
- Table 62: Brazil Caprolactam Industry Revenue (Million) Forecast, by Application 2019 & 2032
- Table 63: Argentina Caprolactam Industry Revenue (Million) Forecast, by Application 2019 & 2032
- Table 64: Rest of South America Caprolactam Industry Revenue (Million) Forecast, by Application 2019 & 2032
- Table 65: Global Caprolactam Industry Revenue Million Forecast, by Raw Material 2019 & 2032
- Table 66: Global Caprolactam Industry Revenue Million Forecast, by End Product 2019 & 2032
- Table 67: Global Caprolactam Industry Revenue Million Forecast, by Application 2019 & 2032
- Table 68: Global Caprolactam Industry Revenue Million Forecast, by End-user Industry 2019 & 2032
- Table 69: Global Caprolactam Industry Revenue Million Forecast, by Country 2019 & 2032
- Table 70: Saudi Arabia Caprolactam Industry Revenue (Million) Forecast, by Application 2019 & 2032
- Table 71: South Africa Caprolactam Industry Revenue (Million) Forecast, by Application 2019 & 2032
- Table 72: Rest of Middle East and Africa Caprolactam Industry Revenue (Million) Forecast, by Application 2019 & 2032
Frequently Asked Questions
1. What is the projected Compound Annual Growth Rate (CAGR) of the Caprolactam Industry?
The projected CAGR is approximately > 3.00%.
2. Which companies are prominent players in the Caprolactam Industry?
Key companies in the market include Sumitomo Chemical Co Ltd, Fujian Jinjiang Petrochemical, Fibrant, AdvanSix Inc, Juhua Group Corporation, UBE Corporation, Fertilisers And Chemicals Travancore Limited (FACT), Alpek S A B de CV, Toray Industries Inc, Domo Chemicals, Capro Co, China Petrochemical Development Corporation, BASF SE, Shandong Haili Chemical Industry Co Ltd, Lanxess, PJSC Kuibyshevazot, Xuyang Group*List Not Exhaustive, China Petroleum & Chemical Corporation (Sinopec).
3. What are the main segments of the Caprolactam Industry?
The market segments include Raw Material, End Product, Application, End-user Industry.
4. Can you provide details about the market size?
The market size is estimated to be USD XX Million as of 2022.
5. What are some drivers contributing to market growth?
Growing Production Capacity of Nylon 6.
6. What are the notable trends driving market growth?
Increasing Demand for Textile and Carpets.
7. Are there any restraints impacting market growth?
Toxicity of caprolactam; Presence of substitute products for Nylon-6.
8. Can you provide examples of recent developments in the market?
In September 2022, Xuyang Group at its Cangzhou Park site started the production of caprolactam post-completion of its second phase of the 300,000 tons per year caprolactam expansion project. With this expansion project, the company's total production capacity increased to 750,000 tons per year.
9. What pricing options are available for accessing the report?
Pricing options include single-user, multi-user, and enterprise licenses priced at USD 4750, USD 5250, and USD 8750 respectively.
10. Is the market size provided in terms of value or volume?
The market size is provided in terms of value, measured in Million.
11. Are there any specific market keywords associated with the report?
Yes, the market keyword associated with the report is "Caprolactam Industry," which aids in identifying and referencing the specific market segment covered.
12. How do I determine which pricing option suits my needs best?
The pricing options vary based on user requirements and access needs. Individual users may opt for single-user licenses, while businesses requiring broader access may choose multi-user or enterprise licenses for cost-effective access to the report.
13. Are there any additional resources or data provided in the Caprolactam Industry report?
While the report offers comprehensive insights, it's advisable to review the specific contents or supplementary materials provided to ascertain if additional resources or data are available.
14. How can I stay updated on further developments or reports in the Caprolactam Industry?
To stay informed about further developments, trends, and reports in the Caprolactam Industry, consider subscribing to industry newsletters, following relevant companies and organizations, or regularly checking reputable industry news sources and publications.
Methodology
Step 1 - Identification of Relevant Samples Size from Population Database


Step 2 - Approaches for Defining Global Market Size (Value, Volume* & Price*)

Note*: In applicable scenarios
Step 3 - Data Sources
Primary Research
- Web Analytics
- Survey Reports
- Research Institute
- Latest Research Reports
- Opinion Leaders
Secondary Research
- Annual Reports
- White Paper
- Latest Press Release
- Industry Association
- Paid Database
- Investor Presentations

Step 4 - Data Triangulation
Involves using different sources of information in order to increase the validity of a study
These sources are likely to be stakeholders in a program - participants, other researchers, program staff, other community members, and so on.
Then we put all data in single framework & apply various statistical tools to find out the dynamic on the market.
During the analysis stage, feedback from the stakeholder groups would be compared to determine areas of agreement as well as areas of divergence


