
Key Insights
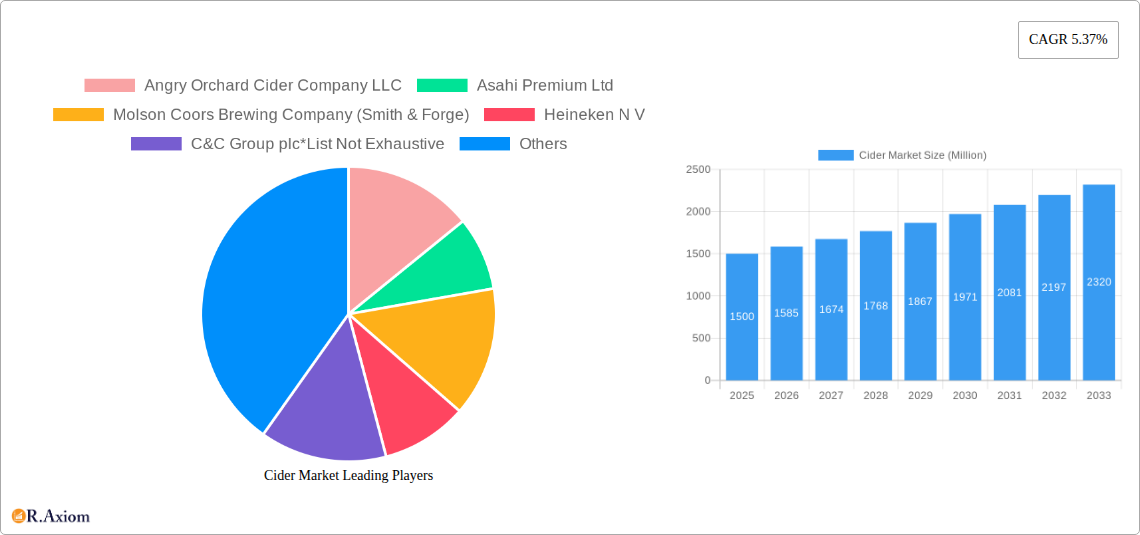
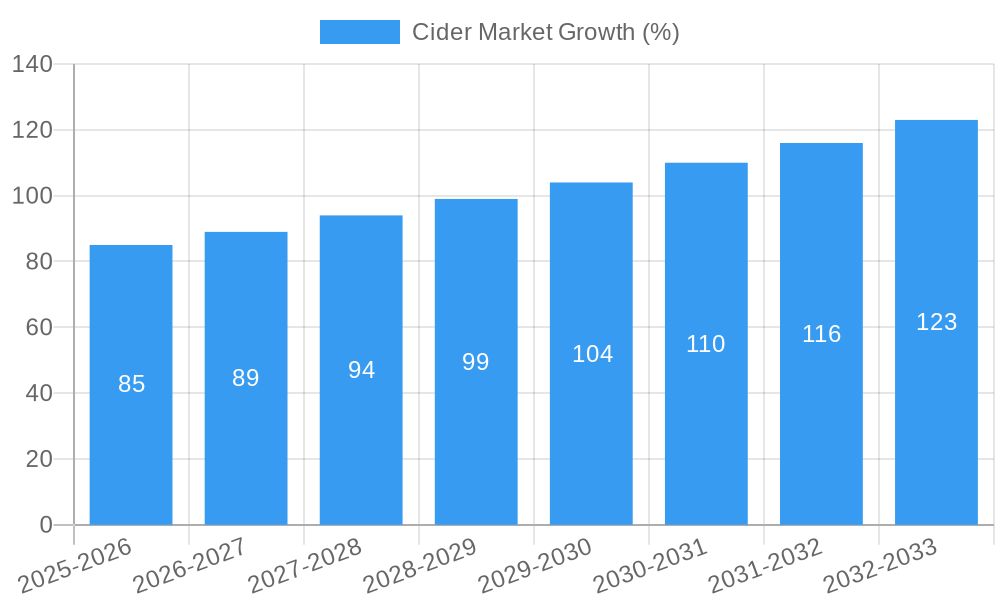
The global cider market, valued at approximately $XX million in 2025, is projected to experience robust growth, exhibiting a Compound Annual Growth Rate (CAGR) of 5.37% from 2025 to 2033. This expansion is fueled by several key drivers. Increasing consumer demand for healthier alcoholic beverages, coupled with the rising popularity of craft ciders and diverse flavor profiles, is significantly boosting market penetration. The growing preference for premium and artisanal products, alongside innovative marketing and distribution strategies targeting younger demographics, further contributes to this positive trajectory. The market segmentation reveals a preference for flavored ciders, which dominate the product type segment, and a strong reliance on supermarket/hypermarkets and specialty stores as primary distribution channels. However, the burgeoning online retail sector presents significant growth opportunities for cider producers. While the market faces challenges such as fluctuating raw material costs and intense competition from established alcoholic beverage brands, these hurdles are likely to be offset by the continuous innovation and expansion into new markets.
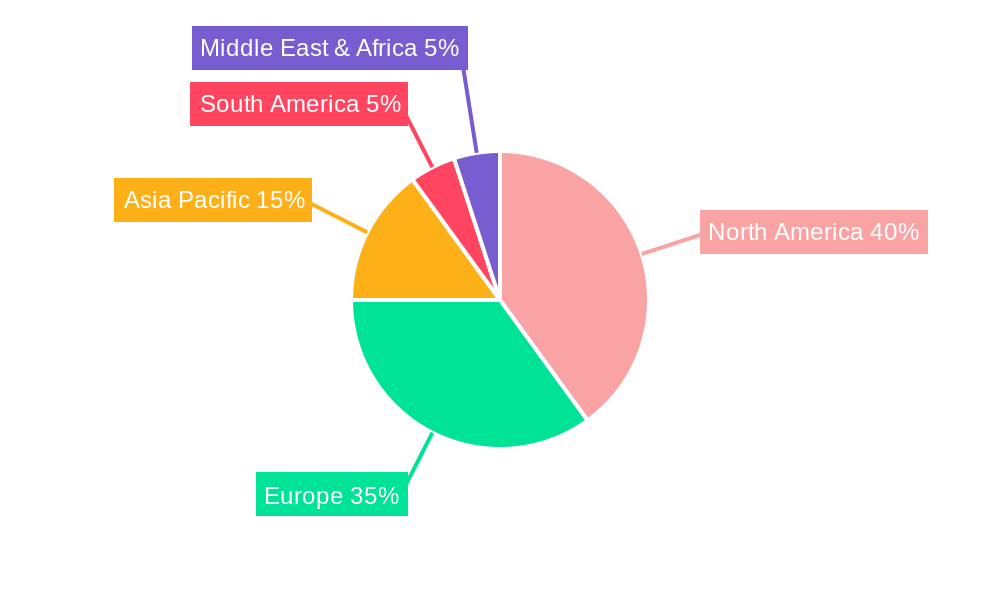
Geographical analysis indicates a strong market presence in North America and Europe, with the United States and United Kingdom representing significant consumer bases. However, emerging markets in Asia-Pacific and South America showcase considerable untapped potential for growth. The strategic expansion of cider production and distribution networks into these regions, alongside tailored marketing campaigns highlighting the unique cultural relevance of cider, will be critical for future market dominance. Companies like Angry Orchard, Asahi, and Molson Coors are key players, actively shaping market trends through product diversification, brand building, and strategic acquisitions. The continuous evolution of consumer preferences and emerging trends, such as the increasing interest in organic and sustainably sourced ciders, will further influence market dynamics in the coming years, demanding continuous adaptation from cider producers to maintain competitiveness.
Cider Market: A Comprehensive Report (2019-2033)
This comprehensive report provides an in-depth analysis of the global cider market, offering invaluable insights for industry stakeholders, investors, and strategic decision-makers. Covering the period from 2019 to 2033, with 2025 as the base year and forecast extending to 2033, this report meticulously examines market dynamics, competitive landscapes, and future growth potential. The report leverages extensive primary and secondary research, incorporating data from reputable sources and expert interviews to deliver actionable intelligence. The total market size is estimated at xx Million in 2025 and is projected to reach xx Million by 2033.
Cider Market Concentration & Innovation
This section analyzes the level of market concentration within the cider industry, identifying key players and their respective market shares. The report also examines the drivers of innovation, regulatory landscapes impacting product development and distribution, the presence and impact of substitute products, evolving end-user trends, and significant mergers and acquisitions (M&A) activities.
- Market Concentration: The global cider market exhibits a moderately concentrated structure, with key players like Asahi Premium Ltd, Heineken N V, and C&C Group plc holding significant market share. However, the presence of numerous regional and craft cider producers signifies a dynamic competitive landscape. The combined market share of the top five players is estimated to be xx%.
- Innovation Drivers: Innovation in the cider market is driven by the increasing demand for premium and flavored ciders, along with the exploration of novel production techniques and sustainable practices. Companies are focusing on unique flavor profiles, organic ingredients, and low-alcohol options to cater to evolving consumer preferences.
- Regulatory Frameworks: Government regulations concerning alcohol content, labeling, and marketing significantly influence the cider market. Variations in these regulations across different regions create opportunities and challenges for cider producers.
- Product Substitutes: The cider market faces competition from other alcoholic beverages, including beer, wine, and ready-to-drink cocktails. The growth of these substitute products influences the market share of cider.
- End-User Trends: Consumer preferences are shifting towards healthier and more premium options, leading to increased demand for craft ciders, organic ciders, and low-sugar variants.
- M&A Activities: The cider industry has witnessed several M&A activities in recent years, primarily driven by larger companies' efforts to expand their market share and product portfolios. The total value of M&A deals within the study period (2019-2024) is estimated at xx Million. Specific examples include [insert specific M&A examples if available, otherwise use "several acquisitions by major players to expand their portfolios"].
Cider Market Industry Trends & Insights
This section delves into the key trends shaping the cider market's trajectory. It examines market growth drivers, the impact of technological advancements, evolving consumer preferences, and the intense competitive dynamics influencing market evolution. The compound annual growth rate (CAGR) for the forecast period (2025-2033) is projected to be xx%, reflecting the anticipated market expansion. Market penetration, particularly in emerging markets, is expected to increase significantly as consumer awareness and acceptance of cider grow.
[Insert detailed paragraph here covering market growth drivers (e.g., rising disposable incomes, changing drinking habits), technological disruptions (e.g., automation in production, e-commerce growth), consumer preferences (e.g., demand for craft ciders, health-conscious choices), and competitive dynamics (e.g., pricing strategies, product differentiation).]
Dominant Markets & Segments in Cider Market
This section pinpoints the leading regions, countries, and market segments within the cider market. It offers a detailed analysis of factors driving dominance in each segment, including economic policies, infrastructure development, and consumer behavior.
Leading Regions/Countries: [Insert the dominant region/country and its market share. For example: North America holds the largest market share, accounting for xx% of the global cider market in 2025, driven by high consumption rates and established production capacity.]
Dominant Product Types:
- Flavored Cider: This segment is experiencing robust growth due to the increasing demand for diverse flavor profiles and innovative product offerings. [Include key drivers like consumer preference for variety and willingness to experiment.]
- Plain Cider: This segment maintains a substantial market share, primarily driven by its established consumer base and affordability. [Include key drivers like traditional preference and value-seeking consumers.]
Dominant Distribution Channels:
- Supermarket/Hypermarkets: This channel remains the dominant distribution channel for cider, due to its wide reach and accessibility to a large consumer base. [Include key drivers like ease of access and consumer familiarity.]
- Speciality Stores: This channel is witnessing growth owing to the increasing popularity of craft ciders and the growing demand for unique and premium products. [Include key drivers like high-quality selection and curated experience.]
- Online Retail Stores: This channel's growth is fuelled by increasing e-commerce adoption and the convenience it offers to consumers. [Include key drivers like convenience and increased product discovery.]
- Other Channels: [Discuss other relevant channels and their market share, e.g., bars, restaurants, etc.]
Cider Market Product Developments
Recent product innovations in the cider market focus on catering to evolving consumer preferences for healthier and more premium options. This includes the introduction of low-sugar, organic, gluten-free, and unique flavored ciders. Technological advancements in production processes have enabled more efficient and sustainable cider making. These innovations have enhanced product quality, expanded market reach, and enhanced competitive advantage for companies that prioritize product development.
Report Scope & Segmentation Analysis
This report segments the cider market based on product type (Flavored Cider, Plain Cider) and distribution channel (Specialty Stores, Supermarket/Hypermarkets, Online Retail Stores, Other Channels). Each segment's growth projections, market size, and competitive dynamics are analyzed separately. Flavored Cider demonstrates higher growth compared to Plain Cider, driven by the increasing demand for variety and unique flavor experiences. Supermarkets and hypermarkets maintain the largest market share in the distribution channel segment, while online retail is experiencing rapid growth due to increasing e-commerce adoption.
Key Drivers of Cider Market Growth
The cider market's growth is fueled by several key factors, including:
- Rising disposable incomes: Increased purchasing power allows consumers to spend more on premium alcoholic beverages, including cider.
- Changing consumer preferences: Growing demand for healthier and more diverse alcoholic options drives innovation and consumption.
- Favorable regulatory environment: Supportive policies in certain regions promote market growth.
Challenges in the Cider Market Sector
The cider market faces several challenges:
- Intense competition: Competition from other alcoholic beverages puts pressure on market share and pricing.
- Fluctuations in raw material costs: Changes in apple prices and other input costs can impact profitability.
- Stringent regulations: Compliance with varying regulations across different regions can be complex and costly.
Emerging Opportunities in Cider Market
Emerging opportunities in the cider market include:
- Expansion into new markets: Untapped markets in developing countries offer significant growth potential.
- Development of innovative products: Creating new flavors, formats, and health-conscious options can attract new consumer segments.
- Leveraging e-commerce: Expanding online sales channels can increase market reach and convenience.
Leading Players in the Cider Market Market
- Angry Orchard Cider Company LLC
- Asahi Premium Ltd
- Molson Coors Brewing Company (Smith & Forge)
- Heineken N V
- C&C Group plc
- Seattle Cider Company
- Carlsberg Breweries A/S
- Agrial (Aston Manor Brewery)
- Woodchuck Cidery
- Vander Mill Ciders
Key Developments in Cider Market Industry
- [Month, Year]: [Company Name] launched a new line of organic ciders.
- [Month, Year]: Asahi Premium Ltd acquired [Acquired Company Name], expanding its market presence.
- [Month, Year]: New regulations regarding alcohol labeling were implemented in [Country/Region].
- [Month, Year]: [Company Name] invested in a new cider production facility. [Add more bullet points with specific details as available.]
Strategic Outlook for Cider Market Market
The cider market shows promising growth potential, driven by evolving consumer preferences, technological advancements, and expansion into new markets. Focusing on product innovation, strategic partnerships, and effective marketing will be crucial for success in this dynamic industry. The market is poised for significant expansion in the coming years, offering considerable opportunities for both established players and new entrants.
Cider Market Segmentation
-
1. Product Type
- 1.1. Flavored Cider
- 1.2. Plain Cider
-
2. Distribution Channel
- 2.1. Speciality Stores
- 2.2. Supermarket/Hypermarkets
- 2.3. Online Retail Stores
- 2.4. Other Channels
Cider Market Segmentation By Geography
-
1. North America
- 1.1. United States
- 1.2. Canada
- 1.3. Mexico
- 1.4. Rest of North America
-
2. Europe
- 2.1. United Kingdom
- 2.2. Germany
- 2.3. France
- 2.4. Russia
- 2.5. Italy
- 2.6. Spain
- 2.7. Rest of Europe
-
3. Asia Pacific
- 3.1. India
- 3.2. China
- 3.3. Japan
- 3.4. Australia
- 3.5. Rest of Asia Pacific
-
4. South America
- 4.1. Brazil
- 4.2. Argentina
- 4.3. Rest of South America
- 5. Middle East
-
6. South Africa
- 6.1. Rest of Middle East
Cider Market REPORT HIGHLIGHTS
| Aspects | Details |
|---|---|
| Study Period | 2019-2033 |
| Base Year | 2024 |
| Estimated Year | 2025 |
| Forecast Period | 2025-2033 |
| Historical Period | 2019-2024 |
| Growth Rate | CAGR of 5.37% from 2019-2033 |
| Segmentation |
|
Table of Contents
- 1. Introduction
- 1.1. Research Scope
- 1.2. Market Segmentation
- 1.3. Research Methodology
- 1.4. Definitions and Assumptions
- 2. Executive Summary
- 2.1. Introduction
- 3. Market Dynamics
- 3.1. Introduction
- 3.2. Market Drivers
- 3.2.1. Growing Demand for Organic Ingredients in the Food Industry; Increasing Popularity of "Super Fruit" Ingredients in Functional Foods and Beverages
- 3.3. Market Restrains
- 3.3.1. Stringent Food Safety Regulations
- 3.4. Market Trends
- 3.4.1. Surge in Demand for Gluten-Free Alcoholic Beverages
- 4. Market Factor Analysis
- 4.1. Porters Five Forces
- 4.2. Supply/Value Chain
- 4.3. PESTEL analysis
- 4.4. Market Entropy
- 4.5. Patent/Trademark Analysis
- 5. Global Cider Market Analysis, Insights and Forecast, 2019-2031
- 5.1. Market Analysis, Insights and Forecast - by Product Type
- 5.1.1. Flavored Cider
- 5.1.2. Plain Cider
- 5.2. Market Analysis, Insights and Forecast - by Distribution Channel
- 5.2.1. Speciality Stores
- 5.2.2. Supermarket/Hypermarkets
- 5.2.3. Online Retail Stores
- 5.2.4. Other Channels
- 5.3. Market Analysis, Insights and Forecast - by Region
- 5.3.1. North America
- 5.3.2. Europe
- 5.3.3. Asia Pacific
- 5.3.4. South America
- 5.3.5. Middle East
- 5.3.6. South Africa
- 5.1. Market Analysis, Insights and Forecast - by Product Type
- 6. North America Cider Market Analysis, Insights and Forecast, 2019-2031
- 6.1. Market Analysis, Insights and Forecast - by Product Type
- 6.1.1. Flavored Cider
- 6.1.2. Plain Cider
- 6.2. Market Analysis, Insights and Forecast - by Distribution Channel
- 6.2.1. Speciality Stores
- 6.2.2. Supermarket/Hypermarkets
- 6.2.3. Online Retail Stores
- 6.2.4. Other Channels
- 6.1. Market Analysis, Insights and Forecast - by Product Type
- 7. Europe Cider Market Analysis, Insights and Forecast, 2019-2031
- 7.1. Market Analysis, Insights and Forecast - by Product Type
- 7.1.1. Flavored Cider
- 7.1.2. Plain Cider
- 7.2. Market Analysis, Insights and Forecast - by Distribution Channel
- 7.2.1. Speciality Stores
- 7.2.2. Supermarket/Hypermarkets
- 7.2.3. Online Retail Stores
- 7.2.4. Other Channels
- 7.1. Market Analysis, Insights and Forecast - by Product Type
- 8. Asia Pacific Cider Market Analysis, Insights and Forecast, 2019-2031
- 8.1. Market Analysis, Insights and Forecast - by Product Type
- 8.1.1. Flavored Cider
- 8.1.2. Plain Cider
- 8.2. Market Analysis, Insights and Forecast - by Distribution Channel
- 8.2.1. Speciality Stores
- 8.2.2. Supermarket/Hypermarkets
- 8.2.3. Online Retail Stores
- 8.2.4. Other Channels
- 8.1. Market Analysis, Insights and Forecast - by Product Type
- 9. South America Cider Market Analysis, Insights and Forecast, 2019-2031
- 9.1. Market Analysis, Insights and Forecast - by Product Type
- 9.1.1. Flavored Cider
- 9.1.2. Plain Cider
- 9.2. Market Analysis, Insights and Forecast - by Distribution Channel
- 9.2.1. Speciality Stores
- 9.2.2. Supermarket/Hypermarkets
- 9.2.3. Online Retail Stores
- 9.2.4. Other Channels
- 9.1. Market Analysis, Insights and Forecast - by Product Type
- 10. Middle East Cider Market Analysis, Insights and Forecast, 2019-2031
- 10.1. Market Analysis, Insights and Forecast - by Product Type
- 10.1.1. Flavored Cider
- 10.1.2. Plain Cider
- 10.2. Market Analysis, Insights and Forecast - by Distribution Channel
- 10.2.1. Speciality Stores
- 10.2.2. Supermarket/Hypermarkets
- 10.2.3. Online Retail Stores
- 10.2.4. Other Channels
- 10.1. Market Analysis, Insights and Forecast - by Product Type
- 11. South Africa Cider Market Analysis, Insights and Forecast, 2019-2031
- 11.1. Market Analysis, Insights and Forecast - by Product Type
- 11.1.1. Flavored Cider
- 11.1.2. Plain Cider
- 11.2. Market Analysis, Insights and Forecast - by Distribution Channel
- 11.2.1. Speciality Stores
- 11.2.2. Supermarket/Hypermarkets
- 11.2.3. Online Retail Stores
- 11.2.4. Other Channels
- 11.1. Market Analysis, Insights and Forecast - by Product Type
- 12. North America Cider Market Analysis, Insights and Forecast, 2019-2031
- 12.1. Market Analysis, Insights and Forecast - By Country/Sub-region
- 12.1.1 United States
- 12.1.2 Canada
- 12.1.3 Mexico
- 12.1.4 Rest of North America
- 13. Europe Cider Market Analysis, Insights and Forecast, 2019-2031
- 13.1. Market Analysis, Insights and Forecast - By Country/Sub-region
- 13.1.1 United Kingdom
- 13.1.2 Germany
- 13.1.3 France
- 13.1.4 Russia
- 13.1.5 Italy
- 13.1.6 Spain
- 13.1.7 Rest of Europe
- 14. Asia Pacific Cider Market Analysis, Insights and Forecast, 2019-2031
- 14.1. Market Analysis, Insights and Forecast - By Country/Sub-region
- 14.1.1 India
- 14.1.2 China
- 14.1.3 Japan
- 14.1.4 Australia
- 14.1.5 Rest of Asia Pacific
- 15. South America Cider Market Analysis, Insights and Forecast, 2019-2031
- 15.1. Market Analysis, Insights and Forecast - By Country/Sub-region
- 15.1.1 Brazil
- 15.1.2 Argentina
- 15.1.3 Rest of South America
- 16. Middle East & Africa Cider Market Analysis, Insights and Forecast, 2019-2031
- 16.1. Market Analysis, Insights and Forecast - By Country/Sub-region
- 16.1.1 UAE
- 16.1.2 South Africa
- 16.1.3 Saudi Arabia
- 16.1.4 Rest of MEA
- 17. Competitive Analysis
- 17.1. Global Market Share Analysis 2024
- 17.2. Company Profiles
- 17.2.1 Angry Orchard Cider Company LLC
- 17.2.1.1. Overview
- 17.2.1.2. Products
- 17.2.1.3. SWOT Analysis
- 17.2.1.4. Recent Developments
- 17.2.1.5. Financials (Based on Availability)
- 17.2.2 Asahi Premium Ltd
- 17.2.2.1. Overview
- 17.2.2.2. Products
- 17.2.2.3. SWOT Analysis
- 17.2.2.4. Recent Developments
- 17.2.2.5. Financials (Based on Availability)
- 17.2.3 Molson Coors Brewing Company (Smith & Forge)
- 17.2.3.1. Overview
- 17.2.3.2. Products
- 17.2.3.3. SWOT Analysis
- 17.2.3.4. Recent Developments
- 17.2.3.5. Financials (Based on Availability)
- 17.2.4 Heineken N V
- 17.2.4.1. Overview
- 17.2.4.2. Products
- 17.2.4.3. SWOT Analysis
- 17.2.4.4. Recent Developments
- 17.2.4.5. Financials (Based on Availability)
- 17.2.5 C&C Group plc*List Not Exhaustive
- 17.2.5.1. Overview
- 17.2.5.2. Products
- 17.2.5.3. SWOT Analysis
- 17.2.5.4. Recent Developments
- 17.2.5.5. Financials (Based on Availability)
- 17.2.6 Seattle Cider Company
- 17.2.6.1. Overview
- 17.2.6.2. Products
- 17.2.6.3. SWOT Analysis
- 17.2.6.4. Recent Developments
- 17.2.6.5. Financials (Based on Availability)
- 17.2.7 Carlsberg Breweries A/S
- 17.2.7.1. Overview
- 17.2.7.2. Products
- 17.2.7.3. SWOT Analysis
- 17.2.7.4. Recent Developments
- 17.2.7.5. Financials (Based on Availability)
- 17.2.8 Agrial (Aston Manor Brewery)
- 17.2.8.1. Overview
- 17.2.8.2. Products
- 17.2.8.3. SWOT Analysis
- 17.2.8.4. Recent Developments
- 17.2.8.5. Financials (Based on Availability)
- 17.2.9 Woodchuck Cidery
- 17.2.9.1. Overview
- 17.2.9.2. Products
- 17.2.9.3. SWOT Analysis
- 17.2.9.4. Recent Developments
- 17.2.9.5. Financials (Based on Availability)
- 17.2.10 Vander Mill Ciders
- 17.2.10.1. Overview
- 17.2.10.2. Products
- 17.2.10.3. SWOT Analysis
- 17.2.10.4. Recent Developments
- 17.2.10.5. Financials (Based on Availability)
- 17.2.1 Angry Orchard Cider Company LLC
List of Figures
- Figure 1: Global Cider Market Revenue Breakdown (Million, %) by Region 2024 & 2032
- Figure 2: Global Cider Market Volume Breakdown (Billion, %) by Region 2024 & 2032
- Figure 3: North America Cider Market Revenue (Million), by Country 2024 & 2032
- Figure 4: North America Cider Market Volume (Billion), by Country 2024 & 2032
- Figure 5: North America Cider Market Revenue Share (%), by Country 2024 & 2032
- Figure 6: North America Cider Market Volume Share (%), by Country 2024 & 2032
- Figure 7: Europe Cider Market Revenue (Million), by Country 2024 & 2032
- Figure 8: Europe Cider Market Volume (Billion), by Country 2024 & 2032
- Figure 9: Europe Cider Market Revenue Share (%), by Country 2024 & 2032
- Figure 10: Europe Cider Market Volume Share (%), by Country 2024 & 2032
- Figure 11: Asia Pacific Cider Market Revenue (Million), by Country 2024 & 2032
- Figure 12: Asia Pacific Cider Market Volume (Billion), by Country 2024 & 2032
- Figure 13: Asia Pacific Cider Market Revenue Share (%), by Country 2024 & 2032
- Figure 14: Asia Pacific Cider Market Volume Share (%), by Country 2024 & 2032
- Figure 15: South America Cider Market Revenue (Million), by Country 2024 & 2032
- Figure 16: South America Cider Market Volume (Billion), by Country 2024 & 2032
- Figure 17: South America Cider Market Revenue Share (%), by Country 2024 & 2032
- Figure 18: South America Cider Market Volume Share (%), by Country 2024 & 2032
- Figure 19: Middle East & Africa Cider Market Revenue (Million), by Country 2024 & 2032
- Figure 20: Middle East & Africa Cider Market Volume (Billion), by Country 2024 & 2032
- Figure 21: Middle East & Africa Cider Market Revenue Share (%), by Country 2024 & 2032
- Figure 22: Middle East & Africa Cider Market Volume Share (%), by Country 2024 & 2032
- Figure 23: North America Cider Market Revenue (Million), by Product Type 2024 & 2032
- Figure 24: North America Cider Market Volume (Billion), by Product Type 2024 & 2032
- Figure 25: North America Cider Market Revenue Share (%), by Product Type 2024 & 2032
- Figure 26: North America Cider Market Volume Share (%), by Product Type 2024 & 2032
- Figure 27: North America Cider Market Revenue (Million), by Distribution Channel 2024 & 2032
- Figure 28: North America Cider Market Volume (Billion), by Distribution Channel 2024 & 2032
- Figure 29: North America Cider Market Revenue Share (%), by Distribution Channel 2024 & 2032
- Figure 30: North America Cider Market Volume Share (%), by Distribution Channel 2024 & 2032
- Figure 31: North America Cider Market Revenue (Million), by Country 2024 & 2032
- Figure 32: North America Cider Market Volume (Billion), by Country 2024 & 2032
- Figure 33: North America Cider Market Revenue Share (%), by Country 2024 & 2032
- Figure 34: North America Cider Market Volume Share (%), by Country 2024 & 2032
- Figure 35: Europe Cider Market Revenue (Million), by Product Type 2024 & 2032
- Figure 36: Europe Cider Market Volume (Billion), by Product Type 2024 & 2032
- Figure 37: Europe Cider Market Revenue Share (%), by Product Type 2024 & 2032
- Figure 38: Europe Cider Market Volume Share (%), by Product Type 2024 & 2032
- Figure 39: Europe Cider Market Revenue (Million), by Distribution Channel 2024 & 2032
- Figure 40: Europe Cider Market Volume (Billion), by Distribution Channel 2024 & 2032
- Figure 41: Europe Cider Market Revenue Share (%), by Distribution Channel 2024 & 2032
- Figure 42: Europe Cider Market Volume Share (%), by Distribution Channel 2024 & 2032
- Figure 43: Europe Cider Market Revenue (Million), by Country 2024 & 2032
- Figure 44: Europe Cider Market Volume (Billion), by Country 2024 & 2032
- Figure 45: Europe Cider Market Revenue Share (%), by Country 2024 & 2032
- Figure 46: Europe Cider Market Volume Share (%), by Country 2024 & 2032
- Figure 47: Asia Pacific Cider Market Revenue (Million), by Product Type 2024 & 2032
- Figure 48: Asia Pacific Cider Market Volume (Billion), by Product Type 2024 & 2032
- Figure 49: Asia Pacific Cider Market Revenue Share (%), by Product Type 2024 & 2032
- Figure 50: Asia Pacific Cider Market Volume Share (%), by Product Type 2024 & 2032
- Figure 51: Asia Pacific Cider Market Revenue (Million), by Distribution Channel 2024 & 2032
- Figure 52: Asia Pacific Cider Market Volume (Billion), by Distribution Channel 2024 & 2032
- Figure 53: Asia Pacific Cider Market Revenue Share (%), by Distribution Channel 2024 & 2032
- Figure 54: Asia Pacific Cider Market Volume Share (%), by Distribution Channel 2024 & 2032
- Figure 55: Asia Pacific Cider Market Revenue (Million), by Country 2024 & 2032
- Figure 56: Asia Pacific Cider Market Volume (Billion), by Country 2024 & 2032
- Figure 57: Asia Pacific Cider Market Revenue Share (%), by Country 2024 & 2032
- Figure 58: Asia Pacific Cider Market Volume Share (%), by Country 2024 & 2032
- Figure 59: South America Cider Market Revenue (Million), by Product Type 2024 & 2032
- Figure 60: South America Cider Market Volume (Billion), by Product Type 2024 & 2032
- Figure 61: South America Cider Market Revenue Share (%), by Product Type 2024 & 2032
- Figure 62: South America Cider Market Volume Share (%), by Product Type 2024 & 2032
- Figure 63: South America Cider Market Revenue (Million), by Distribution Channel 2024 & 2032
- Figure 64: South America Cider Market Volume (Billion), by Distribution Channel 2024 & 2032
- Figure 65: South America Cider Market Revenue Share (%), by Distribution Channel 2024 & 2032
- Figure 66: South America Cider Market Volume Share (%), by Distribution Channel 2024 & 2032
- Figure 67: South America Cider Market Revenue (Million), by Country 2024 & 2032
- Figure 68: South America Cider Market Volume (Billion), by Country 2024 & 2032
- Figure 69: South America Cider Market Revenue Share (%), by Country 2024 & 2032
- Figure 70: South America Cider Market Volume Share (%), by Country 2024 & 2032
- Figure 71: Middle East Cider Market Revenue (Million), by Product Type 2024 & 2032
- Figure 72: Middle East Cider Market Volume (Billion), by Product Type 2024 & 2032
- Figure 73: Middle East Cider Market Revenue Share (%), by Product Type 2024 & 2032
- Figure 74: Middle East Cider Market Volume Share (%), by Product Type 2024 & 2032
- Figure 75: Middle East Cider Market Revenue (Million), by Distribution Channel 2024 & 2032
- Figure 76: Middle East Cider Market Volume (Billion), by Distribution Channel 2024 & 2032
- Figure 77: Middle East Cider Market Revenue Share (%), by Distribution Channel 2024 & 2032
- Figure 78: Middle East Cider Market Volume Share (%), by Distribution Channel 2024 & 2032
- Figure 79: Middle East Cider Market Revenue (Million), by Country 2024 & 2032
- Figure 80: Middle East Cider Market Volume (Billion), by Country 2024 & 2032
- Figure 81: Middle East Cider Market Revenue Share (%), by Country 2024 & 2032
- Figure 82: Middle East Cider Market Volume Share (%), by Country 2024 & 2032
- Figure 83: South Africa Cider Market Revenue (Million), by Product Type 2024 & 2032
- Figure 84: South Africa Cider Market Volume (Billion), by Product Type 2024 & 2032
- Figure 85: South Africa Cider Market Revenue Share (%), by Product Type 2024 & 2032
- Figure 86: South Africa Cider Market Volume Share (%), by Product Type 2024 & 2032
- Figure 87: South Africa Cider Market Revenue (Million), by Distribution Channel 2024 & 2032
- Figure 88: South Africa Cider Market Volume (Billion), by Distribution Channel 2024 & 2032
- Figure 89: South Africa Cider Market Revenue Share (%), by Distribution Channel 2024 & 2032
- Figure 90: South Africa Cider Market Volume Share (%), by Distribution Channel 2024 & 2032
- Figure 91: South Africa Cider Market Revenue (Million), by Country 2024 & 2032
- Figure 92: South Africa Cider Market Volume (Billion), by Country 2024 & 2032
- Figure 93: South Africa Cider Market Revenue Share (%), by Country 2024 & 2032
- Figure 94: South Africa Cider Market Volume Share (%), by Country 2024 & 2032
List of Tables
- Table 1: Global Cider Market Revenue Million Forecast, by Region 2019 & 2032
- Table 2: Global Cider Market Volume Billion Forecast, by Region 2019 & 2032
- Table 3: Global Cider Market Revenue Million Forecast, by Product Type 2019 & 2032
- Table 4: Global Cider Market Volume Billion Forecast, by Product Type 2019 & 2032
- Table 5: Global Cider Market Revenue Million Forecast, by Distribution Channel 2019 & 2032
- Table 6: Global Cider Market Volume Billion Forecast, by Distribution Channel 2019 & 2032
- Table 7: Global Cider Market Revenue Million Forecast, by Region 2019 & 2032
- Table 8: Global Cider Market Volume Billion Forecast, by Region 2019 & 2032
- Table 9: Global Cider Market Revenue Million Forecast, by Country 2019 & 2032
- Table 10: Global Cider Market Volume Billion Forecast, by Country 2019 & 2032
- Table 11: United States Cider Market Revenue (Million) Forecast, by Application 2019 & 2032
- Table 12: United States Cider Market Volume (Billion) Forecast, by Application 2019 & 2032
- Table 13: Canada Cider Market Revenue (Million) Forecast, by Application 2019 & 2032
- Table 14: Canada Cider Market Volume (Billion) Forecast, by Application 2019 & 2032
- Table 15: Mexico Cider Market Revenue (Million) Forecast, by Application 2019 & 2032
- Table 16: Mexico Cider Market Volume (Billion) Forecast, by Application 2019 & 2032
- Table 17: Rest of North America Cider Market Revenue (Million) Forecast, by Application 2019 & 2032
- Table 18: Rest of North America Cider Market Volume (Billion) Forecast, by Application 2019 & 2032
- Table 19: Global Cider Market Revenue Million Forecast, by Country 2019 & 2032
- Table 20: Global Cider Market Volume Billion Forecast, by Country 2019 & 2032
- Table 21: United Kingdom Cider Market Revenue (Million) Forecast, by Application 2019 & 2032
- Table 22: United Kingdom Cider Market Volume (Billion) Forecast, by Application 2019 & 2032
- Table 23: Germany Cider Market Revenue (Million) Forecast, by Application 2019 & 2032
- Table 24: Germany Cider Market Volume (Billion) Forecast, by Application 2019 & 2032
- Table 25: France Cider Market Revenue (Million) Forecast, by Application 2019 & 2032
- Table 26: France Cider Market Volume (Billion) Forecast, by Application 2019 & 2032
- Table 27: Russia Cider Market Revenue (Million) Forecast, by Application 2019 & 2032
- Table 28: Russia Cider Market Volume (Billion) Forecast, by Application 2019 & 2032
- Table 29: Italy Cider Market Revenue (Million) Forecast, by Application 2019 & 2032
- Table 30: Italy Cider Market Volume (Billion) Forecast, by Application 2019 & 2032
- Table 31: Spain Cider Market Revenue (Million) Forecast, by Application 2019 & 2032
- Table 32: Spain Cider Market Volume (Billion) Forecast, by Application 2019 & 2032
- Table 33: Rest of Europe Cider Market Revenue (Million) Forecast, by Application 2019 & 2032
- Table 34: Rest of Europe Cider Market Volume (Billion) Forecast, by Application 2019 & 2032
- Table 35: Global Cider Market Revenue Million Forecast, by Country 2019 & 2032
- Table 36: Global Cider Market Volume Billion Forecast, by Country 2019 & 2032
- Table 37: India Cider Market Revenue (Million) Forecast, by Application 2019 & 2032
- Table 38: India Cider Market Volume (Billion) Forecast, by Application 2019 & 2032
- Table 39: China Cider Market Revenue (Million) Forecast, by Application 2019 & 2032
- Table 40: China Cider Market Volume (Billion) Forecast, by Application 2019 & 2032
- Table 41: Japan Cider Market Revenue (Million) Forecast, by Application 2019 & 2032
- Table 42: Japan Cider Market Volume (Billion) Forecast, by Application 2019 & 2032
- Table 43: Australia Cider Market Revenue (Million) Forecast, by Application 2019 & 2032
- Table 44: Australia Cider Market Volume (Billion) Forecast, by Application 2019 & 2032
- Table 45: Rest of Asia Pacific Cider Market Revenue (Million) Forecast, by Application 2019 & 2032
- Table 46: Rest of Asia Pacific Cider Market Volume (Billion) Forecast, by Application 2019 & 2032
- Table 47: Global Cider Market Revenue Million Forecast, by Country 2019 & 2032
- Table 48: Global Cider Market Volume Billion Forecast, by Country 2019 & 2032
- Table 49: Brazil Cider Market Revenue (Million) Forecast, by Application 2019 & 2032
- Table 50: Brazil Cider Market Volume (Billion) Forecast, by Application 2019 & 2032
- Table 51: Argentina Cider Market Revenue (Million) Forecast, by Application 2019 & 2032
- Table 52: Argentina Cider Market Volume (Billion) Forecast, by Application 2019 & 2032
- Table 53: Rest of South America Cider Market Revenue (Million) Forecast, by Application 2019 & 2032
- Table 54: Rest of South America Cider Market Volume (Billion) Forecast, by Application 2019 & 2032
- Table 55: Global Cider Market Revenue Million Forecast, by Country 2019 & 2032
- Table 56: Global Cider Market Volume Billion Forecast, by Country 2019 & 2032
- Table 57: UAE Cider Market Revenue (Million) Forecast, by Application 2019 & 2032
- Table 58: UAE Cider Market Volume (Billion) Forecast, by Application 2019 & 2032
- Table 59: South Africa Cider Market Revenue (Million) Forecast, by Application 2019 & 2032
- Table 60: South Africa Cider Market Volume (Billion) Forecast, by Application 2019 & 2032
- Table 61: Saudi Arabia Cider Market Revenue (Million) Forecast, by Application 2019 & 2032
- Table 62: Saudi Arabia Cider Market Volume (Billion) Forecast, by Application 2019 & 2032
- Table 63: Rest of MEA Cider Market Revenue (Million) Forecast, by Application 2019 & 2032
- Table 64: Rest of MEA Cider Market Volume (Billion) Forecast, by Application 2019 & 2032
- Table 65: Global Cider Market Revenue Million Forecast, by Product Type 2019 & 2032
- Table 66: Global Cider Market Volume Billion Forecast, by Product Type 2019 & 2032
- Table 67: Global Cider Market Revenue Million Forecast, by Distribution Channel 2019 & 2032
- Table 68: Global Cider Market Volume Billion Forecast, by Distribution Channel 2019 & 2032
- Table 69: Global Cider Market Revenue Million Forecast, by Country 2019 & 2032
- Table 70: Global Cider Market Volume Billion Forecast, by Country 2019 & 2032
- Table 71: United States Cider Market Revenue (Million) Forecast, by Application 2019 & 2032
- Table 72: United States Cider Market Volume (Billion) Forecast, by Application 2019 & 2032
- Table 73: Canada Cider Market Revenue (Million) Forecast, by Application 2019 & 2032
- Table 74: Canada Cider Market Volume (Billion) Forecast, by Application 2019 & 2032
- Table 75: Mexico Cider Market Revenue (Million) Forecast, by Application 2019 & 2032
- Table 76: Mexico Cider Market Volume (Billion) Forecast, by Application 2019 & 2032
- Table 77: Rest of North America Cider Market Revenue (Million) Forecast, by Application 2019 & 2032
- Table 78: Rest of North America Cider Market Volume (Billion) Forecast, by Application 2019 & 2032
- Table 79: Global Cider Market Revenue Million Forecast, by Product Type 2019 & 2032
- Table 80: Global Cider Market Volume Billion Forecast, by Product Type 2019 & 2032
- Table 81: Global Cider Market Revenue Million Forecast, by Distribution Channel 2019 & 2032
- Table 82: Global Cider Market Volume Billion Forecast, by Distribution Channel 2019 & 2032
- Table 83: Global Cider Market Revenue Million Forecast, by Country 2019 & 2032
- Table 84: Global Cider Market Volume Billion Forecast, by Country 2019 & 2032
- Table 85: United Kingdom Cider Market Revenue (Million) Forecast, by Application 2019 & 2032
- Table 86: United Kingdom Cider Market Volume (Billion) Forecast, by Application 2019 & 2032
- Table 87: Germany Cider Market Revenue (Million) Forecast, by Application 2019 & 2032
- Table 88: Germany Cider Market Volume (Billion) Forecast, by Application 2019 & 2032
- Table 89: France Cider Market Revenue (Million) Forecast, by Application 2019 & 2032
- Table 90: France Cider Market Volume (Billion) Forecast, by Application 2019 & 2032
- Table 91: Russia Cider Market Revenue (Million) Forecast, by Application 2019 & 2032
- Table 92: Russia Cider Market Volume (Billion) Forecast, by Application 2019 & 2032
- Table 93: Italy Cider Market Revenue (Million) Forecast, by Application 2019 & 2032
- Table 94: Italy Cider Market Volume (Billion) Forecast, by Application 2019 & 2032
- Table 95: Spain Cider Market Revenue (Million) Forecast, by Application 2019 & 2032
- Table 96: Spain Cider Market Volume (Billion) Forecast, by Application 2019 & 2032
- Table 97: Rest of Europe Cider Market Revenue (Million) Forecast, by Application 2019 & 2032
- Table 98: Rest of Europe Cider Market Volume (Billion) Forecast, by Application 2019 & 2032
- Table 99: Global Cider Market Revenue Million Forecast, by Product Type 2019 & 2032
- Table 100: Global Cider Market Volume Billion Forecast, by Product Type 2019 & 2032
- Table 101: Global Cider Market Revenue Million Forecast, by Distribution Channel 2019 & 2032
- Table 102: Global Cider Market Volume Billion Forecast, by Distribution Channel 2019 & 2032
- Table 103: Global Cider Market Revenue Million Forecast, by Country 2019 & 2032
- Table 104: Global Cider Market Volume Billion Forecast, by Country 2019 & 2032
- Table 105: India Cider Market Revenue (Million) Forecast, by Application 2019 & 2032
- Table 106: India Cider Market Volume (Billion) Forecast, by Application 2019 & 2032
- Table 107: China Cider Market Revenue (Million) Forecast, by Application 2019 & 2032
- Table 108: China Cider Market Volume (Billion) Forecast, by Application 2019 & 2032
- Table 109: Japan Cider Market Revenue (Million) Forecast, by Application 2019 & 2032
- Table 110: Japan Cider Market Volume (Billion) Forecast, by Application 2019 & 2032
- Table 111: Australia Cider Market Revenue (Million) Forecast, by Application 2019 & 2032
- Table 112: Australia Cider Market Volume (Billion) Forecast, by Application 2019 & 2032
- Table 113: Rest of Asia Pacific Cider Market Revenue (Million) Forecast, by Application 2019 & 2032
- Table 114: Rest of Asia Pacific Cider Market Volume (Billion) Forecast, by Application 2019 & 2032
- Table 115: Global Cider Market Revenue Million Forecast, by Product Type 2019 & 2032
- Table 116: Global Cider Market Volume Billion Forecast, by Product Type 2019 & 2032
- Table 117: Global Cider Market Revenue Million Forecast, by Distribution Channel 2019 & 2032
- Table 118: Global Cider Market Volume Billion Forecast, by Distribution Channel 2019 & 2032
- Table 119: Global Cider Market Revenue Million Forecast, by Country 2019 & 2032
- Table 120: Global Cider Market Volume Billion Forecast, by Country 2019 & 2032
- Table 121: Brazil Cider Market Revenue (Million) Forecast, by Application 2019 & 2032
- Table 122: Brazil Cider Market Volume (Billion) Forecast, by Application 2019 & 2032
- Table 123: Argentina Cider Market Revenue (Million) Forecast, by Application 2019 & 2032
- Table 124: Argentina Cider Market Volume (Billion) Forecast, by Application 2019 & 2032
- Table 125: Rest of South America Cider Market Revenue (Million) Forecast, by Application 2019 & 2032
- Table 126: Rest of South America Cider Market Volume (Billion) Forecast, by Application 2019 & 2032
- Table 127: Global Cider Market Revenue Million Forecast, by Product Type 2019 & 2032
- Table 128: Global Cider Market Volume Billion Forecast, by Product Type 2019 & 2032
- Table 129: Global Cider Market Revenue Million Forecast, by Distribution Channel 2019 & 2032
- Table 130: Global Cider Market Volume Billion Forecast, by Distribution Channel 2019 & 2032
- Table 131: Global Cider Market Revenue Million Forecast, by Country 2019 & 2032
- Table 132: Global Cider Market Volume Billion Forecast, by Country 2019 & 2032
- Table 133: Global Cider Market Revenue Million Forecast, by Product Type 2019 & 2032
- Table 134: Global Cider Market Volume Billion Forecast, by Product Type 2019 & 2032
- Table 135: Global Cider Market Revenue Million Forecast, by Distribution Channel 2019 & 2032
- Table 136: Global Cider Market Volume Billion Forecast, by Distribution Channel 2019 & 2032
- Table 137: Global Cider Market Revenue Million Forecast, by Country 2019 & 2032
- Table 138: Global Cider Market Volume Billion Forecast, by Country 2019 & 2032
- Table 139: Rest of Middle East Cider Market Revenue (Million) Forecast, by Application 2019 & 2032
- Table 140: Rest of Middle East Cider Market Volume (Billion) Forecast, by Application 2019 & 2032
Frequently Asked Questions
1. What is the projected Compound Annual Growth Rate (CAGR) of the Cider Market?
The projected CAGR is approximately 5.37%.
2. Which companies are prominent players in the Cider Market?
Key companies in the market include Angry Orchard Cider Company LLC, Asahi Premium Ltd, Molson Coors Brewing Company (Smith & Forge), Heineken N V, C&C Group plc*List Not Exhaustive, Seattle Cider Company, Carlsberg Breweries A/S, Agrial (Aston Manor Brewery), Woodchuck Cidery, Vander Mill Ciders.
3. What are the main segments of the Cider Market?
The market segments include Product Type, Distribution Channel.
4. Can you provide details about the market size?
The market size is estimated to be USD XX Million as of 2022.
5. What are some drivers contributing to market growth?
Growing Demand for Organic Ingredients in the Food Industry; Increasing Popularity of "Super Fruit" Ingredients in Functional Foods and Beverages.
6. What are the notable trends driving market growth?
Surge in Demand for Gluten-Free Alcoholic Beverages.
7. Are there any restraints impacting market growth?
Stringent Food Safety Regulations.
8. Can you provide examples of recent developments in the market?
N/A
9. What pricing options are available for accessing the report?
Pricing options include single-user, multi-user, and enterprise licenses priced at USD 4750, USD 5250, and USD 8750 respectively.
10. Is the market size provided in terms of value or volume?
The market size is provided in terms of value, measured in Million and volume, measured in Billion.
11. Are there any specific market keywords associated with the report?
Yes, the market keyword associated with the report is "Cider Market," which aids in identifying and referencing the specific market segment covered.
12. How do I determine which pricing option suits my needs best?
The pricing options vary based on user requirements and access needs. Individual users may opt for single-user licenses, while businesses requiring broader access may choose multi-user or enterprise licenses for cost-effective access to the report.
13. Are there any additional resources or data provided in the Cider Market report?
While the report offers comprehensive insights, it's advisable to review the specific contents or supplementary materials provided to ascertain if additional resources or data are available.
14. How can I stay updated on further developments or reports in the Cider Market?
To stay informed about further developments, trends, and reports in the Cider Market, consider subscribing to industry newsletters, following relevant companies and organizations, or regularly checking reputable industry news sources and publications.
Methodology
Step 1 - Identification of Relevant Samples Size from Population Database


Step 2 - Approaches for Defining Global Market Size (Value, Volume* & Price*)

Note*: In applicable scenarios
Step 3 - Data Sources
Primary Research
- Web Analytics
- Survey Reports
- Research Institute
- Latest Research Reports
- Opinion Leaders
Secondary Research
- Annual Reports
- White Paper
- Latest Press Release
- Industry Association
- Paid Database
- Investor Presentations

Step 4 - Data Triangulation
Involves using different sources of information in order to increase the validity of a study
These sources are likely to be stakeholders in a program - participants, other researchers, program staff, other community members, and so on.
Then we put all data in single framework & apply various statistical tools to find out the dynamic on the market.
During the analysis stage, feedback from the stakeholder groups would be compared to determine areas of agreement as well as areas of divergence


