
Key Insights
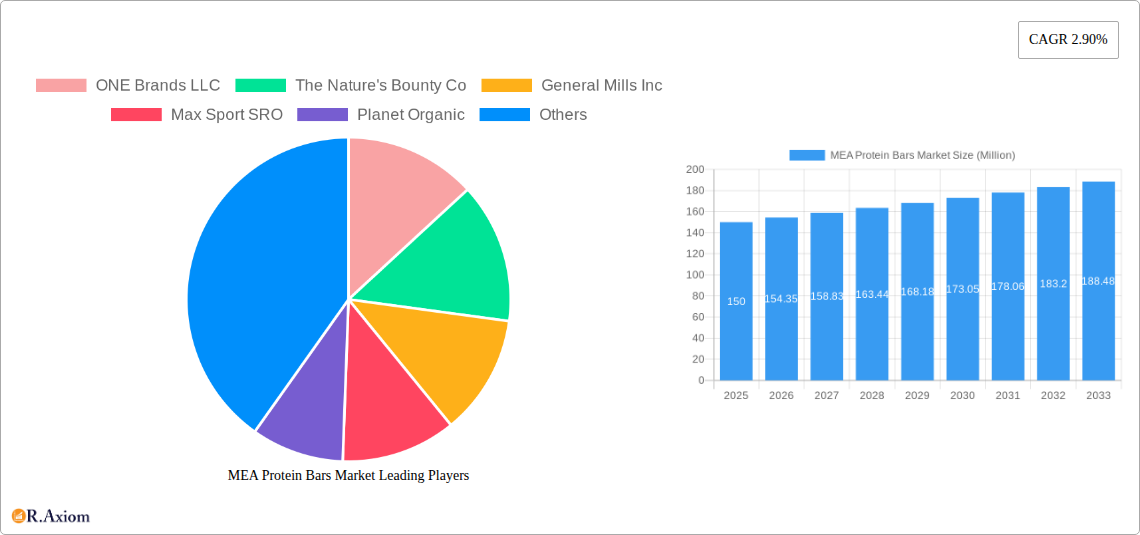
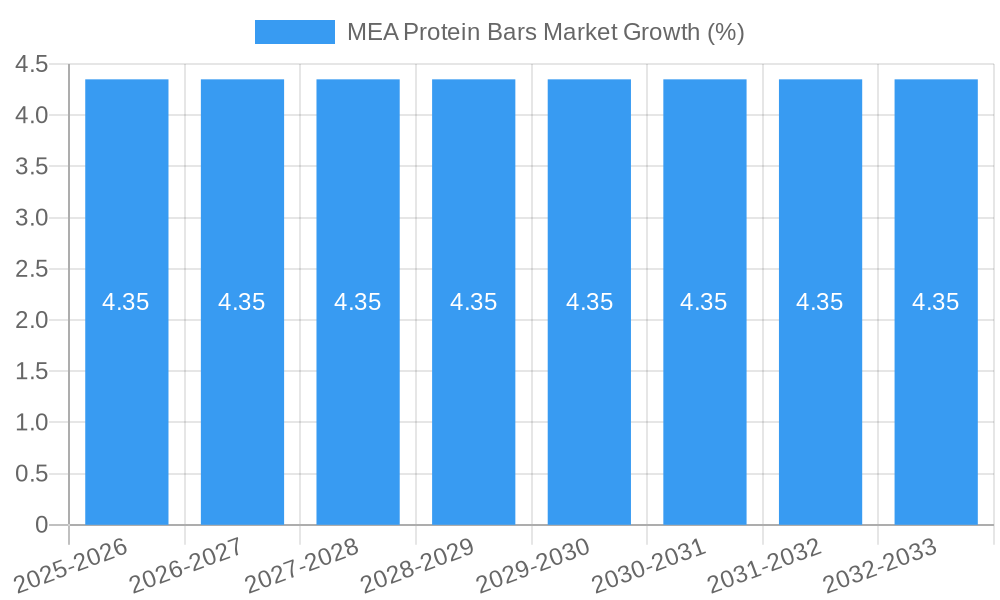
The Middle East and Africa (MEA) protein bar market is experiencing steady growth, projected to maintain a Compound Annual Growth Rate (CAGR) of 2.90% from 2025 to 2033. This growth is fueled by several key factors. The rising awareness of health and fitness among consumers in the region, coupled with the increasing prevalence of busy lifestyles demanding convenient nutritional options, is driving significant demand for protein bars. The expanding middle class in many MEA countries, with increased disposable income, further contributes to market expansion, as protein bars become more accessible and affordable. Furthermore, the growing popularity of fitness and sports activities, particularly among younger demographics, is boosting consumption. Strategic marketing campaigns by major players highlighting the convenience and nutritional benefits of protein bars are also contributing to market penetration. However, challenges remain, including fluctuating raw material prices and potential consumer skepticism about the nutritional claims of some brands. The market segmentation reveals strong growth in online channels reflecting the increasing penetration of e-commerce and preference for convenient home delivery. South Africa and Saudi Arabia currently dominate the regional market, indicating significant potential for future growth within these established consumer bases.
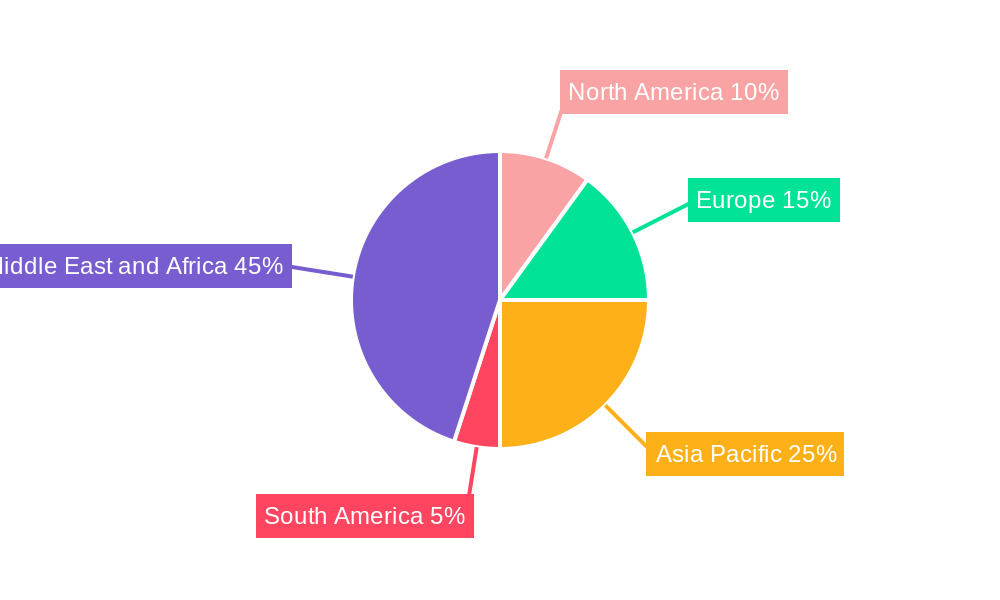
The segmentation of the MEA protein bar market by distribution channel reveals the dominance of supermarkets/hypermarkets, which offer convenience and wider product selection. However, online channels are gaining traction rapidly, reflecting the increasing influence of e-commerce and consumers’ preference for home delivery. The convenience store segment also presents a considerable opportunity due to its widespread accessibility, especially within urban areas. The regional market is geographically concentrated, with South Africa and Saudi Arabia commanding the largest market shares due to their well-established retail infrastructure and high consumer demand. The 'Rest of Middle East and Africa' segment presents a significant growth opportunity, as consumer awareness and disposable incomes increase in these emerging markets. The presence of established international players like General Mills and Nature's Bounty, coupled with emerging local brands, fosters competition and innovation within the MEA protein bar market, promising continuous growth and product diversification in the years to come.
MEA Protein Bars Market: A Comprehensive Market Report (2019-2033)
This detailed report provides a comprehensive analysis of the Middle East and Africa (MEA) protein bars market, offering invaluable insights for industry stakeholders, investors, and businesses seeking to understand and capitalize on this dynamic sector. The study covers the period from 2019 to 2033, with 2025 serving as the base year and estimated year. The report utilizes robust data and analysis to project market trends and growth opportunities from 2025 to 2033.
MEA Protein Bars Market Concentration & Innovation
The MEA protein bar market exhibits a moderately concentrated landscape, with a handful of major players holding significant market share. However, the market also showcases a vibrant ecosystem of smaller, specialized brands focusing on niche segments. Key players such as ONE Brands LLC, The Nature's Bounty Co, General Mills Inc, Max Sport SRO, Planet Organic, Barebells Functional Foods AB, Quest Nutrition LLC, and Grenade UK Ltd (List Not Exhaustive) contribute significantly to the overall market value. Market share analysis reveals that the top five players collectively hold approximately XX% of the market in 2025, while the remaining share is distributed amongst numerous smaller players. Innovation in the sector is primarily driven by the introduction of new flavors, functional ingredients (e.g., added vitamins and minerals), and sustainable packaging options. The regulatory environment, while generally favorable, is subject to evolving food safety standards and labeling regulations across different MEA countries. Product substitutes, including other convenient protein sources like protein shakes and energy bars, pose a competitive challenge. Consumer preferences are shifting towards healthier, organic, and ethically sourced options, forcing companies to adapt their product offerings. M&A activity has been moderate, with deal values estimated at approximately XX Million in the past five years, signaling a potential for further consolidation in the coming years.
MEA Protein Bars Market Industry Trends & Insights
The MEA protein bars market is witnessing robust growth, fueled by several key factors. The rising health consciousness among consumers, coupled with increasing awareness of the benefits of protein intake for fitness and overall well-being, is a significant driver. The increasing prevalence of gyms and fitness centers across the MEA region, combined with a growing middle class with greater disposable income, is further boosting market expansion. Technological advancements in protein bar manufacturing processes, leading to improved product quality, shelf life, and nutritional profile, also contribute to market expansion. The market is expected to witness a compound annual growth rate (CAGR) of XX% during the forecast period (2025-2033). Consumer preferences for convenient, on-the-go snack options, particularly among busy professionals and health-conscious individuals, are driving market penetration. Competitive dynamics are shaped by factors such as product innovation, branding, distribution networks, and pricing strategies. The market shows strong potential for growth but also faces challenges related to fluctuating raw material prices and changing consumer preferences.
Dominant Markets & Segments in MEA Protein Bars Market
The supermarkets/hypermarkets segment holds the largest market share within the MEA protein bars market distribution channels, accounting for approximately XX% in 2025. This is primarily driven by the wide reach of supermarkets and hypermarkets, their ability to stock a variety of brands, and consumer preference for purchasing groceries in these established channels. Online stores are showing rapid growth with a XX% market share in 2025, demonstrating increasing consumer adoption of e-commerce channels for grocery shopping.
- South Africa: South Africa is currently the leading national market for protein bars in the MEA region, driven by factors such as high health consciousness among consumers, a robust retail infrastructure, and increasing demand for convenient snack options.
- Saudi Arabia: Saudi Arabia showcases substantial growth potential due to increasing disposable income levels, a growing fitness-conscious population, and the burgeoning e-commerce sector.
- Rest of Middle East & Africa: This segment displays significant variations across individual countries due to factors such as varying economic conditions, consumer preferences, and levels of retail infrastructure development.
MEA Protein Bars Market Product Developments
Recent product innovations in the MEA protein bar market focus on creating healthier, more sustainable, and diverse options. This includes bars with increased protein content from various sources, improved taste profiles, incorporation of functional ingredients for specific health benefits (e.g., immunity boosting or weight management), and adoption of eco-friendly packaging solutions. These developments aim to meet diverse consumer needs and preferences while catering to broader sustainability concerns.
Report Scope & Segmentation Analysis
This report segments the MEA protein bars market based on distribution channels (supermarkets/hypermarkets, convenience stores, specialty retail stores, online stores, other distribution channels) and by country (South Africa, Saudi Arabia, Rest of Middle East & Africa). Each segment's analysis includes market size estimations, growth projections, and competitive landscape assessments for the forecast period (2025-2033). The detailed segmentation allows for targeted market analysis, highlighting growth potential and specific opportunities within each segment.
Key Drivers of MEA Protein Bars Market Growth
The growth of the MEA protein bars market is propelled by several factors. The rising health consciousness and awareness of the importance of protein consumption for fitness and overall well-being are key drivers. The increasing popularity of fitness activities and gym memberships further fuels demand. Furthermore, the growing prevalence of convenience stores and e-commerce platforms offering easy access to protein bars contributes significantly to market expansion. Favorable economic conditions in certain MEA countries also contribute to growth by increasing disposable incomes and consumer spending power.
Challenges in the MEA Protein Bars Market Sector
The MEA protein bar market faces challenges such as intense competition from established and emerging brands, leading to price pressures and reduced profit margins. Fluctuations in the price of raw materials, particularly protein sources, can impact the cost of production and overall profitability. Regulatory hurdles related to food safety and labeling requirements in different countries can complicate market entry and expansion for companies. Furthermore, supply chain disruptions can disrupt distribution and negatively impact market availability.
Emerging Opportunities in MEA Protein Bars Market
Emerging opportunities exist in expanding into underserved markets within the MEA region, particularly those with growing health-conscious populations and increasing disposable incomes. Developing innovative protein bar formulations with unique ingredients and health benefits (e.g., plant-based proteins, functional ingredients) will appeal to evolving consumer preferences. Leveraging e-commerce platforms for wider market reach and enhancing distribution networks will open up new avenues for sales and revenue generation.
Leading Players in the MEA Protein Bars Market Market
- ONE Brands LLC
- The Nature's Bounty Co
- General Mills Inc
- Max Sport SRO
- Planet Organic
- Barebells Functional Foods AB
- Quest Nutrition LLC
- Grenade UK Ltd
Key Developments in MEA Protein Bars Market Industry
- January 2023: Launch of a new line of organic protein bars by a major player in South Africa.
- June 2022: Acquisition of a smaller protein bar company by a larger multinational corporation in Saudi Arabia.
- September 2021: Introduction of a new protein bar flavor targeting the vegan market in the UAE.
Strategic Outlook for MEA Protein Bars Market Market
The MEA protein bars market presents a significant growth opportunity, driven by robust consumer demand and evolving market trends. Continued innovation, particularly in product formulations, packaging, and marketing strategies, will be critical for success. Strategic partnerships and collaborations, particularly with retailers and distributors, can enhance market reach and visibility. Focusing on sustainability initiatives and responding to evolving consumer preferences for healthier and ethically sourced products will help companies solidify their market position and benefit from the predicted market expansion.
MEA Protein Bars Market Segmentation
-
1. Distribution Channel
- 1.1. Supermarkets/Hypermarkets
- 1.2. Convenience Stores
- 1.3. Specialty Retail Stores
- 1.4. Online Stores
- 1.5. Other Distribution Channels
MEA Protein Bars Market Segmentation By Geography
-
1. North America
- 1.1. United States
- 1.2. Canada
- 1.3. Mexico
-
2. South America
- 2.1. Brazil
- 2.2. Argentina
- 2.3. Rest of South America
-
3. Europe
- 3.1. United Kingdom
- 3.2. Germany
- 3.3. France
- 3.4. Italy
- 3.5. Spain
- 3.6. Russia
- 3.7. Benelux
- 3.8. Nordics
- 3.9. Rest of Europe
-
4. Middle East & Africa
- 4.1. Turkey
- 4.2. Israel
- 4.3. GCC
- 4.4. North Africa
- 4.5. South Africa
- 4.6. Rest of Middle East & Africa
-
5. Asia Pacific
- 5.1. China
- 5.2. India
- 5.3. Japan
- 5.4. South Korea
- 5.5. ASEAN
- 5.6. Oceania
- 5.7. Rest of Asia Pacific
MEA Protein Bars Market REPORT HIGHLIGHTS
| Aspects | Details |
|---|---|
| Study Period | 2019-2033 |
| Base Year | 2024 |
| Estimated Year | 2025 |
| Forecast Period | 2025-2033 |
| Historical Period | 2019-2024 |
| Growth Rate | CAGR of 2.90% from 2019-2033 |
| Segmentation |
|
Table of Contents
- 1. Introduction
- 1.1. Research Scope
- 1.2. Market Segmentation
- 1.3. Research Methodology
- 1.4. Definitions and Assumptions
- 2. Executive Summary
- 2.1. Introduction
- 3. Market Dynamics
- 3.1. Introduction
- 3.2. Market Drivers
- 3.2.1. Increasing Trend of Consuming Cocktails; Rising Demand for Premium Spirits
- 3.3. Market Restrains
- 3.3.1. Affordability of the Product is Restraining the Market's Growth
- 3.4. Market Trends
- 3.4.1. Increasing Number of Health and Fitness Centers
- 4. Market Factor Analysis
- 4.1. Porters Five Forces
- 4.2. Supply/Value Chain
- 4.3. PESTEL analysis
- 4.4. Market Entropy
- 4.5. Patent/Trademark Analysis
- 5. Global MEA Protein Bars Market Analysis, Insights and Forecast, 2019-2031
- 5.1. Market Analysis, Insights and Forecast - by Distribution Channel
- 5.1.1. Supermarkets/Hypermarkets
- 5.1.2. Convenience Stores
- 5.1.3. Specialty Retail Stores
- 5.1.4. Online Stores
- 5.1.5. Other Distribution Channels
- 5.2. Market Analysis, Insights and Forecast - by Region
- 5.2.1. North America
- 5.2.2. South America
- 5.2.3. Europe
- 5.2.4. Middle East & Africa
- 5.2.5. Asia Pacific
- 5.1. Market Analysis, Insights and Forecast - by Distribution Channel
- 6. North America MEA Protein Bars Market Analysis, Insights and Forecast, 2019-2031
- 6.1. Market Analysis, Insights and Forecast - by Distribution Channel
- 6.1.1. Supermarkets/Hypermarkets
- 6.1.2. Convenience Stores
- 6.1.3. Specialty Retail Stores
- 6.1.4. Online Stores
- 6.1.5. Other Distribution Channels
- 6.1. Market Analysis, Insights and Forecast - by Distribution Channel
- 7. South America MEA Protein Bars Market Analysis, Insights and Forecast, 2019-2031
- 7.1. Market Analysis, Insights and Forecast - by Distribution Channel
- 7.1.1. Supermarkets/Hypermarkets
- 7.1.2. Convenience Stores
- 7.1.3. Specialty Retail Stores
- 7.1.4. Online Stores
- 7.1.5. Other Distribution Channels
- 7.1. Market Analysis, Insights and Forecast - by Distribution Channel
- 8. Europe MEA Protein Bars Market Analysis, Insights and Forecast, 2019-2031
- 8.1. Market Analysis, Insights and Forecast - by Distribution Channel
- 8.1.1. Supermarkets/Hypermarkets
- 8.1.2. Convenience Stores
- 8.1.3. Specialty Retail Stores
- 8.1.4. Online Stores
- 8.1.5. Other Distribution Channels
- 8.1. Market Analysis, Insights and Forecast - by Distribution Channel
- 9. Middle East & Africa MEA Protein Bars Market Analysis, Insights and Forecast, 2019-2031
- 9.1. Market Analysis, Insights and Forecast - by Distribution Channel
- 9.1.1. Supermarkets/Hypermarkets
- 9.1.2. Convenience Stores
- 9.1.3. Specialty Retail Stores
- 9.1.4. Online Stores
- 9.1.5. Other Distribution Channels
- 9.1. Market Analysis, Insights and Forecast - by Distribution Channel
- 10. Asia Pacific MEA Protein Bars Market Analysis, Insights and Forecast, 2019-2031
- 10.1. Market Analysis, Insights and Forecast - by Distribution Channel
- 10.1.1. Supermarkets/Hypermarkets
- 10.1.2. Convenience Stores
- 10.1.3. Specialty Retail Stores
- 10.1.4. Online Stores
- 10.1.5. Other Distribution Channels
- 10.1. Market Analysis, Insights and Forecast - by Distribution Channel
- 11. North America MEA Protein Bars Market Analysis, Insights and Forecast, 2019-2031
- 11.1. Market Analysis, Insights and Forecast - By Country/Sub-region
- 11.1.1 United States
- 11.1.2 Canada
- 11.1.3 Mexico
- 11.1.4 Rest of North America
- 12. Europe MEA Protein Bars Market Analysis, Insights and Forecast, 2019-2031
- 12.1. Market Analysis, Insights and Forecast - By Country/Sub-region
- 12.1.1 Spain
- 12.1.2 United Kingdom
- 12.1.3 Germany
- 12.1.4 France
- 12.1.5 Italy
- 12.1.6 Russia
- 12.1.7 Rest of Europe
- 13. Asia Pacific MEA Protein Bars Market Analysis, Insights and Forecast, 2019-2031
- 13.1. Market Analysis, Insights and Forecast - By Country/Sub-region
- 13.1.1 China
- 13.1.2 Japan
- 13.1.3 India
- 13.1.4 Australia
- 13.1.5 Rest of Asia Pacific
- 14. South America MEA Protein Bars Market Analysis, Insights and Forecast, 2019-2031
- 14.1. Market Analysis, Insights and Forecast - By Country/Sub-region
- 14.1.1 Brazil
- 14.1.2 Argentina
- 14.1.3 Rest of South America
- 15. Middle East and Africa MEA Protein Bars Market Analysis, Insights and Forecast, 2019-2031
- 15.1. Market Analysis, Insights and Forecast - By Country/Sub-region
- 15.1.1 United Arab Emirates
- 15.1.2 South Africa
- 15.1.3 Rest of Middle East and Africa
- 16. Competitive Analysis
- 16.1. Global Market Share Analysis 2024
- 16.2. Company Profiles
- 16.2.1 ONE Brands LLC
- 16.2.1.1. Overview
- 16.2.1.2. Products
- 16.2.1.3. SWOT Analysis
- 16.2.1.4. Recent Developments
- 16.2.1.5. Financials (Based on Availability)
- 16.2.2 The Nature's Bounty Co
- 16.2.2.1. Overview
- 16.2.2.2. Products
- 16.2.2.3. SWOT Analysis
- 16.2.2.4. Recent Developments
- 16.2.2.5. Financials (Based on Availability)
- 16.2.3 General Mills Inc
- 16.2.3.1. Overview
- 16.2.3.2. Products
- 16.2.3.3. SWOT Analysis
- 16.2.3.4. Recent Developments
- 16.2.3.5. Financials (Based on Availability)
- 16.2.4 Max Sport SRO
- 16.2.4.1. Overview
- 16.2.4.2. Products
- 16.2.4.3. SWOT Analysis
- 16.2.4.4. Recent Developments
- 16.2.4.5. Financials (Based on Availability)
- 16.2.5 Planet Organic
- 16.2.5.1. Overview
- 16.2.5.2. Products
- 16.2.5.3. SWOT Analysis
- 16.2.5.4. Recent Developments
- 16.2.5.5. Financials (Based on Availability)
- 16.2.6 Barebells Functional Foods AB
- 16.2.6.1. Overview
- 16.2.6.2. Products
- 16.2.6.3. SWOT Analysis
- 16.2.6.4. Recent Developments
- 16.2.6.5. Financials (Based on Availability)
- 16.2.7 Quest Nutrition LLC
- 16.2.7.1. Overview
- 16.2.7.2. Products
- 16.2.7.3. SWOT Analysis
- 16.2.7.4. Recent Developments
- 16.2.7.5. Financials (Based on Availability)
- 16.2.8 Grenade UK Ltd*List Not Exhaustive
- 16.2.8.1. Overview
- 16.2.8.2. Products
- 16.2.8.3. SWOT Analysis
- 16.2.8.4. Recent Developments
- 16.2.8.5. Financials (Based on Availability)
- 16.2.1 ONE Brands LLC
List of Figures
- Figure 1: Global MEA Protein Bars Market Revenue Breakdown (Million, %) by Region 2024 & 2032
- Figure 2: North America MEA Protein Bars Market Revenue (Million), by Country 2024 & 2032
- Figure 3: North America MEA Protein Bars Market Revenue Share (%), by Country 2024 & 2032
- Figure 4: Europe MEA Protein Bars Market Revenue (Million), by Country 2024 & 2032
- Figure 5: Europe MEA Protein Bars Market Revenue Share (%), by Country 2024 & 2032
- Figure 6: Asia Pacific MEA Protein Bars Market Revenue (Million), by Country 2024 & 2032
- Figure 7: Asia Pacific MEA Protein Bars Market Revenue Share (%), by Country 2024 & 2032
- Figure 8: South America MEA Protein Bars Market Revenue (Million), by Country 2024 & 2032
- Figure 9: South America MEA Protein Bars Market Revenue Share (%), by Country 2024 & 2032
- Figure 10: Middle East and Africa MEA Protein Bars Market Revenue (Million), by Country 2024 & 2032
- Figure 11: Middle East and Africa MEA Protein Bars Market Revenue Share (%), by Country 2024 & 2032
- Figure 12: North America MEA Protein Bars Market Revenue (Million), by Distribution Channel 2024 & 2032
- Figure 13: North America MEA Protein Bars Market Revenue Share (%), by Distribution Channel 2024 & 2032
- Figure 14: North America MEA Protein Bars Market Revenue (Million), by Country 2024 & 2032
- Figure 15: North America MEA Protein Bars Market Revenue Share (%), by Country 2024 & 2032
- Figure 16: South America MEA Protein Bars Market Revenue (Million), by Distribution Channel 2024 & 2032
- Figure 17: South America MEA Protein Bars Market Revenue Share (%), by Distribution Channel 2024 & 2032
- Figure 18: South America MEA Protein Bars Market Revenue (Million), by Country 2024 & 2032
- Figure 19: South America MEA Protein Bars Market Revenue Share (%), by Country 2024 & 2032
- Figure 20: Europe MEA Protein Bars Market Revenue (Million), by Distribution Channel 2024 & 2032
- Figure 21: Europe MEA Protein Bars Market Revenue Share (%), by Distribution Channel 2024 & 2032
- Figure 22: Europe MEA Protein Bars Market Revenue (Million), by Country 2024 & 2032
- Figure 23: Europe MEA Protein Bars Market Revenue Share (%), by Country 2024 & 2032
- Figure 24: Middle East & Africa MEA Protein Bars Market Revenue (Million), by Distribution Channel 2024 & 2032
- Figure 25: Middle East & Africa MEA Protein Bars Market Revenue Share (%), by Distribution Channel 2024 & 2032
- Figure 26: Middle East & Africa MEA Protein Bars Market Revenue (Million), by Country 2024 & 2032
- Figure 27: Middle East & Africa MEA Protein Bars Market Revenue Share (%), by Country 2024 & 2032
- Figure 28: Asia Pacific MEA Protein Bars Market Revenue (Million), by Distribution Channel 2024 & 2032
- Figure 29: Asia Pacific MEA Protein Bars Market Revenue Share (%), by Distribution Channel 2024 & 2032
- Figure 30: Asia Pacific MEA Protein Bars Market Revenue (Million), by Country 2024 & 2032
- Figure 31: Asia Pacific MEA Protein Bars Market Revenue Share (%), by Country 2024 & 2032
List of Tables
- Table 1: Global MEA Protein Bars Market Revenue Million Forecast, by Region 2019 & 2032
- Table 2: Global MEA Protein Bars Market Revenue Million Forecast, by Distribution Channel 2019 & 2032
- Table 3: Global MEA Protein Bars Market Revenue Million Forecast, by Region 2019 & 2032
- Table 4: Global MEA Protein Bars Market Revenue Million Forecast, by Country 2019 & 2032
- Table 5: United States MEA Protein Bars Market Revenue (Million) Forecast, by Application 2019 & 2032
- Table 6: Canada MEA Protein Bars Market Revenue (Million) Forecast, by Application 2019 & 2032
- Table 7: Mexico MEA Protein Bars Market Revenue (Million) Forecast, by Application 2019 & 2032
- Table 8: Rest of North America MEA Protein Bars Market Revenue (Million) Forecast, by Application 2019 & 2032
- Table 9: Global MEA Protein Bars Market Revenue Million Forecast, by Country 2019 & 2032
- Table 10: Spain MEA Protein Bars Market Revenue (Million) Forecast, by Application 2019 & 2032
- Table 11: United Kingdom MEA Protein Bars Market Revenue (Million) Forecast, by Application 2019 & 2032
- Table 12: Germany MEA Protein Bars Market Revenue (Million) Forecast, by Application 2019 & 2032
- Table 13: France MEA Protein Bars Market Revenue (Million) Forecast, by Application 2019 & 2032
- Table 14: Italy MEA Protein Bars Market Revenue (Million) Forecast, by Application 2019 & 2032
- Table 15: Russia MEA Protein Bars Market Revenue (Million) Forecast, by Application 2019 & 2032
- Table 16: Rest of Europe MEA Protein Bars Market Revenue (Million) Forecast, by Application 2019 & 2032
- Table 17: Global MEA Protein Bars Market Revenue Million Forecast, by Country 2019 & 2032
- Table 18: China MEA Protein Bars Market Revenue (Million) Forecast, by Application 2019 & 2032
- Table 19: Japan MEA Protein Bars Market Revenue (Million) Forecast, by Application 2019 & 2032
- Table 20: India MEA Protein Bars Market Revenue (Million) Forecast, by Application 2019 & 2032
- Table 21: Australia MEA Protein Bars Market Revenue (Million) Forecast, by Application 2019 & 2032
- Table 22: Rest of Asia Pacific MEA Protein Bars Market Revenue (Million) Forecast, by Application 2019 & 2032
- Table 23: Global MEA Protein Bars Market Revenue Million Forecast, by Country 2019 & 2032
- Table 24: Brazil MEA Protein Bars Market Revenue (Million) Forecast, by Application 2019 & 2032
- Table 25: Argentina MEA Protein Bars Market Revenue (Million) Forecast, by Application 2019 & 2032
- Table 26: Rest of South America MEA Protein Bars Market Revenue (Million) Forecast, by Application 2019 & 2032
- Table 27: Global MEA Protein Bars Market Revenue Million Forecast, by Country 2019 & 2032
- Table 28: United Arab Emirates MEA Protein Bars Market Revenue (Million) Forecast, by Application 2019 & 2032
- Table 29: South Africa MEA Protein Bars Market Revenue (Million) Forecast, by Application 2019 & 2032
- Table 30: Rest of Middle East and Africa MEA Protein Bars Market Revenue (Million) Forecast, by Application 2019 & 2032
- Table 31: Global MEA Protein Bars Market Revenue Million Forecast, by Distribution Channel 2019 & 2032
- Table 32: Global MEA Protein Bars Market Revenue Million Forecast, by Country 2019 & 2032
- Table 33: United States MEA Protein Bars Market Revenue (Million) Forecast, by Application 2019 & 2032
- Table 34: Canada MEA Protein Bars Market Revenue (Million) Forecast, by Application 2019 & 2032
- Table 35: Mexico MEA Protein Bars Market Revenue (Million) Forecast, by Application 2019 & 2032
- Table 36: Global MEA Protein Bars Market Revenue Million Forecast, by Distribution Channel 2019 & 2032
- Table 37: Global MEA Protein Bars Market Revenue Million Forecast, by Country 2019 & 2032
- Table 38: Brazil MEA Protein Bars Market Revenue (Million) Forecast, by Application 2019 & 2032
- Table 39: Argentina MEA Protein Bars Market Revenue (Million) Forecast, by Application 2019 & 2032
- Table 40: Rest of South America MEA Protein Bars Market Revenue (Million) Forecast, by Application 2019 & 2032
- Table 41: Global MEA Protein Bars Market Revenue Million Forecast, by Distribution Channel 2019 & 2032
- Table 42: Global MEA Protein Bars Market Revenue Million Forecast, by Country 2019 & 2032
- Table 43: United Kingdom MEA Protein Bars Market Revenue (Million) Forecast, by Application 2019 & 2032
- Table 44: Germany MEA Protein Bars Market Revenue (Million) Forecast, by Application 2019 & 2032
- Table 45: France MEA Protein Bars Market Revenue (Million) Forecast, by Application 2019 & 2032
- Table 46: Italy MEA Protein Bars Market Revenue (Million) Forecast, by Application 2019 & 2032
- Table 47: Spain MEA Protein Bars Market Revenue (Million) Forecast, by Application 2019 & 2032
- Table 48: Russia MEA Protein Bars Market Revenue (Million) Forecast, by Application 2019 & 2032
- Table 49: Benelux MEA Protein Bars Market Revenue (Million) Forecast, by Application 2019 & 2032
- Table 50: Nordics MEA Protein Bars Market Revenue (Million) Forecast, by Application 2019 & 2032
- Table 51: Rest of Europe MEA Protein Bars Market Revenue (Million) Forecast, by Application 2019 & 2032
- Table 52: Global MEA Protein Bars Market Revenue Million Forecast, by Distribution Channel 2019 & 2032
- Table 53: Global MEA Protein Bars Market Revenue Million Forecast, by Country 2019 & 2032
- Table 54: Turkey MEA Protein Bars Market Revenue (Million) Forecast, by Application 2019 & 2032
- Table 55: Israel MEA Protein Bars Market Revenue (Million) Forecast, by Application 2019 & 2032
- Table 56: GCC MEA Protein Bars Market Revenue (Million) Forecast, by Application 2019 & 2032
- Table 57: North Africa MEA Protein Bars Market Revenue (Million) Forecast, by Application 2019 & 2032
- Table 58: South Africa MEA Protein Bars Market Revenue (Million) Forecast, by Application 2019 & 2032
- Table 59: Rest of Middle East & Africa MEA Protein Bars Market Revenue (Million) Forecast, by Application 2019 & 2032
- Table 60: Global MEA Protein Bars Market Revenue Million Forecast, by Distribution Channel 2019 & 2032
- Table 61: Global MEA Protein Bars Market Revenue Million Forecast, by Country 2019 & 2032
- Table 62: China MEA Protein Bars Market Revenue (Million) Forecast, by Application 2019 & 2032
- Table 63: India MEA Protein Bars Market Revenue (Million) Forecast, by Application 2019 & 2032
- Table 64: Japan MEA Protein Bars Market Revenue (Million) Forecast, by Application 2019 & 2032
- Table 65: South Korea MEA Protein Bars Market Revenue (Million) Forecast, by Application 2019 & 2032
- Table 66: ASEAN MEA Protein Bars Market Revenue (Million) Forecast, by Application 2019 & 2032
- Table 67: Oceania MEA Protein Bars Market Revenue (Million) Forecast, by Application 2019 & 2032
- Table 68: Rest of Asia Pacific MEA Protein Bars Market Revenue (Million) Forecast, by Application 2019 & 2032
Frequently Asked Questions
1. What is the projected Compound Annual Growth Rate (CAGR) of the MEA Protein Bars Market?
The projected CAGR is approximately 2.90%.
2. Which companies are prominent players in the MEA Protein Bars Market?
Key companies in the market include ONE Brands LLC, The Nature's Bounty Co, General Mills Inc, Max Sport SRO, Planet Organic, Barebells Functional Foods AB, Quest Nutrition LLC, Grenade UK Ltd*List Not Exhaustive.
3. What are the main segments of the MEA Protein Bars Market?
The market segments include Distribution Channel.
4. Can you provide details about the market size?
The market size is estimated to be USD XX Million as of 2022.
5. What are some drivers contributing to market growth?
Increasing Trend of Consuming Cocktails; Rising Demand for Premium Spirits.
6. What are the notable trends driving market growth?
Increasing Number of Health and Fitness Centers.
7. Are there any restraints impacting market growth?
Affordability of the Product is Restraining the Market's Growth.
8. Can you provide examples of recent developments in the market?
N/A
9. What pricing options are available for accessing the report?
Pricing options include single-user, multi-user, and enterprise licenses priced at USD 4750, USD 4950, and USD 6800 respectively.
10. Is the market size provided in terms of value or volume?
The market size is provided in terms of value, measured in Million.
11. Are there any specific market keywords associated with the report?
Yes, the market keyword associated with the report is "MEA Protein Bars Market," which aids in identifying and referencing the specific market segment covered.
12. How do I determine which pricing option suits my needs best?
The pricing options vary based on user requirements and access needs. Individual users may opt for single-user licenses, while businesses requiring broader access may choose multi-user or enterprise licenses for cost-effective access to the report.
13. Are there any additional resources or data provided in the MEA Protein Bars Market report?
While the report offers comprehensive insights, it's advisable to review the specific contents or supplementary materials provided to ascertain if additional resources or data are available.
14. How can I stay updated on further developments or reports in the MEA Protein Bars Market?
To stay informed about further developments, trends, and reports in the MEA Protein Bars Market, consider subscribing to industry newsletters, following relevant companies and organizations, or regularly checking reputable industry news sources and publications.
Methodology
Step 1 - Identification of Relevant Samples Size from Population Database


Step 2 - Approaches for Defining Global Market Size (Value, Volume* & Price*)

Note*: In applicable scenarios
Step 3 - Data Sources
Primary Research
- Web Analytics
- Survey Reports
- Research Institute
- Latest Research Reports
- Opinion Leaders
Secondary Research
- Annual Reports
- White Paper
- Latest Press Release
- Industry Association
- Paid Database
- Investor Presentations

Step 4 - Data Triangulation
Involves using different sources of information in order to increase the validity of a study
These sources are likely to be stakeholders in a program - participants, other researchers, program staff, other community members, and so on.
Then we put all data in single framework & apply various statistical tools to find out the dynamic on the market.
During the analysis stage, feedback from the stakeholder groups would be compared to determine areas of agreement as well as areas of divergence


