
Key Insights
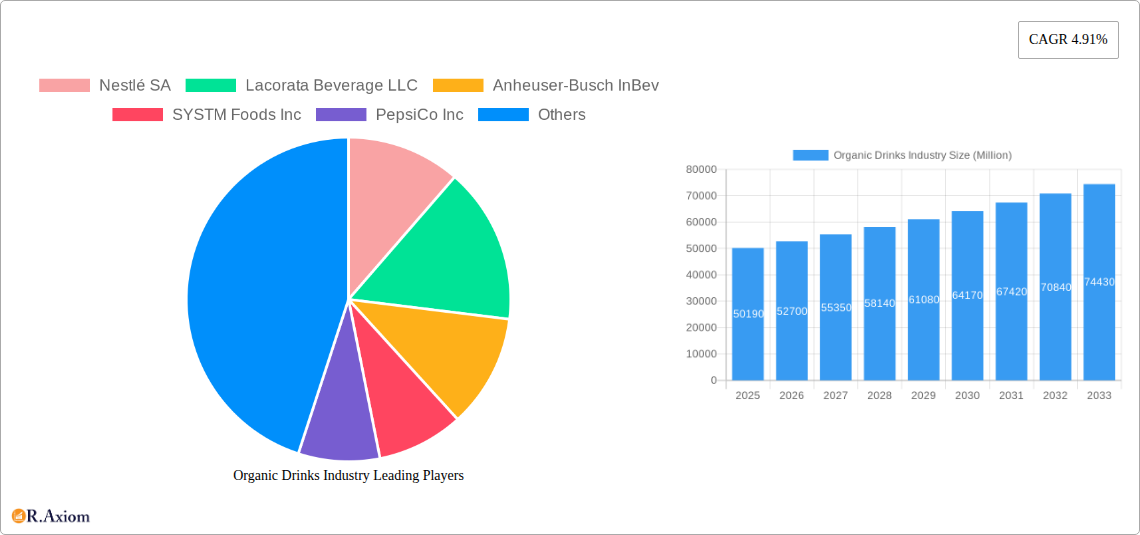
The global organic drinks market, valued at $50.19 billion in 2025, is projected to experience robust growth, driven by escalating consumer awareness of health and wellness, coupled with a rising preference for natural and sustainable products. The 4.91% CAGR from 2019 to 2024 indicates a steadily increasing demand for organic beverages across various product types, including alcoholic and non-alcoholic options. Key drivers include the growing popularity of functional beverages, enhanced consumer spending power in developed economies, and increasing distribution channels through supermarkets, convenience stores, online retailers, and specialized organic stores. The market segmentation reveals that supermarkets/hypermarkets are currently the largest distribution channel, though online retail channels are exhibiting significant growth potential, fueled by e-commerce expansion and improved online shopping experiences. While the market faces certain restraints such as higher production costs compared to conventional drinks and potential supply chain challenges related to organic farming practices, the overall positive trends associated with health consciousness and sustainable consumption patterns are expected to outweigh these limitations. Major players like Nestlé, PepsiCo, and Anheuser-Busch InBev are actively investing in the organic beverage sector, further contributing to market expansion. Regional market analysis suggests North America and Europe currently hold the largest market shares, but Asia-Pacific is expected to show significant growth over the forecast period due to rising disposable incomes and changing consumer lifestyles.
The forecast period from 2025 to 2033 anticipates continued market expansion, fueled by product innovation within the organic beverage segment. We expect to see increased diversification of offerings, including new flavor profiles, functional ingredients (e.g., probiotics, adaptogens), and sustainable packaging solutions. This diversification will cater to evolving consumer preferences and further drive market growth. The ongoing expansion of organic farming practices and increased accessibility through diverse distribution channels will also play a crucial role in shaping the market trajectory during this period. Competitive dynamics are likely to intensify, with existing players focusing on strategic acquisitions, brand extensions, and product innovation to maintain their market positions, while new entrants will try to capture market share through innovative product offerings and strategic partnerships. The overall market outlook remains positive, with substantial growth opportunities predicted for the organic drinks industry in the coming years.
Organic Drinks Industry: A Comprehensive Market Report (2019-2033)
This in-depth report provides a comprehensive analysis of the global organic drinks market, offering valuable insights for industry stakeholders, investors, and businesses seeking to capitalize on this rapidly expanding sector. The report covers the period from 2019 to 2033, with a focus on 2025 as the base and estimated year. It leverages extensive market research to deliver actionable intelligence on market size, growth drivers, challenges, opportunities, and key players. The global organic drinks market is projected to reach xx Million by 2033.
Organic Drinks Industry Market Concentration & Innovation
This section analyzes the market concentration, innovation drivers, regulatory landscape, product substitutes, end-user trends, and mergers & acquisitions (M&A) activity within the organic drinks industry. The market is characterized by a mix of large multinational corporations and smaller, specialized players.
Market Concentration: While precise market share data for each player requires detailed proprietary data, the industry shows a moderately concentrated structure with some major players holding significant shares. Nestlé SA, PepsiCo Inc, and Danone SA, for example, command substantial market presence through their diverse portfolios. However, numerous smaller, specialized organic beverage companies contribute significantly to market dynamism and innovation. The Herfindahl-Hirschman Index (HHI) for this market is estimated to be xx, suggesting a moderately consolidated market with room for competition.
Innovation Drivers: The organic drinks market is driven by increasing consumer demand for healthier and more sustainable beverage options. Innovation focuses on new flavors, functional ingredients (e.g., probiotics, adaptogens), sustainable packaging, and convenient formats (e.g., ready-to-drink (RTD) options).
Regulatory Frameworks: Government regulations concerning organic certification, labeling, and food safety significantly influence market dynamics. Variations in regulations across different countries present both challenges and opportunities for businesses.
Product Substitutes: The primary substitutes for organic drinks are conventional beverages. However, the growing health consciousness among consumers is shifting preferences towards healthier alternatives, including organic options.
End-User Trends: The increasing prevalence of health-conscious consumers, coupled with growing awareness of the environmental impact of conventional beverages, fuels demand for organic drinks. This trend is especially pronounced among millennials and Gen Z.
M&A Activity: The organic drinks market witnesses frequent M&A activity. For instance, Systm Foods' acquisition of Chameleon Organic Coffee in June 2022 underscores the strategic importance of this sector. While precise deal values for all M&A activities are not readily available, recent deals have ranged from xx Million to xx Million, reflecting industry consolidation and expansion strategies.
Organic Drinks Industry Industry Trends & Insights
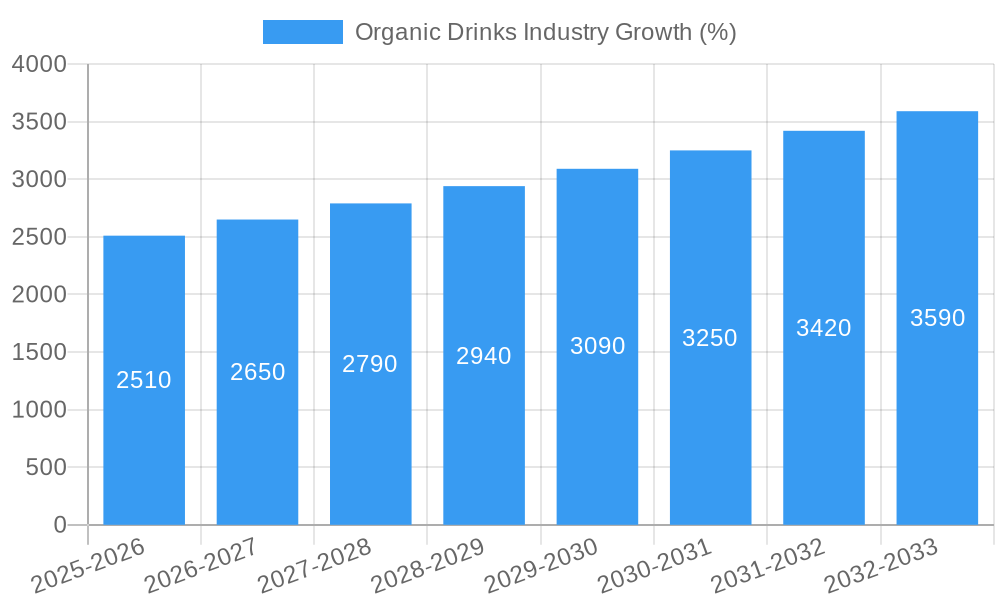
The organic drinks industry is experiencing robust growth, driven by several factors. The compound annual growth rate (CAGR) for the period 2019-2024 was approximately xx%, and it is projected to reach xx% during the forecast period (2025-2033). This growth is fueled by rising health awareness, increasing disposable incomes, changing consumer lifestyles, and the expanding distribution channels for organic products.
Technological advancements in production, packaging, and distribution further propel market expansion. The increasing adoption of sustainable packaging solutions and innovative manufacturing processes contributes to both environmental sustainability and enhanced product quality.
Consumer preferences are shifting towards organic and natural beverages, driven by a greater understanding of the health and environmental benefits. Demand for functional beverages, such as those enriched with vitamins, antioxidants, and probiotics, is also increasing, leading to product diversification and innovation. The competitive landscape is dynamic, with both established players and emerging companies competing to capture market share through product differentiation, branding, and strategic partnerships.
Dominant Markets & Segments in Organic Drinks Industry
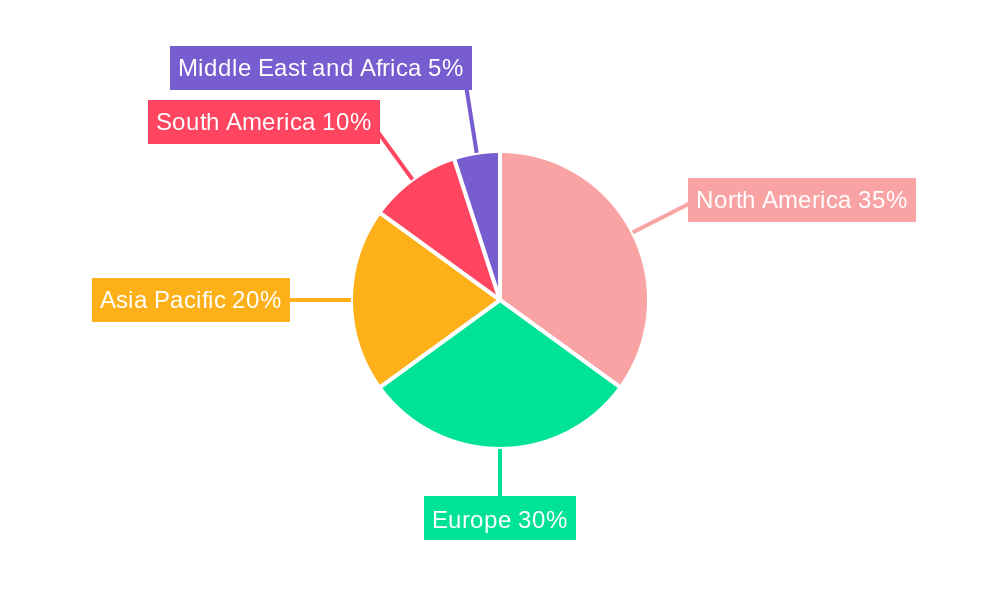
The organic drinks market exhibits regional variations in growth and dominance. North America and Europe currently hold significant market share, driven by high consumer awareness and disposable income. However, Asia-Pacific is experiencing rapid growth due to its expanding middle class and rising health consciousness.
Product Type: Non-alcoholic organic beverages (juices, teas, waters, etc.) dominate the market, accounting for a larger share compared to alcoholic organic drinks. The preference for health and wellness drives the non-alcoholic segment's higher demand.
Distribution Channel: Supermarkets/hypermarkets constitute the largest distribution channel for organic drinks, followed by convenience stores and specialist retailers. Online retailers are also gaining traction as consumers increasingly adopt e-commerce for grocery shopping.
Key Drivers (vary by region and segment):
- North America: High disposable incomes, health-conscious consumers, and well-established distribution networks.
- Europe: Stringent regulations promoting organic farming, growing environmental awareness, and preference for natural products.
- Asia-Pacific: Rapidly expanding middle class, increasing health consciousness, and significant potential for market expansion.
The dominance of each segment is primarily driven by consumer preferences, purchasing power, and the availability of organic products within respective regions and channels. Economic policies and infrastructure related to organic agriculture also influence market dynamics.
Organic Drinks Industry Product Developments
Recent product innovations highlight the industry's focus on consumer health and convenience. Ready-to-drink (RTD) organic beverages are gaining popularity due to their ease of consumption. The introduction of novel flavors and functional ingredients adds to product differentiation and appeals to diverse consumer preferences. Technological advancements in packaging, such as sustainable materials and innovative preservation techniques, address growing environmental concerns. These developments enhance the competitive advantage of brands that prioritize innovation and cater to evolving consumer needs. The market is witnessing an increased focus on personalized and customized beverage options to cater to individual dietary requirements and preferences.
Report Scope & Segmentation Analysis
This report segments the organic drinks market based on product type (alcoholic, non-alcoholic), and distribution channel (supermarkets/hypermarkets, convenience stores, specialist retailers, online retailers, other distribution channels). Each segment is analyzed based on its market size, growth rate, and competitive dynamics.
Product Type (Alcoholic): This segment comprises organic beer, wine, and spirits. The market size is comparatively smaller than the non-alcoholic segment but is projected to witness steady growth due to increasing demand for premium and healthier alcoholic options. Competitive dynamics are influenced by established players and emerging craft breweries and distilleries.
Product Type (Non-alcoholic): This segment includes organic juices, teas, waters, and other non-alcoholic beverages. It constitutes the largest market segment, driven by health consciousness and growing consumer preferences for natural alternatives. Competition in this segment is intense due to the presence of both large multinational corporations and smaller specialized brands.
Distribution Channels: Each distribution channel has specific market characteristics impacting reach, pricing, and competitive dynamics. Supermarkets/hypermarkets maintain the largest share, whereas online retailers exhibit the highest growth rate. Specialist retailers (health food stores, etc.) cater to a niche market, while convenience stores offer a convenient option but may have limited shelf space for organic products. Other distribution channels include direct-to-consumer sales and food service establishments.
Key Drivers of Organic Drinks Industry Growth
The organic drinks market's growth is driven by several factors:
Rising Health Consciousness: Consumers are increasingly aware of the health benefits of organic foods and beverages, leading to higher demand for organic drinks.
Growing Environmental Concerns: The shift towards sustainable lifestyles and reduced environmental impact is fueling the adoption of organic products.
Increased Disposable Incomes: Rising purchasing power in emerging economies is expanding the market for premium and organic products.
Technological Advancements: Innovations in packaging, production, and distribution are improving product quality, convenience, and sustainability.
Favorable Regulatory Policies: Government support for organic farming and labeling regulations contribute to market expansion.
Challenges in the Organic Drinks Industry Sector
The organic drinks industry faces several challenges:
Higher Production Costs: Organic farming is often more expensive than conventional farming, resulting in higher product prices. This can limit market accessibility for price-sensitive consumers.
Supply Chain Management: Maintaining a consistent supply of high-quality organic ingredients can be challenging, especially during periods of adverse weather conditions or disruptions in agricultural production.
Intense Competition: The market is characterized by intense competition among established players and new entrants, making it crucial for companies to differentiate their products and build strong brands.
Maintaining Organic Certifications: The certification processes and adherence to rigorous organic standards involve significant costs and administrative complexities.
Emerging Opportunities in Organic Drinks Industry
The organic drinks industry presents several emerging opportunities:
Functional Beverages: The growing demand for beverages with added health benefits, such as probiotics, antioxidants, and vitamins, creates opportunities for innovation.
Sustainable Packaging: Utilizing eco-friendly packaging materials and reducing plastic waste presents a significant opportunity for brands to enhance their sustainability profile.
Emerging Markets: Developing economies offer substantial growth potential, especially as consumers become increasingly health-conscious and wealthier.
Personalized Nutrition: The tailoring of beverages to meet individual consumer needs and dietary preferences is a growing trend.
Leading Players in the Organic Drinks Industry Market
- Nestlé SA
- Lacorata Beverage LLC
- Anheuser-Busch InBev
- SYSTM Foods Inc
- PepsiCo Inc
- Whitewave Foods Company
- James White Drinks
- Bison Organic Beer
- Danone SA
- Organic Valley
- PS Organic LLC
- Drake's Organic Spirits LLC
Key Developments in Organic Drinks Industry Industry
June 2022: Systm Foods acquired Chameleon Organic Coffee from Nestlé USA, expanding its portfolio of ready-to-drink organic beverages.
March 2022: Graasi Barley Water launched a new line of ready-to-drink organic waters with diverse flavors.
March 2022: Anheuser-Busch InBev introduced a new line of coconut water-infused hard seltzers under its Michelob Ultra brand.
Strategic Outlook for Organic Drinks Industry Market
The organic drinks market is poised for continued growth, fueled by long-term trends such as increasing health consciousness, heightened environmental awareness, and the rising popularity of convenient, ready-to-drink options. Innovative product development, sustainable practices, and effective marketing strategies will be key success factors for companies in this competitive landscape. The market's future will be shaped by the increasing demand for functional and personalized beverages that align with the growing interest in wellness and sustainability. Strategic partnerships and mergers and acquisitions will also play a significant role in shaping the industry's structure and driving further growth.
Organic Drinks Industry Segmentation
-
1. Product Type
-
1.1. Alcoholic
- 1.1.1. Wine
- 1.1.2. Beer
- 1.1.3. Spirits
- 1.1.4. Other Alcoholic Beverages
-
1.2. Non-alcoholic
- 1.2.1. Fruit and Vegetable Juices
- 1.2.2. Dairy
- 1.2.3. Coffee and Tea
- 1.2.4. Other Non-alcoholic Beverages
-
1.1. Alcoholic
-
2. Distribution Channel
- 2.1. Supermarkets/Hypermarkets
- 2.2. Convenience Stores
- 2.3. Specialist Retailers
- 2.4. Online Retailers
- 2.5. Other Distribution Channels
Organic Drinks Industry Segmentation By Geography
-
1. North America
- 1.1. United States
- 1.2. Canada
- 1.3. Mexico
- 1.4. Rest of North America
-
2. Europe
- 2.1. Spain
- 2.2. United Kingdom
- 2.3. Germany
- 2.4. France
- 2.5. Italy
- 2.6. Russia
- 2.7. Rest of Europe
-
3. Asia Pacific
- 3.1. China
- 3.2. Japan
- 3.3. India
- 3.4. Australia
- 3.5. Rest of Asia Pacific
-
4. South America
- 4.1. Brazil
- 4.2. Argentina
- 4.3. Rest of South America
-
5. Middle East and Africa
- 5.1. South Africa
- 5.2. United Arab Emirates
- 5.3. Rest of Middle East and Africa
Organic Drinks Industry REPORT HIGHLIGHTS
| Aspects | Details |
|---|---|
| Study Period | 2019-2033 |
| Base Year | 2024 |
| Estimated Year | 2025 |
| Forecast Period | 2025-2033 |
| Historical Period | 2019-2024 |
| Growth Rate | CAGR of 4.91% from 2019-2033 |
| Segmentation |
|
Table of Contents
- 1. Introduction
- 1.1. Research Scope
- 1.2. Market Segmentation
- 1.3. Research Methodology
- 1.4. Definitions and Assumptions
- 2. Executive Summary
- 2.1. Introduction
- 3. Market Dynamics
- 3.1. Introduction
- 3.2. Market Drivers
- 3.2.1. Growing Demand for Nutricosmetics Among Millennials; Growing Beauty and Wellness Trend
- 3.3. Market Restrains
- 3.3.1. Stringent Government Regulations and Product Guidelines
- 3.4. Market Trends
- 3.4.1. Health-conscious consumers are increasingly demanding organic beverages
- 4. Market Factor Analysis
- 4.1. Porters Five Forces
- 4.2. Supply/Value Chain
- 4.3. PESTEL analysis
- 4.4. Market Entropy
- 4.5. Patent/Trademark Analysis
- 5. Global Organic Drinks Industry Analysis, Insights and Forecast, 2019-2031
- 5.1. Market Analysis, Insights and Forecast - by Product Type
- 5.1.1. Alcoholic
- 5.1.1.1. Wine
- 5.1.1.2. Beer
- 5.1.1.3. Spirits
- 5.1.1.4. Other Alcoholic Beverages
- 5.1.2. Non-alcoholic
- 5.1.2.1. Fruit and Vegetable Juices
- 5.1.2.2. Dairy
- 5.1.2.3. Coffee and Tea
- 5.1.2.4. Other Non-alcoholic Beverages
- 5.1.1. Alcoholic
- 5.2. Market Analysis, Insights and Forecast - by Distribution Channel
- 5.2.1. Supermarkets/Hypermarkets
- 5.2.2. Convenience Stores
- 5.2.3. Specialist Retailers
- 5.2.4. Online Retailers
- 5.2.5. Other Distribution Channels
- 5.3. Market Analysis, Insights and Forecast - by Region
- 5.3.1. North America
- 5.3.2. Europe
- 5.3.3. Asia Pacific
- 5.3.4. South America
- 5.3.5. Middle East and Africa
- 5.1. Market Analysis, Insights and Forecast - by Product Type
- 6. North America Organic Drinks Industry Analysis, Insights and Forecast, 2019-2031
- 6.1. Market Analysis, Insights and Forecast - by Product Type
- 6.1.1. Alcoholic
- 6.1.1.1. Wine
- 6.1.1.2. Beer
- 6.1.1.3. Spirits
- 6.1.1.4. Other Alcoholic Beverages
- 6.1.2. Non-alcoholic
- 6.1.2.1. Fruit and Vegetable Juices
- 6.1.2.2. Dairy
- 6.1.2.3. Coffee and Tea
- 6.1.2.4. Other Non-alcoholic Beverages
- 6.1.1. Alcoholic
- 6.2. Market Analysis, Insights and Forecast - by Distribution Channel
- 6.2.1. Supermarkets/Hypermarkets
- 6.2.2. Convenience Stores
- 6.2.3. Specialist Retailers
- 6.2.4. Online Retailers
- 6.2.5. Other Distribution Channels
- 6.1. Market Analysis, Insights and Forecast - by Product Type
- 7. Europe Organic Drinks Industry Analysis, Insights and Forecast, 2019-2031
- 7.1. Market Analysis, Insights and Forecast - by Product Type
- 7.1.1. Alcoholic
- 7.1.1.1. Wine
- 7.1.1.2. Beer
- 7.1.1.3. Spirits
- 7.1.1.4. Other Alcoholic Beverages
- 7.1.2. Non-alcoholic
- 7.1.2.1. Fruit and Vegetable Juices
- 7.1.2.2. Dairy
- 7.1.2.3. Coffee and Tea
- 7.1.2.4. Other Non-alcoholic Beverages
- 7.1.1. Alcoholic
- 7.2. Market Analysis, Insights and Forecast - by Distribution Channel
- 7.2.1. Supermarkets/Hypermarkets
- 7.2.2. Convenience Stores
- 7.2.3. Specialist Retailers
- 7.2.4. Online Retailers
- 7.2.5. Other Distribution Channels
- 7.1. Market Analysis, Insights and Forecast - by Product Type
- 8. Asia Pacific Organic Drinks Industry Analysis, Insights and Forecast, 2019-2031
- 8.1. Market Analysis, Insights and Forecast - by Product Type
- 8.1.1. Alcoholic
- 8.1.1.1. Wine
- 8.1.1.2. Beer
- 8.1.1.3. Spirits
- 8.1.1.4. Other Alcoholic Beverages
- 8.1.2. Non-alcoholic
- 8.1.2.1. Fruit and Vegetable Juices
- 8.1.2.2. Dairy
- 8.1.2.3. Coffee and Tea
- 8.1.2.4. Other Non-alcoholic Beverages
- 8.1.1. Alcoholic
- 8.2. Market Analysis, Insights and Forecast - by Distribution Channel
- 8.2.1. Supermarkets/Hypermarkets
- 8.2.2. Convenience Stores
- 8.2.3. Specialist Retailers
- 8.2.4. Online Retailers
- 8.2.5. Other Distribution Channels
- 8.1. Market Analysis, Insights and Forecast - by Product Type
- 9. South America Organic Drinks Industry Analysis, Insights and Forecast, 2019-2031
- 9.1. Market Analysis, Insights and Forecast - by Product Type
- 9.1.1. Alcoholic
- 9.1.1.1. Wine
- 9.1.1.2. Beer
- 9.1.1.3. Spirits
- 9.1.1.4. Other Alcoholic Beverages
- 9.1.2. Non-alcoholic
- 9.1.2.1. Fruit and Vegetable Juices
- 9.1.2.2. Dairy
- 9.1.2.3. Coffee and Tea
- 9.1.2.4. Other Non-alcoholic Beverages
- 9.1.1. Alcoholic
- 9.2. Market Analysis, Insights and Forecast - by Distribution Channel
- 9.2.1. Supermarkets/Hypermarkets
- 9.2.2. Convenience Stores
- 9.2.3. Specialist Retailers
- 9.2.4. Online Retailers
- 9.2.5. Other Distribution Channels
- 9.1. Market Analysis, Insights and Forecast - by Product Type
- 10. Middle East and Africa Organic Drinks Industry Analysis, Insights and Forecast, 2019-2031
- 10.1. Market Analysis, Insights and Forecast - by Product Type
- 10.1.1. Alcoholic
- 10.1.1.1. Wine
- 10.1.1.2. Beer
- 10.1.1.3. Spirits
- 10.1.1.4. Other Alcoholic Beverages
- 10.1.2. Non-alcoholic
- 10.1.2.1. Fruit and Vegetable Juices
- 10.1.2.2. Dairy
- 10.1.2.3. Coffee and Tea
- 10.1.2.4. Other Non-alcoholic Beverages
- 10.1.1. Alcoholic
- 10.2. Market Analysis, Insights and Forecast - by Distribution Channel
- 10.2.1. Supermarkets/Hypermarkets
- 10.2.2. Convenience Stores
- 10.2.3. Specialist Retailers
- 10.2.4. Online Retailers
- 10.2.5. Other Distribution Channels
- 10.1. Market Analysis, Insights and Forecast - by Product Type
- 11. North America Organic Drinks Industry Analysis, Insights and Forecast, 2019-2031
- 11.1. Market Analysis, Insights and Forecast - By Country/Sub-region
- 11.1.1 United States
- 11.1.2 Canada
- 11.1.3 Mexico
- 11.1.4 Rest of North America
- 12. Europe Organic Drinks Industry Analysis, Insights and Forecast, 2019-2031
- 12.1. Market Analysis, Insights and Forecast - By Country/Sub-region
- 12.1.1 Spain
- 12.1.2 United Kingdom
- 12.1.3 Germany
- 12.1.4 France
- 12.1.5 Italy
- 12.1.6 Russia
- 12.1.7 Rest of Europe
- 13. Asia Pacific Organic Drinks Industry Analysis, Insights and Forecast, 2019-2031
- 13.1. Market Analysis, Insights and Forecast - By Country/Sub-region
- 13.1.1 China
- 13.1.2 Japan
- 13.1.3 India
- 13.1.4 Australia
- 13.1.5 Rest of Asia Pacific
- 14. South America Organic Drinks Industry Analysis, Insights and Forecast, 2019-2031
- 14.1. Market Analysis, Insights and Forecast - By Country/Sub-region
- 14.1.1 Brazil
- 14.1.2 Argentina
- 14.1.3 Rest of South America
- 15. Middle East and Africa Organic Drinks Industry Analysis, Insights and Forecast, 2019-2031
- 15.1. Market Analysis, Insights and Forecast - By Country/Sub-region
- 15.1.1 South Africa
- 15.1.2 United Arab Emirates
- 15.1.3 Rest of Middle East and Africa
- 16. Competitive Analysis
- 16.1. Global Market Share Analysis 2024
- 16.2. Company Profiles
- 16.2.1 Nestlé SA
- 16.2.1.1. Overview
- 16.2.1.2. Products
- 16.2.1.3. SWOT Analysis
- 16.2.1.4. Recent Developments
- 16.2.1.5. Financials (Based on Availability)
- 16.2.2 Lacorata Beverage LLC
- 16.2.2.1. Overview
- 16.2.2.2. Products
- 16.2.2.3. SWOT Analysis
- 16.2.2.4. Recent Developments
- 16.2.2.5. Financials (Based on Availability)
- 16.2.3 Anheuser-Busch InBev
- 16.2.3.1. Overview
- 16.2.3.2. Products
- 16.2.3.3. SWOT Analysis
- 16.2.3.4. Recent Developments
- 16.2.3.5. Financials (Based on Availability)
- 16.2.4 SYSTM Foods Inc
- 16.2.4.1. Overview
- 16.2.4.2. Products
- 16.2.4.3. SWOT Analysis
- 16.2.4.4. Recent Developments
- 16.2.4.5. Financials (Based on Availability)
- 16.2.5 PepsiCo Inc
- 16.2.5.1. Overview
- 16.2.5.2. Products
- 16.2.5.3. SWOT Analysis
- 16.2.5.4. Recent Developments
- 16.2.5.5. Financials (Based on Availability)
- 16.2.6 Whitewave Foods Company
- 16.2.6.1. Overview
- 16.2.6.2. Products
- 16.2.6.3. SWOT Analysis
- 16.2.6.4. Recent Developments
- 16.2.6.5. Financials (Based on Availability)
- 16.2.7 James White Drinks
- 16.2.7.1. Overview
- 16.2.7.2. Products
- 16.2.7.3. SWOT Analysis
- 16.2.7.4. Recent Developments
- 16.2.7.5. Financials (Based on Availability)
- 16.2.8 Bison Organic Beer
- 16.2.8.1. Overview
- 16.2.8.2. Products
- 16.2.8.3. SWOT Analysis
- 16.2.8.4. Recent Developments
- 16.2.8.5. Financials (Based on Availability)
- 16.2.9 Danone SA
- 16.2.9.1. Overview
- 16.2.9.2. Products
- 16.2.9.3. SWOT Analysis
- 16.2.9.4. Recent Developments
- 16.2.9.5. Financials (Based on Availability)
- 16.2.10 Organic Valley*List Not Exhaustive
- 16.2.10.1. Overview
- 16.2.10.2. Products
- 16.2.10.3. SWOT Analysis
- 16.2.10.4. Recent Developments
- 16.2.10.5. Financials (Based on Availability)
- 16.2.11 PS Organic LLC
- 16.2.11.1. Overview
- 16.2.11.2. Products
- 16.2.11.3. SWOT Analysis
- 16.2.11.4. Recent Developments
- 16.2.11.5. Financials (Based on Availability)
- 16.2.12 Drake's Organic Spirits LLC
- 16.2.12.1. Overview
- 16.2.12.2. Products
- 16.2.12.3. SWOT Analysis
- 16.2.12.4. Recent Developments
- 16.2.12.5. Financials (Based on Availability)
- 16.2.1 Nestlé SA
List of Figures
- Figure 1: Global Organic Drinks Industry Revenue Breakdown (Million, %) by Region 2024 & 2032
- Figure 2: Global Organic Drinks Industry Volume Breakdown (liter , %) by Region 2024 & 2032
- Figure 3: North America Organic Drinks Industry Revenue (Million), by Country 2024 & 2032
- Figure 4: North America Organic Drinks Industry Volume (liter ), by Country 2024 & 2032
- Figure 5: North America Organic Drinks Industry Revenue Share (%), by Country 2024 & 2032
- Figure 6: North America Organic Drinks Industry Volume Share (%), by Country 2024 & 2032
- Figure 7: Europe Organic Drinks Industry Revenue (Million), by Country 2024 & 2032
- Figure 8: Europe Organic Drinks Industry Volume (liter ), by Country 2024 & 2032
- Figure 9: Europe Organic Drinks Industry Revenue Share (%), by Country 2024 & 2032
- Figure 10: Europe Organic Drinks Industry Volume Share (%), by Country 2024 & 2032
- Figure 11: Asia Pacific Organic Drinks Industry Revenue (Million), by Country 2024 & 2032
- Figure 12: Asia Pacific Organic Drinks Industry Volume (liter ), by Country 2024 & 2032
- Figure 13: Asia Pacific Organic Drinks Industry Revenue Share (%), by Country 2024 & 2032
- Figure 14: Asia Pacific Organic Drinks Industry Volume Share (%), by Country 2024 & 2032
- Figure 15: South America Organic Drinks Industry Revenue (Million), by Country 2024 & 2032
- Figure 16: South America Organic Drinks Industry Volume (liter ), by Country 2024 & 2032
- Figure 17: South America Organic Drinks Industry Revenue Share (%), by Country 2024 & 2032
- Figure 18: South America Organic Drinks Industry Volume Share (%), by Country 2024 & 2032
- Figure 19: Middle East and Africa Organic Drinks Industry Revenue (Million), by Country 2024 & 2032
- Figure 20: Middle East and Africa Organic Drinks Industry Volume (liter ), by Country 2024 & 2032
- Figure 21: Middle East and Africa Organic Drinks Industry Revenue Share (%), by Country 2024 & 2032
- Figure 22: Middle East and Africa Organic Drinks Industry Volume Share (%), by Country 2024 & 2032
- Figure 23: North America Organic Drinks Industry Revenue (Million), by Product Type 2024 & 2032
- Figure 24: North America Organic Drinks Industry Volume (liter ), by Product Type 2024 & 2032
- Figure 25: North America Organic Drinks Industry Revenue Share (%), by Product Type 2024 & 2032
- Figure 26: North America Organic Drinks Industry Volume Share (%), by Product Type 2024 & 2032
- Figure 27: North America Organic Drinks Industry Revenue (Million), by Distribution Channel 2024 & 2032
- Figure 28: North America Organic Drinks Industry Volume (liter ), by Distribution Channel 2024 & 2032
- Figure 29: North America Organic Drinks Industry Revenue Share (%), by Distribution Channel 2024 & 2032
- Figure 30: North America Organic Drinks Industry Volume Share (%), by Distribution Channel 2024 & 2032
- Figure 31: North America Organic Drinks Industry Revenue (Million), by Country 2024 & 2032
- Figure 32: North America Organic Drinks Industry Volume (liter ), by Country 2024 & 2032
- Figure 33: North America Organic Drinks Industry Revenue Share (%), by Country 2024 & 2032
- Figure 34: North America Organic Drinks Industry Volume Share (%), by Country 2024 & 2032
- Figure 35: Europe Organic Drinks Industry Revenue (Million), by Product Type 2024 & 2032
- Figure 36: Europe Organic Drinks Industry Volume (liter ), by Product Type 2024 & 2032
- Figure 37: Europe Organic Drinks Industry Revenue Share (%), by Product Type 2024 & 2032
- Figure 38: Europe Organic Drinks Industry Volume Share (%), by Product Type 2024 & 2032
- Figure 39: Europe Organic Drinks Industry Revenue (Million), by Distribution Channel 2024 & 2032
- Figure 40: Europe Organic Drinks Industry Volume (liter ), by Distribution Channel 2024 & 2032
- Figure 41: Europe Organic Drinks Industry Revenue Share (%), by Distribution Channel 2024 & 2032
- Figure 42: Europe Organic Drinks Industry Volume Share (%), by Distribution Channel 2024 & 2032
- Figure 43: Europe Organic Drinks Industry Revenue (Million), by Country 2024 & 2032
- Figure 44: Europe Organic Drinks Industry Volume (liter ), by Country 2024 & 2032
- Figure 45: Europe Organic Drinks Industry Revenue Share (%), by Country 2024 & 2032
- Figure 46: Europe Organic Drinks Industry Volume Share (%), by Country 2024 & 2032
- Figure 47: Asia Pacific Organic Drinks Industry Revenue (Million), by Product Type 2024 & 2032
- Figure 48: Asia Pacific Organic Drinks Industry Volume (liter ), by Product Type 2024 & 2032
- Figure 49: Asia Pacific Organic Drinks Industry Revenue Share (%), by Product Type 2024 & 2032
- Figure 50: Asia Pacific Organic Drinks Industry Volume Share (%), by Product Type 2024 & 2032
- Figure 51: Asia Pacific Organic Drinks Industry Revenue (Million), by Distribution Channel 2024 & 2032
- Figure 52: Asia Pacific Organic Drinks Industry Volume (liter ), by Distribution Channel 2024 & 2032
- Figure 53: Asia Pacific Organic Drinks Industry Revenue Share (%), by Distribution Channel 2024 & 2032
- Figure 54: Asia Pacific Organic Drinks Industry Volume Share (%), by Distribution Channel 2024 & 2032
- Figure 55: Asia Pacific Organic Drinks Industry Revenue (Million), by Country 2024 & 2032
- Figure 56: Asia Pacific Organic Drinks Industry Volume (liter ), by Country 2024 & 2032
- Figure 57: Asia Pacific Organic Drinks Industry Revenue Share (%), by Country 2024 & 2032
- Figure 58: Asia Pacific Organic Drinks Industry Volume Share (%), by Country 2024 & 2032
- Figure 59: South America Organic Drinks Industry Revenue (Million), by Product Type 2024 & 2032
- Figure 60: South America Organic Drinks Industry Volume (liter ), by Product Type 2024 & 2032
- Figure 61: South America Organic Drinks Industry Revenue Share (%), by Product Type 2024 & 2032
- Figure 62: South America Organic Drinks Industry Volume Share (%), by Product Type 2024 & 2032
- Figure 63: South America Organic Drinks Industry Revenue (Million), by Distribution Channel 2024 & 2032
- Figure 64: South America Organic Drinks Industry Volume (liter ), by Distribution Channel 2024 & 2032
- Figure 65: South America Organic Drinks Industry Revenue Share (%), by Distribution Channel 2024 & 2032
- Figure 66: South America Organic Drinks Industry Volume Share (%), by Distribution Channel 2024 & 2032
- Figure 67: South America Organic Drinks Industry Revenue (Million), by Country 2024 & 2032
- Figure 68: South America Organic Drinks Industry Volume (liter ), by Country 2024 & 2032
- Figure 69: South America Organic Drinks Industry Revenue Share (%), by Country 2024 & 2032
- Figure 70: South America Organic Drinks Industry Volume Share (%), by Country 2024 & 2032
- Figure 71: Middle East and Africa Organic Drinks Industry Revenue (Million), by Product Type 2024 & 2032
- Figure 72: Middle East and Africa Organic Drinks Industry Volume (liter ), by Product Type 2024 & 2032
- Figure 73: Middle East and Africa Organic Drinks Industry Revenue Share (%), by Product Type 2024 & 2032
- Figure 74: Middle East and Africa Organic Drinks Industry Volume Share (%), by Product Type 2024 & 2032
- Figure 75: Middle East and Africa Organic Drinks Industry Revenue (Million), by Distribution Channel 2024 & 2032
- Figure 76: Middle East and Africa Organic Drinks Industry Volume (liter ), by Distribution Channel 2024 & 2032
- Figure 77: Middle East and Africa Organic Drinks Industry Revenue Share (%), by Distribution Channel 2024 & 2032
- Figure 78: Middle East and Africa Organic Drinks Industry Volume Share (%), by Distribution Channel 2024 & 2032
- Figure 79: Middle East and Africa Organic Drinks Industry Revenue (Million), by Country 2024 & 2032
- Figure 80: Middle East and Africa Organic Drinks Industry Volume (liter ), by Country 2024 & 2032
- Figure 81: Middle East and Africa Organic Drinks Industry Revenue Share (%), by Country 2024 & 2032
- Figure 82: Middle East and Africa Organic Drinks Industry Volume Share (%), by Country 2024 & 2032
List of Tables
- Table 1: Global Organic Drinks Industry Revenue Million Forecast, by Region 2019 & 2032
- Table 2: Global Organic Drinks Industry Volume liter Forecast, by Region 2019 & 2032
- Table 3: Global Organic Drinks Industry Revenue Million Forecast, by Product Type 2019 & 2032
- Table 4: Global Organic Drinks Industry Volume liter Forecast, by Product Type 2019 & 2032
- Table 5: Global Organic Drinks Industry Revenue Million Forecast, by Distribution Channel 2019 & 2032
- Table 6: Global Organic Drinks Industry Volume liter Forecast, by Distribution Channel 2019 & 2032
- Table 7: Global Organic Drinks Industry Revenue Million Forecast, by Region 2019 & 2032
- Table 8: Global Organic Drinks Industry Volume liter Forecast, by Region 2019 & 2032
- Table 9: Global Organic Drinks Industry Revenue Million Forecast, by Country 2019 & 2032
- Table 10: Global Organic Drinks Industry Volume liter Forecast, by Country 2019 & 2032
- Table 11: United States Organic Drinks Industry Revenue (Million) Forecast, by Application 2019 & 2032
- Table 12: United States Organic Drinks Industry Volume (liter ) Forecast, by Application 2019 & 2032
- Table 13: Canada Organic Drinks Industry Revenue (Million) Forecast, by Application 2019 & 2032
- Table 14: Canada Organic Drinks Industry Volume (liter ) Forecast, by Application 2019 & 2032
- Table 15: Mexico Organic Drinks Industry Revenue (Million) Forecast, by Application 2019 & 2032
- Table 16: Mexico Organic Drinks Industry Volume (liter ) Forecast, by Application 2019 & 2032
- Table 17: Rest of North America Organic Drinks Industry Revenue (Million) Forecast, by Application 2019 & 2032
- Table 18: Rest of North America Organic Drinks Industry Volume (liter ) Forecast, by Application 2019 & 2032
- Table 19: Global Organic Drinks Industry Revenue Million Forecast, by Country 2019 & 2032
- Table 20: Global Organic Drinks Industry Volume liter Forecast, by Country 2019 & 2032
- Table 21: Spain Organic Drinks Industry Revenue (Million) Forecast, by Application 2019 & 2032
- Table 22: Spain Organic Drinks Industry Volume (liter ) Forecast, by Application 2019 & 2032
- Table 23: United Kingdom Organic Drinks Industry Revenue (Million) Forecast, by Application 2019 & 2032
- Table 24: United Kingdom Organic Drinks Industry Volume (liter ) Forecast, by Application 2019 & 2032
- Table 25: Germany Organic Drinks Industry Revenue (Million) Forecast, by Application 2019 & 2032
- Table 26: Germany Organic Drinks Industry Volume (liter ) Forecast, by Application 2019 & 2032
- Table 27: France Organic Drinks Industry Revenue (Million) Forecast, by Application 2019 & 2032
- Table 28: France Organic Drinks Industry Volume (liter ) Forecast, by Application 2019 & 2032
- Table 29: Italy Organic Drinks Industry Revenue (Million) Forecast, by Application 2019 & 2032
- Table 30: Italy Organic Drinks Industry Volume (liter ) Forecast, by Application 2019 & 2032
- Table 31: Russia Organic Drinks Industry Revenue (Million) Forecast, by Application 2019 & 2032
- Table 32: Russia Organic Drinks Industry Volume (liter ) Forecast, by Application 2019 & 2032
- Table 33: Rest of Europe Organic Drinks Industry Revenue (Million) Forecast, by Application 2019 & 2032
- Table 34: Rest of Europe Organic Drinks Industry Volume (liter ) Forecast, by Application 2019 & 2032
- Table 35: Global Organic Drinks Industry Revenue Million Forecast, by Country 2019 & 2032
- Table 36: Global Organic Drinks Industry Volume liter Forecast, by Country 2019 & 2032
- Table 37: China Organic Drinks Industry Revenue (Million) Forecast, by Application 2019 & 2032
- Table 38: China Organic Drinks Industry Volume (liter ) Forecast, by Application 2019 & 2032
- Table 39: Japan Organic Drinks Industry Revenue (Million) Forecast, by Application 2019 & 2032
- Table 40: Japan Organic Drinks Industry Volume (liter ) Forecast, by Application 2019 & 2032
- Table 41: India Organic Drinks Industry Revenue (Million) Forecast, by Application 2019 & 2032
- Table 42: India Organic Drinks Industry Volume (liter ) Forecast, by Application 2019 & 2032
- Table 43: Australia Organic Drinks Industry Revenue (Million) Forecast, by Application 2019 & 2032
- Table 44: Australia Organic Drinks Industry Volume (liter ) Forecast, by Application 2019 & 2032
- Table 45: Rest of Asia Pacific Organic Drinks Industry Revenue (Million) Forecast, by Application 2019 & 2032
- Table 46: Rest of Asia Pacific Organic Drinks Industry Volume (liter ) Forecast, by Application 2019 & 2032
- Table 47: Global Organic Drinks Industry Revenue Million Forecast, by Country 2019 & 2032
- Table 48: Global Organic Drinks Industry Volume liter Forecast, by Country 2019 & 2032
- Table 49: Brazil Organic Drinks Industry Revenue (Million) Forecast, by Application 2019 & 2032
- Table 50: Brazil Organic Drinks Industry Volume (liter ) Forecast, by Application 2019 & 2032
- Table 51: Argentina Organic Drinks Industry Revenue (Million) Forecast, by Application 2019 & 2032
- Table 52: Argentina Organic Drinks Industry Volume (liter ) Forecast, by Application 2019 & 2032
- Table 53: Rest of South America Organic Drinks Industry Revenue (Million) Forecast, by Application 2019 & 2032
- Table 54: Rest of South America Organic Drinks Industry Volume (liter ) Forecast, by Application 2019 & 2032
- Table 55: Global Organic Drinks Industry Revenue Million Forecast, by Country 2019 & 2032
- Table 56: Global Organic Drinks Industry Volume liter Forecast, by Country 2019 & 2032
- Table 57: South Africa Organic Drinks Industry Revenue (Million) Forecast, by Application 2019 & 2032
- Table 58: South Africa Organic Drinks Industry Volume (liter ) Forecast, by Application 2019 & 2032
- Table 59: United Arab Emirates Organic Drinks Industry Revenue (Million) Forecast, by Application 2019 & 2032
- Table 60: United Arab Emirates Organic Drinks Industry Volume (liter ) Forecast, by Application 2019 & 2032
- Table 61: Rest of Middle East and Africa Organic Drinks Industry Revenue (Million) Forecast, by Application 2019 & 2032
- Table 62: Rest of Middle East and Africa Organic Drinks Industry Volume (liter ) Forecast, by Application 2019 & 2032
- Table 63: Global Organic Drinks Industry Revenue Million Forecast, by Product Type 2019 & 2032
- Table 64: Global Organic Drinks Industry Volume liter Forecast, by Product Type 2019 & 2032
- Table 65: Global Organic Drinks Industry Revenue Million Forecast, by Distribution Channel 2019 & 2032
- Table 66: Global Organic Drinks Industry Volume liter Forecast, by Distribution Channel 2019 & 2032
- Table 67: Global Organic Drinks Industry Revenue Million Forecast, by Country 2019 & 2032
- Table 68: Global Organic Drinks Industry Volume liter Forecast, by Country 2019 & 2032
- Table 69: United States Organic Drinks Industry Revenue (Million) Forecast, by Application 2019 & 2032
- Table 70: United States Organic Drinks Industry Volume (liter ) Forecast, by Application 2019 & 2032
- Table 71: Canada Organic Drinks Industry Revenue (Million) Forecast, by Application 2019 & 2032
- Table 72: Canada Organic Drinks Industry Volume (liter ) Forecast, by Application 2019 & 2032
- Table 73: Mexico Organic Drinks Industry Revenue (Million) Forecast, by Application 2019 & 2032
- Table 74: Mexico Organic Drinks Industry Volume (liter ) Forecast, by Application 2019 & 2032
- Table 75: Rest of North America Organic Drinks Industry Revenue (Million) Forecast, by Application 2019 & 2032
- Table 76: Rest of North America Organic Drinks Industry Volume (liter ) Forecast, by Application 2019 & 2032
- Table 77: Global Organic Drinks Industry Revenue Million Forecast, by Product Type 2019 & 2032
- Table 78: Global Organic Drinks Industry Volume liter Forecast, by Product Type 2019 & 2032
- Table 79: Global Organic Drinks Industry Revenue Million Forecast, by Distribution Channel 2019 & 2032
- Table 80: Global Organic Drinks Industry Volume liter Forecast, by Distribution Channel 2019 & 2032
- Table 81: Global Organic Drinks Industry Revenue Million Forecast, by Country 2019 & 2032
- Table 82: Global Organic Drinks Industry Volume liter Forecast, by Country 2019 & 2032
- Table 83: Spain Organic Drinks Industry Revenue (Million) Forecast, by Application 2019 & 2032
- Table 84: Spain Organic Drinks Industry Volume (liter ) Forecast, by Application 2019 & 2032
- Table 85: United Kingdom Organic Drinks Industry Revenue (Million) Forecast, by Application 2019 & 2032
- Table 86: United Kingdom Organic Drinks Industry Volume (liter ) Forecast, by Application 2019 & 2032
- Table 87: Germany Organic Drinks Industry Revenue (Million) Forecast, by Application 2019 & 2032
- Table 88: Germany Organic Drinks Industry Volume (liter ) Forecast, by Application 2019 & 2032
- Table 89: France Organic Drinks Industry Revenue (Million) Forecast, by Application 2019 & 2032
- Table 90: France Organic Drinks Industry Volume (liter ) Forecast, by Application 2019 & 2032
- Table 91: Italy Organic Drinks Industry Revenue (Million) Forecast, by Application 2019 & 2032
- Table 92: Italy Organic Drinks Industry Volume (liter ) Forecast, by Application 2019 & 2032
- Table 93: Russia Organic Drinks Industry Revenue (Million) Forecast, by Application 2019 & 2032
- Table 94: Russia Organic Drinks Industry Volume (liter ) Forecast, by Application 2019 & 2032
- Table 95: Rest of Europe Organic Drinks Industry Revenue (Million) Forecast, by Application 2019 & 2032
- Table 96: Rest of Europe Organic Drinks Industry Volume (liter ) Forecast, by Application 2019 & 2032
- Table 97: Global Organic Drinks Industry Revenue Million Forecast, by Product Type 2019 & 2032
- Table 98: Global Organic Drinks Industry Volume liter Forecast, by Product Type 2019 & 2032
- Table 99: Global Organic Drinks Industry Revenue Million Forecast, by Distribution Channel 2019 & 2032
- Table 100: Global Organic Drinks Industry Volume liter Forecast, by Distribution Channel 2019 & 2032
- Table 101: Global Organic Drinks Industry Revenue Million Forecast, by Country 2019 & 2032
- Table 102: Global Organic Drinks Industry Volume liter Forecast, by Country 2019 & 2032
- Table 103: China Organic Drinks Industry Revenue (Million) Forecast, by Application 2019 & 2032
- Table 104: China Organic Drinks Industry Volume (liter ) Forecast, by Application 2019 & 2032
- Table 105: Japan Organic Drinks Industry Revenue (Million) Forecast, by Application 2019 & 2032
- Table 106: Japan Organic Drinks Industry Volume (liter ) Forecast, by Application 2019 & 2032
- Table 107: India Organic Drinks Industry Revenue (Million) Forecast, by Application 2019 & 2032
- Table 108: India Organic Drinks Industry Volume (liter ) Forecast, by Application 2019 & 2032
- Table 109: Australia Organic Drinks Industry Revenue (Million) Forecast, by Application 2019 & 2032
- Table 110: Australia Organic Drinks Industry Volume (liter ) Forecast, by Application 2019 & 2032
- Table 111: Rest of Asia Pacific Organic Drinks Industry Revenue (Million) Forecast, by Application 2019 & 2032
- Table 112: Rest of Asia Pacific Organic Drinks Industry Volume (liter ) Forecast, by Application 2019 & 2032
- Table 113: Global Organic Drinks Industry Revenue Million Forecast, by Product Type 2019 & 2032
- Table 114: Global Organic Drinks Industry Volume liter Forecast, by Product Type 2019 & 2032
- Table 115: Global Organic Drinks Industry Revenue Million Forecast, by Distribution Channel 2019 & 2032
- Table 116: Global Organic Drinks Industry Volume liter Forecast, by Distribution Channel 2019 & 2032
- Table 117: Global Organic Drinks Industry Revenue Million Forecast, by Country 2019 & 2032
- Table 118: Global Organic Drinks Industry Volume liter Forecast, by Country 2019 & 2032
- Table 119: Brazil Organic Drinks Industry Revenue (Million) Forecast, by Application 2019 & 2032
- Table 120: Brazil Organic Drinks Industry Volume (liter ) Forecast, by Application 2019 & 2032
- Table 121: Argentina Organic Drinks Industry Revenue (Million) Forecast, by Application 2019 & 2032
- Table 122: Argentina Organic Drinks Industry Volume (liter ) Forecast, by Application 2019 & 2032
- Table 123: Rest of South America Organic Drinks Industry Revenue (Million) Forecast, by Application 2019 & 2032
- Table 124: Rest of South America Organic Drinks Industry Volume (liter ) Forecast, by Application 2019 & 2032
- Table 125: Global Organic Drinks Industry Revenue Million Forecast, by Product Type 2019 & 2032
- Table 126: Global Organic Drinks Industry Volume liter Forecast, by Product Type 2019 & 2032
- Table 127: Global Organic Drinks Industry Revenue Million Forecast, by Distribution Channel 2019 & 2032
- Table 128: Global Organic Drinks Industry Volume liter Forecast, by Distribution Channel 2019 & 2032
- Table 129: Global Organic Drinks Industry Revenue Million Forecast, by Country 2019 & 2032
- Table 130: Global Organic Drinks Industry Volume liter Forecast, by Country 2019 & 2032
- Table 131: South Africa Organic Drinks Industry Revenue (Million) Forecast, by Application 2019 & 2032
- Table 132: South Africa Organic Drinks Industry Volume (liter ) Forecast, by Application 2019 & 2032
- Table 133: United Arab Emirates Organic Drinks Industry Revenue (Million) Forecast, by Application 2019 & 2032
- Table 134: United Arab Emirates Organic Drinks Industry Volume (liter ) Forecast, by Application 2019 & 2032
- Table 135: Rest of Middle East and Africa Organic Drinks Industry Revenue (Million) Forecast, by Application 2019 & 2032
- Table 136: Rest of Middle East and Africa Organic Drinks Industry Volume (liter ) Forecast, by Application 2019 & 2032
Frequently Asked Questions
1. What is the projected Compound Annual Growth Rate (CAGR) of the Organic Drinks Industry?
The projected CAGR is approximately 4.91%.
2. Which companies are prominent players in the Organic Drinks Industry?
Key companies in the market include Nestlé SA, Lacorata Beverage LLC, Anheuser-Busch InBev, SYSTM Foods Inc, PepsiCo Inc, Whitewave Foods Company, James White Drinks, Bison Organic Beer, Danone SA, Organic Valley*List Not Exhaustive, PS Organic LLC, Drake's Organic Spirits LLC.
3. What are the main segments of the Organic Drinks Industry?
The market segments include Product Type, Distribution Channel.
4. Can you provide details about the market size?
The market size is estimated to be USD 50.19 Million as of 2022.
5. What are some drivers contributing to market growth?
Growing Demand for Nutricosmetics Among Millennials; Growing Beauty and Wellness Trend.
6. What are the notable trends driving market growth?
Health-conscious consumers are increasingly demanding organic beverages.
7. Are there any restraints impacting market growth?
Stringent Government Regulations and Product Guidelines.
8. Can you provide examples of recent developments in the market?
In June 2022, the food and beverage brand, Systm Foods acquired Chameleon Organic Coffee from Nestlé USA. Chameleon Organic Coffee's product portfolio includes single-serve ready-to-drink products as well as multi-serve concentrates.
9. What pricing options are available for accessing the report?
Pricing options include single-user, multi-user, and enterprise licenses priced at USD 4750, USD 5250, and USD 8750 respectively.
10. Is the market size provided in terms of value or volume?
The market size is provided in terms of value, measured in Million and volume, measured in liter .
11. Are there any specific market keywords associated with the report?
Yes, the market keyword associated with the report is "Organic Drinks Industry," which aids in identifying and referencing the specific market segment covered.
12. How do I determine which pricing option suits my needs best?
The pricing options vary based on user requirements and access needs. Individual users may opt for single-user licenses, while businesses requiring broader access may choose multi-user or enterprise licenses for cost-effective access to the report.
13. Are there any additional resources or data provided in the Organic Drinks Industry report?
While the report offers comprehensive insights, it's advisable to review the specific contents or supplementary materials provided to ascertain if additional resources or data are available.
14. How can I stay updated on further developments or reports in the Organic Drinks Industry?
To stay informed about further developments, trends, and reports in the Organic Drinks Industry, consider subscribing to industry newsletters, following relevant companies and organizations, or regularly checking reputable industry news sources and publications.
Methodology
Step 1 - Identification of Relevant Samples Size from Population Database


Step 2 - Approaches for Defining Global Market Size (Value, Volume* & Price*)

Note*: In applicable scenarios
Step 3 - Data Sources
Primary Research
- Web Analytics
- Survey Reports
- Research Institute
- Latest Research Reports
- Opinion Leaders
Secondary Research
- Annual Reports
- White Paper
- Latest Press Release
- Industry Association
- Paid Database
- Investor Presentations

Step 4 - Data Triangulation
Involves using different sources of information in order to increase the validity of a study
These sources are likely to be stakeholders in a program - participants, other researchers, program staff, other community members, and so on.
Then we put all data in single framework & apply various statistical tools to find out the dynamic on the market.
During the analysis stage, feedback from the stakeholder groups would be compared to determine areas of agreement as well as areas of divergence


