
Key Insights
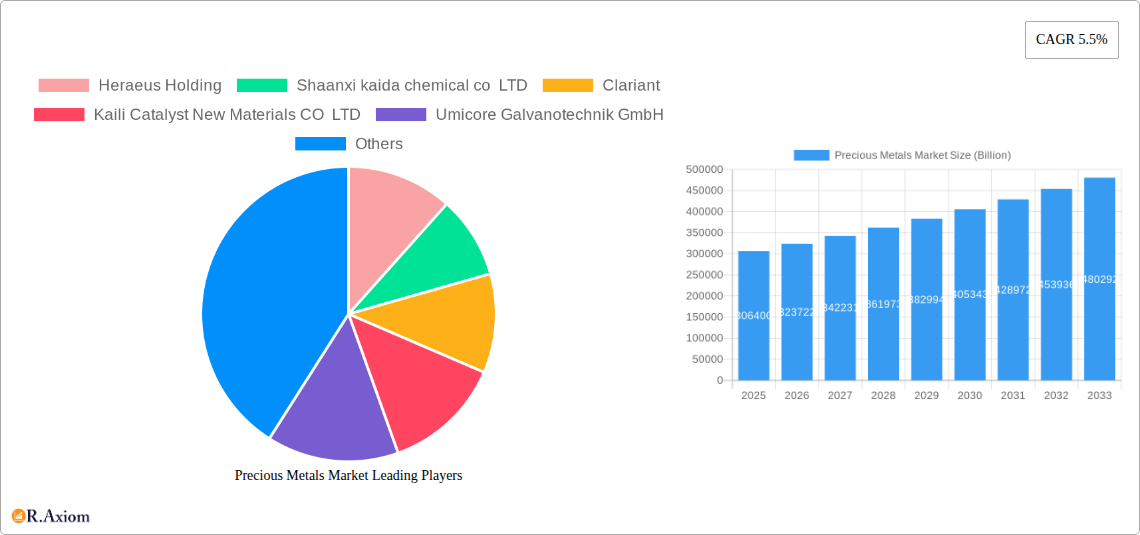
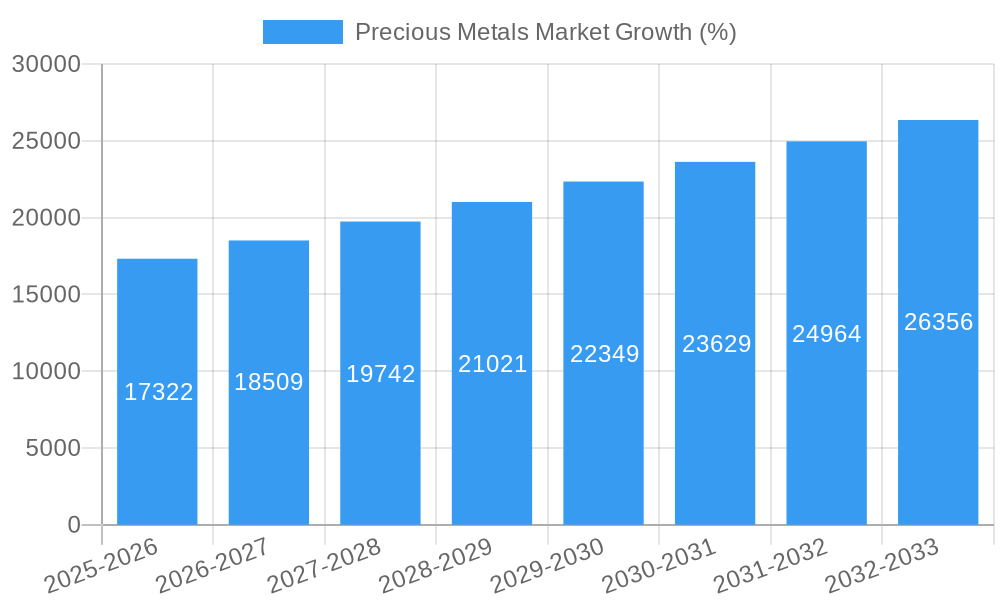
The global precious metals market, valued at $306.4 billion in 2025, is projected to experience robust growth, driven by a compound annual growth rate (CAGR) of 5.5% from 2025 to 2033. This expansion is fueled by several key factors. The automotive industry's increasing reliance on catalytic converters, which utilize platinum, palladium, and rhodium, significantly contributes to market demand. Furthermore, the pharmaceutical and petrochemical sectors rely heavily on these metals for various applications, including drug manufacturing and refining processes. Growth in these sectors directly translates into increased precious metals consumption. Technological advancements, particularly in electronics and renewable energy, are also creating new avenues for precious metal utilization. While supply chain disruptions and price volatility remain potential restraints, the overall market outlook remains positive, with continued growth expected across all major segments.
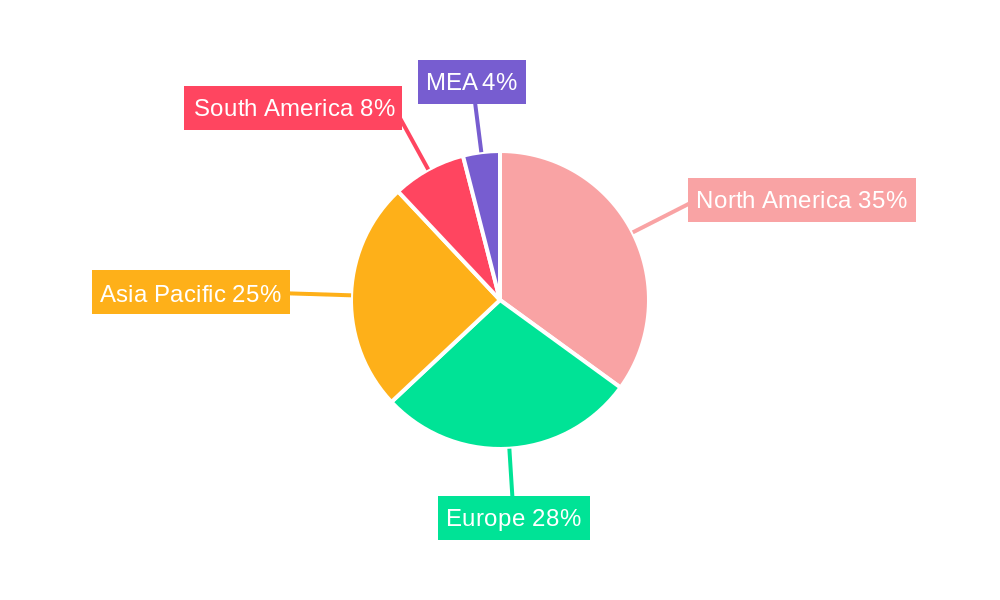
The market segmentation reveals significant opportunities. Platinum and palladium dominate the "Type" segment due to their extensive use in automotive catalysis. However, other precious metals like rhodium and iridium are gaining traction in niche applications like high-temperature alloys and specialized electronics. Within the "Application" segment, the automotive industry holds the largest share, followed by the pharmaceutical and petrochemical sectors. Geographically, North America and Asia-Pacific are currently the leading regions, driven by strong automotive production and technological advancements in these areas. However, emerging markets in Asia-Pacific and South America show promising growth potential, offering lucrative opportunities for market players. The competitive landscape is marked by a blend of established multinational corporations and regional players. This diverse landscape promotes innovation and ensures a wide range of product offerings, further fueling market dynamism.
Precious Metals Market: Comprehensive Analysis & Forecast 2019-2033
This in-depth report provides a comprehensive analysis of the global precious metals market, offering valuable insights for stakeholders seeking to understand market dynamics, identify growth opportunities, and navigate competitive landscapes. The report covers the period 2019-2033, with a focus on the 2025-2033 forecast period and a base year of 2025. The market is segmented by type (Platinum, Palladium, Rhodium, Iridium, Ruthenium, Other Types) and application (Automotive, Pharmaceutical, Petrochemicals, Other Applications). The market size is estimated at $XX Billion in 2025 and projected to reach $XX Billion by 2033, exhibiting a CAGR of XX%.
Keywords: Precious Metals Market, Platinum Market, Palladium Market, Rhodium Market, Iridium Market, Ruthenium Market, Automotive Catalysts, Pharmaceutical Applications, Petrochemicals, Precious Metals Investment, Market Analysis, Market Forecast, Market Research, Industry Trends, Competitive Landscape, Heraeus Holding, Johnson Matthey, BASF SE, Umicore, Clariant.
Precious Metals Market Concentration & Innovation
The precious metals market exhibits a moderately concentrated structure, with a few dominant players holding significant market share. Heraeus Holding, Johnson Matthey, and BASF SE are among the leading companies, collectively accounting for an estimated XX% of the global market in 2025. Market concentration is influenced by factors such as economies of scale, technological expertise, and established supply chains. Innovation plays a crucial role, with companies investing heavily in R&D to develop new applications and improve production efficiency. Regulatory frameworks, particularly those concerning environmental protection and responsible sourcing, are increasingly shaping industry practices. Product substitutes, though limited, are emerging in certain niche applications, potentially influencing market dynamics. End-user trends, particularly in the automotive and electronics sectors, drive demand fluctuations. M&A activities, while not excessively frequent, have the potential to significantly reshape the market landscape. Recent deals valued at over $XX Billion have demonstrated consolidation trends and efforts to expand market reach and technological capabilities.
- Market Share (2025): Top 3 players - XX%; Top 5 players - XX%
- M&A Activity (2019-2024): XX deals with a total value of $XX Billion.
- Key Innovation Drivers: Development of advanced catalysts, improved refining techniques, exploration of new applications in emerging technologies.
Precious Metals Market Industry Trends & Insights
The precious metals market is experiencing dynamic growth driven by several key factors. The burgeoning automotive industry, particularly the increasing demand for catalytic converters in vehicles, remains a significant driver. Technological advancements, such as the development of more efficient and environmentally friendly catalysts, are fueling market expansion. Growing consumer preferences for advanced technologies in electronics and other industries are further bolstering demand. The pharmaceutical industry's increasing use of precious metals in drug manufacturing is also contributing to growth. However, fluctuating prices of precious metals, influenced by global economic conditions and geopolitical factors, pose a challenge. The competitive landscape is intense, with established players constantly seeking to differentiate their offerings through innovation and strategic partnerships. Market penetration in emerging economies is expected to increase, driven by infrastructure development and rising consumer spending. The market is forecast to grow at a CAGR of XX% from 2025 to 2033, reaching a value of $XX Billion by 2033. This growth is influenced by several factors including increasing demand from the automotive, electronic, and pharmaceutical sectors, and also by governmental regulations.
Dominant Markets & Segments in Precious Metals Market
The automotive sector is the leading application segment, accounting for an estimated XX% of global precious metals consumption in 2025. Platinum and palladium are the dominant precious metals by type, driven by their widespread use in catalytic converters. The Asia-Pacific region, particularly China and Japan, represents the largest market due to the high concentration of automotive manufacturing and strong industrial activity.
Key Drivers for Automotive Segment Dominance:
- Stringent emission regulations globally
- Rising vehicle production, particularly in emerging markets
- Technological advancements leading to greater catalyst efficiency.
Key Drivers for Asia-Pacific Regional Dominance:
- Rapid industrialization and economic growth
- High automotive production volumes
- Favorable government policies supporting automotive manufacturing.
Platinum Market: Dominated by use in automotive catalysts, with strong growth driven by emission regulations.
Palladium Market: Significant demand from the automotive sector, facing price volatility due to supply constraints.
Rhodium Market: Smaller market size, but high value due to specific applications in automotive catalysts and other industries.
Iridium and Ruthenium Market: Relatively smaller market segments with specific niche applications.
Precious Metals Market Product Developments
Recent product developments focus on enhancing catalyst efficiency, reducing precious metal loading, and developing more sustainable production methods. Advances in nanotechnology and material science are enabling the creation of more effective catalysts with superior performance characteristics. New applications are being explored in areas such as fuel cells and electronics. Companies are striving to create products with improved cost-effectiveness and reduced environmental impact, thereby meeting market demands and maintaining competitiveness.
Report Scope & Segmentation Analysis
This report provides a comprehensive analysis of the precious metals market, segmented by type (Platinum, Palladium, Rhodium, Iridium, Ruthenium, Other) and application (Automotive, Pharmaceutical, Petrochemicals, Other). Each segment is analyzed in detail, including market size, growth projections, and competitive dynamics. The report also includes a regional analysis, highlighting key market trends and drivers in different geographic locations. Detailed profiles of key market players are provided, including their market share, product portfolio, and strategic initiatives.
Key Drivers of Precious Metals Market Growth
Stringent environmental regulations, particularly regarding vehicle emissions, are a major driver of precious metals demand, particularly for platinum and palladium in catalytic converters. The increasing demand for electronics and other advanced technologies is also fueling market growth. Economic growth in emerging markets, leading to increased industrial activity and vehicle ownership, is expected to further boost demand. Technological advancements, such as the development of more efficient catalysts and new applications for precious metals, are contributing to market expansion.
Challenges in the Precious Metals Market Sector
Price volatility in precious metals is a significant challenge, impacting profitability and investment decisions. Supply chain disruptions and geopolitical uncertainties can lead to fluctuations in availability and prices. Increasing environmental regulations necessitate sustainable sourcing and production practices, adding to operational costs. Intense competition among established players and the emergence of new entrants create a dynamic and challenging competitive landscape.
Emerging Opportunities in Precious Metals Market
Growing demand for fuel cell technology presents a significant opportunity for precious metals in clean energy applications. Expansion into new markets, particularly in emerging economies, offers growth potential. Advances in nanotechnology and material science are creating opportunities for the development of novel applications for precious metals in various industries. Sustainable sourcing initiatives and responsible mining practices can unlock new market segments and enhance brand reputation.
Leading Players in the Precious Metals Market Market
- Heraeus Holding
- Shaanxi Kaida Chemical Co LTD
- Clariant
- Kaili Catalyst New Materials CO LTD
- Umicore Galvanotechnik GmbH
- American Elements
- CHIMET
- Evonik Industries AG
- Sabin Metal Corporation
- Souvenier Chemicals
- ReMetall Deutschland AG
- BASF SE
- Stanford Advanced Materials
- Catalytic Products International
- J&J Materials Inc
- Alfa Aesar Thermo Fisher Scientific
- Johnson Matthey
- ALS Limited
Key Developments in Precious Metals Market Industry
- 2022 Q4: Johnson Matthey announced a significant investment in expanding its catalyst production capacity.
- 2023 Q1: Heraeus Holding launched a new range of high-performance catalysts for automotive applications.
- 2023 Q2: BASF SE and Clariant formed a joint venture to develop sustainable precious metals recycling technologies.
- 2024 Q3: Several companies announced new partnerships to secure responsible sourcing of precious metals. (Further details will be in the final report).
Strategic Outlook for Precious Metals Market Market
The precious metals market is poised for continued growth, driven by increasing demand from key sectors such as automotive, electronics, and pharmaceuticals. Technological advancements, sustainable sourcing initiatives, and expansion into new markets will further fuel market expansion. Strategic partnerships and collaborations are likely to increase, leading to further consolidation in the industry. The market will continue to be shaped by evolving environmental regulations and fluctuations in precious metal prices. Companies with strong R&D capabilities, sustainable practices, and efficient supply chains are expected to thrive.
Precious Metals Market Segmentation
-
1. Type
- 1.1. Platinum
- 1.2. Palladium
- 1.3. Rhodium
- 1.4. Iridium
- 1.5. Ruthenium
- 1.6. Other Types
-
2. Application
- 2.1. Automotive
- 2.2. Pharmaceutical
- 2.3. Petrochemicals
- 2.4. Other Applications
Precious Metals Market Segmentation By Geography
-
1. Asia Pacific
- 1.1. China
- 1.2. India
- 1.3. Japan
- 1.4. South Korea
- 1.5. ASEAN Countries
- 1.6. Rest of Asia Pacific
-
2. North America
- 2.1. United States
- 2.2. Canada
- 2.3. Mexico
-
3. Europe
- 3.1. Germany
- 3.2. United Kingdom
- 3.3. Italy
- 3.4. France
- 3.5. Rest of Europe
-
4. South America
- 4.1. Brazil
- 4.2. Argentina
- 4.3. Rest of South America
-
5. Middle East and Africa
- 5.1. Saudi Arabia
- 5.2. South Africa
- 5.3. Rest of Middle East and Africa
Precious Metals Market REPORT HIGHLIGHTS
| Aspects | Details |
|---|---|
| Study Period | 2019-2033 |
| Base Year | 2024 |
| Estimated Year | 2025 |
| Forecast Period | 2025-2033 |
| Historical Period | 2019-2024 |
| Growth Rate | CAGR of 5.5% from 2019-2033 |
| Segmentation |
|
Table of Contents
- 1. Introduction
- 1.1. Research Scope
- 1.2. Market Segmentation
- 1.3. Research Methodology
- 1.4. Definitions and Assumptions
- 2. Executive Summary
- 2.1. Introduction
- 3. Market Dynamics
- 3.1. Introduction
- 3.2. Market Drivers
- 3.2.1. Accelerating Demand for High-Performance Transportation Fuel; Increasing Investment in Refineries; Other Drivers
- 3.3. Market Restrains
- 3.3.1. High Production Costs; Other Restraints
- 3.4. Market Trends
- 3.4.1. Automotive Segment to Dominate the Market
- 4. Market Factor Analysis
- 4.1. Porters Five Forces
- 4.2. Supply/Value Chain
- 4.3. PESTEL analysis
- 4.4. Market Entropy
- 4.5. Patent/Trademark Analysis
- 5. Global Precious Metals Market Analysis, Insights and Forecast, 2019-2031
- 5.1. Market Analysis, Insights and Forecast - by Type
- 5.1.1. Platinum
- 5.1.2. Palladium
- 5.1.3. Rhodium
- 5.1.4. Iridium
- 5.1.5. Ruthenium
- 5.1.6. Other Types
- 5.2. Market Analysis, Insights and Forecast - by Application
- 5.2.1. Automotive
- 5.2.2. Pharmaceutical
- 5.2.3. Petrochemicals
- 5.2.4. Other Applications
- 5.3. Market Analysis, Insights and Forecast - by Region
- 5.3.1. Asia Pacific
- 5.3.2. North America
- 5.3.3. Europe
- 5.3.4. South America
- 5.3.5. Middle East and Africa
- 5.1. Market Analysis, Insights and Forecast - by Type
- 6. Asia Pacific Precious Metals Market Analysis, Insights and Forecast, 2019-2031
- 6.1. Market Analysis, Insights and Forecast - by Type
- 6.1.1. Platinum
- 6.1.2. Palladium
- 6.1.3. Rhodium
- 6.1.4. Iridium
- 6.1.5. Ruthenium
- 6.1.6. Other Types
- 6.2. Market Analysis, Insights and Forecast - by Application
- 6.2.1. Automotive
- 6.2.2. Pharmaceutical
- 6.2.3. Petrochemicals
- 6.2.4. Other Applications
- 6.1. Market Analysis, Insights and Forecast - by Type
- 7. North America Precious Metals Market Analysis, Insights and Forecast, 2019-2031
- 7.1. Market Analysis, Insights and Forecast - by Type
- 7.1.1. Platinum
- 7.1.2. Palladium
- 7.1.3. Rhodium
- 7.1.4. Iridium
- 7.1.5. Ruthenium
- 7.1.6. Other Types
- 7.2. Market Analysis, Insights and Forecast - by Application
- 7.2.1. Automotive
- 7.2.2. Pharmaceutical
- 7.2.3. Petrochemicals
- 7.2.4. Other Applications
- 7.1. Market Analysis, Insights and Forecast - by Type
- 8. Europe Precious Metals Market Analysis, Insights and Forecast, 2019-2031
- 8.1. Market Analysis, Insights and Forecast - by Type
- 8.1.1. Platinum
- 8.1.2. Palladium
- 8.1.3. Rhodium
- 8.1.4. Iridium
- 8.1.5. Ruthenium
- 8.1.6. Other Types
- 8.2. Market Analysis, Insights and Forecast - by Application
- 8.2.1. Automotive
- 8.2.2. Pharmaceutical
- 8.2.3. Petrochemicals
- 8.2.4. Other Applications
- 8.1. Market Analysis, Insights and Forecast - by Type
- 9. South America Precious Metals Market Analysis, Insights and Forecast, 2019-2031
- 9.1. Market Analysis, Insights and Forecast - by Type
- 9.1.1. Platinum
- 9.1.2. Palladium
- 9.1.3. Rhodium
- 9.1.4. Iridium
- 9.1.5. Ruthenium
- 9.1.6. Other Types
- 9.2. Market Analysis, Insights and Forecast - by Application
- 9.2.1. Automotive
- 9.2.2. Pharmaceutical
- 9.2.3. Petrochemicals
- 9.2.4. Other Applications
- 9.1. Market Analysis, Insights and Forecast - by Type
- 10. Middle East and Africa Precious Metals Market Analysis, Insights and Forecast, 2019-2031
- 10.1. Market Analysis, Insights and Forecast - by Type
- 10.1.1. Platinum
- 10.1.2. Palladium
- 10.1.3. Rhodium
- 10.1.4. Iridium
- 10.1.5. Ruthenium
- 10.1.6. Other Types
- 10.2. Market Analysis, Insights and Forecast - by Application
- 10.2.1. Automotive
- 10.2.2. Pharmaceutical
- 10.2.3. Petrochemicals
- 10.2.4. Other Applications
- 10.1. Market Analysis, Insights and Forecast - by Type
- 11. North America Precious Metals Market Analysis, Insights and Forecast, 2019-2031
- 11.1. Market Analysis, Insights and Forecast - By Country/Sub-region
- 11.1.1 United States
- 11.1.2 Canada
- 11.1.3 Mexico
- 12. Europe Precious Metals Market Analysis, Insights and Forecast, 2019-2031
- 12.1. Market Analysis, Insights and Forecast - By Country/Sub-region
- 12.1.1 Germany
- 12.1.2 France
- 12.1.3 Italy
- 12.1.4 United Kingdom
- 12.1.5 Netherlands
- 12.1.6 Rest of Europe
- 13. Asia Pacific Precious Metals Market Analysis, Insights and Forecast, 2019-2031
- 13.1. Market Analysis, Insights and Forecast - By Country/Sub-region
- 13.1.1 China
- 13.1.2 Japan
- 13.1.3 India
- 13.1.4 South Korea
- 13.1.5 Taiwan
- 13.1.6 Australia
- 13.1.7 Rest of Asia-Pacific
- 14. South America Precious Metals Market Analysis, Insights and Forecast, 2019-2031
- 14.1. Market Analysis, Insights and Forecast - By Country/Sub-region
- 14.1.1 Brazil
- 14.1.2 Argentina
- 14.1.3 Rest of South America
- 15. MEA Precious Metals Market Analysis, Insights and Forecast, 2019-2031
- 15.1. Market Analysis, Insights and Forecast - By Country/Sub-region
- 15.1.1 Middle East
- 15.1.2 Africa
- 16. Competitive Analysis
- 16.1. Global Market Share Analysis 2024
- 16.2. Company Profiles
- 16.2.1 Heraeus Holding
- 16.2.1.1. Overview
- 16.2.1.2. Products
- 16.2.1.3. SWOT Analysis
- 16.2.1.4. Recent Developments
- 16.2.1.5. Financials (Based on Availability)
- 16.2.2 Shaanxi kaida chemical co LTD
- 16.2.2.1. Overview
- 16.2.2.2. Products
- 16.2.2.3. SWOT Analysis
- 16.2.2.4. Recent Developments
- 16.2.2.5. Financials (Based on Availability)
- 16.2.3 Clariant
- 16.2.3.1. Overview
- 16.2.3.2. Products
- 16.2.3.3. SWOT Analysis
- 16.2.3.4. Recent Developments
- 16.2.3.5. Financials (Based on Availability)
- 16.2.4 Kaili Catalyst New Materials CO LTD
- 16.2.4.1. Overview
- 16.2.4.2. Products
- 16.2.4.3. SWOT Analysis
- 16.2.4.4. Recent Developments
- 16.2.4.5. Financials (Based on Availability)
- 16.2.5 Umicore Galvanotechnik GmbH
- 16.2.5.1. Overview
- 16.2.5.2. Products
- 16.2.5.3. SWOT Analysis
- 16.2.5.4. Recent Developments
- 16.2.5.5. Financials (Based on Availability)
- 16.2.6 American Elements
- 16.2.6.1. Overview
- 16.2.6.2. Products
- 16.2.6.3. SWOT Analysis
- 16.2.6.4. Recent Developments
- 16.2.6.5. Financials (Based on Availability)
- 16.2.7 CHIMET
- 16.2.7.1. Overview
- 16.2.7.2. Products
- 16.2.7.3. SWOT Analysis
- 16.2.7.4. Recent Developments
- 16.2.7.5. Financials (Based on Availability)
- 16.2.8 Evonik Industries AG
- 16.2.8.1. Overview
- 16.2.8.2. Products
- 16.2.8.3. SWOT Analysis
- 16.2.8.4. Recent Developments
- 16.2.8.5. Financials (Based on Availability)
- 16.2.9 Sabin Metal Corporation
- 16.2.9.1. Overview
- 16.2.9.2. Products
- 16.2.9.3. SWOT Analysis
- 16.2.9.4. Recent Developments
- 16.2.9.5. Financials (Based on Availability)
- 16.2.10 Souvenier Chemicals
- 16.2.10.1. Overview
- 16.2.10.2. Products
- 16.2.10.3. SWOT Analysis
- 16.2.10.4. Recent Developments
- 16.2.10.5. Financials (Based on Availability)
- 16.2.11 ReMetall Deutschland AG
- 16.2.11.1. Overview
- 16.2.11.2. Products
- 16.2.11.3. SWOT Analysis
- 16.2.11.4. Recent Developments
- 16.2.11.5. Financials (Based on Availability)
- 16.2.12 BASF SE
- 16.2.12.1. Overview
- 16.2.12.2. Products
- 16.2.12.3. SWOT Analysis
- 16.2.12.4. Recent Developments
- 16.2.12.5. Financials (Based on Availability)
- 16.2.13 Stanford Advanced Materials
- 16.2.13.1. Overview
- 16.2.13.2. Products
- 16.2.13.3. SWOT Analysis
- 16.2.13.4. Recent Developments
- 16.2.13.5. Financials (Based on Availability)
- 16.2.14 Catalytic Products International
- 16.2.14.1. Overview
- 16.2.14.2. Products
- 16.2.14.3. SWOT Analysis
- 16.2.14.4. Recent Developments
- 16.2.14.5. Financials (Based on Availability)
- 16.2.15 J&J Materials Inc
- 16.2.15.1. Overview
- 16.2.15.2. Products
- 16.2.15.3. SWOT Analysis
- 16.2.15.4. Recent Developments
- 16.2.15.5. Financials (Based on Availability)
- 16.2.16 Alfa Aesar Thermo Fisher Scientific
- 16.2.16.1. Overview
- 16.2.16.2. Products
- 16.2.16.3. SWOT Analysis
- 16.2.16.4. Recent Developments
- 16.2.16.5. Financials (Based on Availability)
- 16.2.17 Johnson Matthey
- 16.2.17.1. Overview
- 16.2.17.2. Products
- 16.2.17.3. SWOT Analysis
- 16.2.17.4. Recent Developments
- 16.2.17.5. Financials (Based on Availability)
- 16.2.18 ALS Limited
- 16.2.18.1. Overview
- 16.2.18.2. Products
- 16.2.18.3. SWOT Analysis
- 16.2.18.4. Recent Developments
- 16.2.18.5. Financials (Based on Availability)
- 16.2.1 Heraeus Holding
List of Figures
- Figure 1: Global Precious Metals Market Revenue Breakdown (Billion, %) by Region 2024 & 2032
- Figure 2: Global Precious Metals Market Volume Breakdown (K Tons, %) by Region 2024 & 2032
- Figure 3: North America Precious Metals Market Revenue (Billion), by Country 2024 & 2032
- Figure 4: North America Precious Metals Market Volume (K Tons), by Country 2024 & 2032
- Figure 5: North America Precious Metals Market Revenue Share (%), by Country 2024 & 2032
- Figure 6: North America Precious Metals Market Volume Share (%), by Country 2024 & 2032
- Figure 7: Europe Precious Metals Market Revenue (Billion), by Country 2024 & 2032
- Figure 8: Europe Precious Metals Market Volume (K Tons), by Country 2024 & 2032
- Figure 9: Europe Precious Metals Market Revenue Share (%), by Country 2024 & 2032
- Figure 10: Europe Precious Metals Market Volume Share (%), by Country 2024 & 2032
- Figure 11: Asia Pacific Precious Metals Market Revenue (Billion), by Country 2024 & 2032
- Figure 12: Asia Pacific Precious Metals Market Volume (K Tons), by Country 2024 & 2032
- Figure 13: Asia Pacific Precious Metals Market Revenue Share (%), by Country 2024 & 2032
- Figure 14: Asia Pacific Precious Metals Market Volume Share (%), by Country 2024 & 2032
- Figure 15: South America Precious Metals Market Revenue (Billion), by Country 2024 & 2032
- Figure 16: South America Precious Metals Market Volume (K Tons), by Country 2024 & 2032
- Figure 17: South America Precious Metals Market Revenue Share (%), by Country 2024 & 2032
- Figure 18: South America Precious Metals Market Volume Share (%), by Country 2024 & 2032
- Figure 19: MEA Precious Metals Market Revenue (Billion), by Country 2024 & 2032
- Figure 20: MEA Precious Metals Market Volume (K Tons), by Country 2024 & 2032
- Figure 21: MEA Precious Metals Market Revenue Share (%), by Country 2024 & 2032
- Figure 22: MEA Precious Metals Market Volume Share (%), by Country 2024 & 2032
- Figure 23: Asia Pacific Precious Metals Market Revenue (Billion), by Type 2024 & 2032
- Figure 24: Asia Pacific Precious Metals Market Volume (K Tons), by Type 2024 & 2032
- Figure 25: Asia Pacific Precious Metals Market Revenue Share (%), by Type 2024 & 2032
- Figure 26: Asia Pacific Precious Metals Market Volume Share (%), by Type 2024 & 2032
- Figure 27: Asia Pacific Precious Metals Market Revenue (Billion), by Application 2024 & 2032
- Figure 28: Asia Pacific Precious Metals Market Volume (K Tons), by Application 2024 & 2032
- Figure 29: Asia Pacific Precious Metals Market Revenue Share (%), by Application 2024 & 2032
- Figure 30: Asia Pacific Precious Metals Market Volume Share (%), by Application 2024 & 2032
- Figure 31: Asia Pacific Precious Metals Market Revenue (Billion), by Country 2024 & 2032
- Figure 32: Asia Pacific Precious Metals Market Volume (K Tons), by Country 2024 & 2032
- Figure 33: Asia Pacific Precious Metals Market Revenue Share (%), by Country 2024 & 2032
- Figure 34: Asia Pacific Precious Metals Market Volume Share (%), by Country 2024 & 2032
- Figure 35: North America Precious Metals Market Revenue (Billion), by Type 2024 & 2032
- Figure 36: North America Precious Metals Market Volume (K Tons), by Type 2024 & 2032
- Figure 37: North America Precious Metals Market Revenue Share (%), by Type 2024 & 2032
- Figure 38: North America Precious Metals Market Volume Share (%), by Type 2024 & 2032
- Figure 39: North America Precious Metals Market Revenue (Billion), by Application 2024 & 2032
- Figure 40: North America Precious Metals Market Volume (K Tons), by Application 2024 & 2032
- Figure 41: North America Precious Metals Market Revenue Share (%), by Application 2024 & 2032
- Figure 42: North America Precious Metals Market Volume Share (%), by Application 2024 & 2032
- Figure 43: North America Precious Metals Market Revenue (Billion), by Country 2024 & 2032
- Figure 44: North America Precious Metals Market Volume (K Tons), by Country 2024 & 2032
- Figure 45: North America Precious Metals Market Revenue Share (%), by Country 2024 & 2032
- Figure 46: North America Precious Metals Market Volume Share (%), by Country 2024 & 2032
- Figure 47: Europe Precious Metals Market Revenue (Billion), by Type 2024 & 2032
- Figure 48: Europe Precious Metals Market Volume (K Tons), by Type 2024 & 2032
- Figure 49: Europe Precious Metals Market Revenue Share (%), by Type 2024 & 2032
- Figure 50: Europe Precious Metals Market Volume Share (%), by Type 2024 & 2032
- Figure 51: Europe Precious Metals Market Revenue (Billion), by Application 2024 & 2032
- Figure 52: Europe Precious Metals Market Volume (K Tons), by Application 2024 & 2032
- Figure 53: Europe Precious Metals Market Revenue Share (%), by Application 2024 & 2032
- Figure 54: Europe Precious Metals Market Volume Share (%), by Application 2024 & 2032
- Figure 55: Europe Precious Metals Market Revenue (Billion), by Country 2024 & 2032
- Figure 56: Europe Precious Metals Market Volume (K Tons), by Country 2024 & 2032
- Figure 57: Europe Precious Metals Market Revenue Share (%), by Country 2024 & 2032
- Figure 58: Europe Precious Metals Market Volume Share (%), by Country 2024 & 2032
- Figure 59: South America Precious Metals Market Revenue (Billion), by Type 2024 & 2032
- Figure 60: South America Precious Metals Market Volume (K Tons), by Type 2024 & 2032
- Figure 61: South America Precious Metals Market Revenue Share (%), by Type 2024 & 2032
- Figure 62: South America Precious Metals Market Volume Share (%), by Type 2024 & 2032
- Figure 63: South America Precious Metals Market Revenue (Billion), by Application 2024 & 2032
- Figure 64: South America Precious Metals Market Volume (K Tons), by Application 2024 & 2032
- Figure 65: South America Precious Metals Market Revenue Share (%), by Application 2024 & 2032
- Figure 66: South America Precious Metals Market Volume Share (%), by Application 2024 & 2032
- Figure 67: South America Precious Metals Market Revenue (Billion), by Country 2024 & 2032
- Figure 68: South America Precious Metals Market Volume (K Tons), by Country 2024 & 2032
- Figure 69: South America Precious Metals Market Revenue Share (%), by Country 2024 & 2032
- Figure 70: South America Precious Metals Market Volume Share (%), by Country 2024 & 2032
- Figure 71: Middle East and Africa Precious Metals Market Revenue (Billion), by Type 2024 & 2032
- Figure 72: Middle East and Africa Precious Metals Market Volume (K Tons), by Type 2024 & 2032
- Figure 73: Middle East and Africa Precious Metals Market Revenue Share (%), by Type 2024 & 2032
- Figure 74: Middle East and Africa Precious Metals Market Volume Share (%), by Type 2024 & 2032
- Figure 75: Middle East and Africa Precious Metals Market Revenue (Billion), by Application 2024 & 2032
- Figure 76: Middle East and Africa Precious Metals Market Volume (K Tons), by Application 2024 & 2032
- Figure 77: Middle East and Africa Precious Metals Market Revenue Share (%), by Application 2024 & 2032
- Figure 78: Middle East and Africa Precious Metals Market Volume Share (%), by Application 2024 & 2032
- Figure 79: Middle East and Africa Precious Metals Market Revenue (Billion), by Country 2024 & 2032
- Figure 80: Middle East and Africa Precious Metals Market Volume (K Tons), by Country 2024 & 2032
- Figure 81: Middle East and Africa Precious Metals Market Revenue Share (%), by Country 2024 & 2032
- Figure 82: Middle East and Africa Precious Metals Market Volume Share (%), by Country 2024 & 2032
List of Tables
- Table 1: Global Precious Metals Market Revenue Billion Forecast, by Region 2019 & 2032
- Table 2: Global Precious Metals Market Volume K Tons Forecast, by Region 2019 & 2032
- Table 3: Global Precious Metals Market Revenue Billion Forecast, by Type 2019 & 2032
- Table 4: Global Precious Metals Market Volume K Tons Forecast, by Type 2019 & 2032
- Table 5: Global Precious Metals Market Revenue Billion Forecast, by Application 2019 & 2032
- Table 6: Global Precious Metals Market Volume K Tons Forecast, by Application 2019 & 2032
- Table 7: Global Precious Metals Market Revenue Billion Forecast, by Region 2019 & 2032
- Table 8: Global Precious Metals Market Volume K Tons Forecast, by Region 2019 & 2032
- Table 9: Global Precious Metals Market Revenue Billion Forecast, by Country 2019 & 2032
- Table 10: Global Precious Metals Market Volume K Tons Forecast, by Country 2019 & 2032
- Table 11: United States Precious Metals Market Revenue (Billion) Forecast, by Application 2019 & 2032
- Table 12: United States Precious Metals Market Volume (K Tons) Forecast, by Application 2019 & 2032
- Table 13: Canada Precious Metals Market Revenue (Billion) Forecast, by Application 2019 & 2032
- Table 14: Canada Precious Metals Market Volume (K Tons) Forecast, by Application 2019 & 2032
- Table 15: Mexico Precious Metals Market Revenue (Billion) Forecast, by Application 2019 & 2032
- Table 16: Mexico Precious Metals Market Volume (K Tons) Forecast, by Application 2019 & 2032
- Table 17: Global Precious Metals Market Revenue Billion Forecast, by Country 2019 & 2032
- Table 18: Global Precious Metals Market Volume K Tons Forecast, by Country 2019 & 2032
- Table 19: Germany Precious Metals Market Revenue (Billion) Forecast, by Application 2019 & 2032
- Table 20: Germany Precious Metals Market Volume (K Tons) Forecast, by Application 2019 & 2032
- Table 21: France Precious Metals Market Revenue (Billion) Forecast, by Application 2019 & 2032
- Table 22: France Precious Metals Market Volume (K Tons) Forecast, by Application 2019 & 2032
- Table 23: Italy Precious Metals Market Revenue (Billion) Forecast, by Application 2019 & 2032
- Table 24: Italy Precious Metals Market Volume (K Tons) Forecast, by Application 2019 & 2032
- Table 25: United Kingdom Precious Metals Market Revenue (Billion) Forecast, by Application 2019 & 2032
- Table 26: United Kingdom Precious Metals Market Volume (K Tons) Forecast, by Application 2019 & 2032
- Table 27: Netherlands Precious Metals Market Revenue (Billion) Forecast, by Application 2019 & 2032
- Table 28: Netherlands Precious Metals Market Volume (K Tons) Forecast, by Application 2019 & 2032
- Table 29: Rest of Europe Precious Metals Market Revenue (Billion) Forecast, by Application 2019 & 2032
- Table 30: Rest of Europe Precious Metals Market Volume (K Tons) Forecast, by Application 2019 & 2032
- Table 31: Global Precious Metals Market Revenue Billion Forecast, by Country 2019 & 2032
- Table 32: Global Precious Metals Market Volume K Tons Forecast, by Country 2019 & 2032
- Table 33: China Precious Metals Market Revenue (Billion) Forecast, by Application 2019 & 2032
- Table 34: China Precious Metals Market Volume (K Tons) Forecast, by Application 2019 & 2032
- Table 35: Japan Precious Metals Market Revenue (Billion) Forecast, by Application 2019 & 2032
- Table 36: Japan Precious Metals Market Volume (K Tons) Forecast, by Application 2019 & 2032
- Table 37: India Precious Metals Market Revenue (Billion) Forecast, by Application 2019 & 2032
- Table 38: India Precious Metals Market Volume (K Tons) Forecast, by Application 2019 & 2032
- Table 39: South Korea Precious Metals Market Revenue (Billion) Forecast, by Application 2019 & 2032
- Table 40: South Korea Precious Metals Market Volume (K Tons) Forecast, by Application 2019 & 2032
- Table 41: Taiwan Precious Metals Market Revenue (Billion) Forecast, by Application 2019 & 2032
- Table 42: Taiwan Precious Metals Market Volume (K Tons) Forecast, by Application 2019 & 2032
- Table 43: Australia Precious Metals Market Revenue (Billion) Forecast, by Application 2019 & 2032
- Table 44: Australia Precious Metals Market Volume (K Tons) Forecast, by Application 2019 & 2032
- Table 45: Rest of Asia-Pacific Precious Metals Market Revenue (Billion) Forecast, by Application 2019 & 2032
- Table 46: Rest of Asia-Pacific Precious Metals Market Volume (K Tons) Forecast, by Application 2019 & 2032
- Table 47: Global Precious Metals Market Revenue Billion Forecast, by Country 2019 & 2032
- Table 48: Global Precious Metals Market Volume K Tons Forecast, by Country 2019 & 2032
- Table 49: Brazil Precious Metals Market Revenue (Billion) Forecast, by Application 2019 & 2032
- Table 50: Brazil Precious Metals Market Volume (K Tons) Forecast, by Application 2019 & 2032
- Table 51: Argentina Precious Metals Market Revenue (Billion) Forecast, by Application 2019 & 2032
- Table 52: Argentina Precious Metals Market Volume (K Tons) Forecast, by Application 2019 & 2032
- Table 53: Rest of South America Precious Metals Market Revenue (Billion) Forecast, by Application 2019 & 2032
- Table 54: Rest of South America Precious Metals Market Volume (K Tons) Forecast, by Application 2019 & 2032
- Table 55: Global Precious Metals Market Revenue Billion Forecast, by Country 2019 & 2032
- Table 56: Global Precious Metals Market Volume K Tons Forecast, by Country 2019 & 2032
- Table 57: Middle East Precious Metals Market Revenue (Billion) Forecast, by Application 2019 & 2032
- Table 58: Middle East Precious Metals Market Volume (K Tons) Forecast, by Application 2019 & 2032
- Table 59: Africa Precious Metals Market Revenue (Billion) Forecast, by Application 2019 & 2032
- Table 60: Africa Precious Metals Market Volume (K Tons) Forecast, by Application 2019 & 2032
- Table 61: Global Precious Metals Market Revenue Billion Forecast, by Type 2019 & 2032
- Table 62: Global Precious Metals Market Volume K Tons Forecast, by Type 2019 & 2032
- Table 63: Global Precious Metals Market Revenue Billion Forecast, by Application 2019 & 2032
- Table 64: Global Precious Metals Market Volume K Tons Forecast, by Application 2019 & 2032
- Table 65: Global Precious Metals Market Revenue Billion Forecast, by Country 2019 & 2032
- Table 66: Global Precious Metals Market Volume K Tons Forecast, by Country 2019 & 2032
- Table 67: China Precious Metals Market Revenue (Billion) Forecast, by Application 2019 & 2032
- Table 68: China Precious Metals Market Volume (K Tons) Forecast, by Application 2019 & 2032
- Table 69: India Precious Metals Market Revenue (Billion) Forecast, by Application 2019 & 2032
- Table 70: India Precious Metals Market Volume (K Tons) Forecast, by Application 2019 & 2032
- Table 71: Japan Precious Metals Market Revenue (Billion) Forecast, by Application 2019 & 2032
- Table 72: Japan Precious Metals Market Volume (K Tons) Forecast, by Application 2019 & 2032
- Table 73: South Korea Precious Metals Market Revenue (Billion) Forecast, by Application 2019 & 2032
- Table 74: South Korea Precious Metals Market Volume (K Tons) Forecast, by Application 2019 & 2032
- Table 75: ASEAN Countries Precious Metals Market Revenue (Billion) Forecast, by Application 2019 & 2032
- Table 76: ASEAN Countries Precious Metals Market Volume (K Tons) Forecast, by Application 2019 & 2032
- Table 77: Rest of Asia Pacific Precious Metals Market Revenue (Billion) Forecast, by Application 2019 & 2032
- Table 78: Rest of Asia Pacific Precious Metals Market Volume (K Tons) Forecast, by Application 2019 & 2032
- Table 79: Global Precious Metals Market Revenue Billion Forecast, by Type 2019 & 2032
- Table 80: Global Precious Metals Market Volume K Tons Forecast, by Type 2019 & 2032
- Table 81: Global Precious Metals Market Revenue Billion Forecast, by Application 2019 & 2032
- Table 82: Global Precious Metals Market Volume K Tons Forecast, by Application 2019 & 2032
- Table 83: Global Precious Metals Market Revenue Billion Forecast, by Country 2019 & 2032
- Table 84: Global Precious Metals Market Volume K Tons Forecast, by Country 2019 & 2032
- Table 85: United States Precious Metals Market Revenue (Billion) Forecast, by Application 2019 & 2032
- Table 86: United States Precious Metals Market Volume (K Tons) Forecast, by Application 2019 & 2032
- Table 87: Canada Precious Metals Market Revenue (Billion) Forecast, by Application 2019 & 2032
- Table 88: Canada Precious Metals Market Volume (K Tons) Forecast, by Application 2019 & 2032
- Table 89: Mexico Precious Metals Market Revenue (Billion) Forecast, by Application 2019 & 2032
- Table 90: Mexico Precious Metals Market Volume (K Tons) Forecast, by Application 2019 & 2032
- Table 91: Global Precious Metals Market Revenue Billion Forecast, by Type 2019 & 2032
- Table 92: Global Precious Metals Market Volume K Tons Forecast, by Type 2019 & 2032
- Table 93: Global Precious Metals Market Revenue Billion Forecast, by Application 2019 & 2032
- Table 94: Global Precious Metals Market Volume K Tons Forecast, by Application 2019 & 2032
- Table 95: Global Precious Metals Market Revenue Billion Forecast, by Country 2019 & 2032
- Table 96: Global Precious Metals Market Volume K Tons Forecast, by Country 2019 & 2032
- Table 97: Germany Precious Metals Market Revenue (Billion) Forecast, by Application 2019 & 2032
- Table 98: Germany Precious Metals Market Volume (K Tons) Forecast, by Application 2019 & 2032
- Table 99: United Kingdom Precious Metals Market Revenue (Billion) Forecast, by Application 2019 & 2032
- Table 100: United Kingdom Precious Metals Market Volume (K Tons) Forecast, by Application 2019 & 2032
- Table 101: Italy Precious Metals Market Revenue (Billion) Forecast, by Application 2019 & 2032
- Table 102: Italy Precious Metals Market Volume (K Tons) Forecast, by Application 2019 & 2032
- Table 103: France Precious Metals Market Revenue (Billion) Forecast, by Application 2019 & 2032
- Table 104: France Precious Metals Market Volume (K Tons) Forecast, by Application 2019 & 2032
- Table 105: Rest of Europe Precious Metals Market Revenue (Billion) Forecast, by Application 2019 & 2032
- Table 106: Rest of Europe Precious Metals Market Volume (K Tons) Forecast, by Application 2019 & 2032
- Table 107: Global Precious Metals Market Revenue Billion Forecast, by Type 2019 & 2032
- Table 108: Global Precious Metals Market Volume K Tons Forecast, by Type 2019 & 2032
- Table 109: Global Precious Metals Market Revenue Billion Forecast, by Application 2019 & 2032
- Table 110: Global Precious Metals Market Volume K Tons Forecast, by Application 2019 & 2032
- Table 111: Global Precious Metals Market Revenue Billion Forecast, by Country 2019 & 2032
- Table 112: Global Precious Metals Market Volume K Tons Forecast, by Country 2019 & 2032
- Table 113: Brazil Precious Metals Market Revenue (Billion) Forecast, by Application 2019 & 2032
- Table 114: Brazil Precious Metals Market Volume (K Tons) Forecast, by Application 2019 & 2032
- Table 115: Argentina Precious Metals Market Revenue (Billion) Forecast, by Application 2019 & 2032
- Table 116: Argentina Precious Metals Market Volume (K Tons) Forecast, by Application 2019 & 2032
- Table 117: Rest of South America Precious Metals Market Revenue (Billion) Forecast, by Application 2019 & 2032
- Table 118: Rest of South America Precious Metals Market Volume (K Tons) Forecast, by Application 2019 & 2032
- Table 119: Global Precious Metals Market Revenue Billion Forecast, by Type 2019 & 2032
- Table 120: Global Precious Metals Market Volume K Tons Forecast, by Type 2019 & 2032
- Table 121: Global Precious Metals Market Revenue Billion Forecast, by Application 2019 & 2032
- Table 122: Global Precious Metals Market Volume K Tons Forecast, by Application 2019 & 2032
- Table 123: Global Precious Metals Market Revenue Billion Forecast, by Country 2019 & 2032
- Table 124: Global Precious Metals Market Volume K Tons Forecast, by Country 2019 & 2032
- Table 125: Saudi Arabia Precious Metals Market Revenue (Billion) Forecast, by Application 2019 & 2032
- Table 126: Saudi Arabia Precious Metals Market Volume (K Tons) Forecast, by Application 2019 & 2032
- Table 127: South Africa Precious Metals Market Revenue (Billion) Forecast, by Application 2019 & 2032
- Table 128: South Africa Precious Metals Market Volume (K Tons) Forecast, by Application 2019 & 2032
- Table 129: Rest of Middle East and Africa Precious Metals Market Revenue (Billion) Forecast, by Application 2019 & 2032
- Table 130: Rest of Middle East and Africa Precious Metals Market Volume (K Tons) Forecast, by Application 2019 & 2032
Frequently Asked Questions
1. What is the projected Compound Annual Growth Rate (CAGR) of the Precious Metals Market?
The projected CAGR is approximately 5.5%.
2. Which companies are prominent players in the Precious Metals Market?
Key companies in the market include Heraeus Holding, Shaanxi kaida chemical co LTD, Clariant, Kaili Catalyst New Materials CO LTD, Umicore Galvanotechnik GmbH, American Elements, CHIMET, Evonik Industries AG, Sabin Metal Corporation, Souvenier Chemicals, ReMetall Deutschland AG, BASF SE, Stanford Advanced Materials, Catalytic Products International, J&J Materials Inc, Alfa Aesar Thermo Fisher Scientific, Johnson Matthey, ALS Limited.
3. What are the main segments of the Precious Metals Market?
The market segments include Type, Application.
4. Can you provide details about the market size?
The market size is estimated to be USD 306.4 Billion as of 2022.
5. What are some drivers contributing to market growth?
Accelerating Demand for High-Performance Transportation Fuel; Increasing Investment in Refineries; Other Drivers.
6. What are the notable trends driving market growth?
Automotive Segment to Dominate the Market.
7. Are there any restraints impacting market growth?
High Production Costs; Other Restraints.
8. Can you provide examples of recent developments in the market?
Recent developments in the market studied will be covered in the final report.
9. What pricing options are available for accessing the report?
Pricing options include single-user, multi-user, and enterprise licenses priced at USD 4750, USD 5250, and USD 8750 respectively.
10. Is the market size provided in terms of value or volume?
The market size is provided in terms of value, measured in Billion and volume, measured in K Tons.
11. Are there any specific market keywords associated with the report?
Yes, the market keyword associated with the report is "Precious Metals Market," which aids in identifying and referencing the specific market segment covered.
12. How do I determine which pricing option suits my needs best?
The pricing options vary based on user requirements and access needs. Individual users may opt for single-user licenses, while businesses requiring broader access may choose multi-user or enterprise licenses for cost-effective access to the report.
13. Are there any additional resources or data provided in the Precious Metals Market report?
While the report offers comprehensive insights, it's advisable to review the specific contents or supplementary materials provided to ascertain if additional resources or data are available.
14. How can I stay updated on further developments or reports in the Precious Metals Market?
To stay informed about further developments, trends, and reports in the Precious Metals Market, consider subscribing to industry newsletters, following relevant companies and organizations, or regularly checking reputable industry news sources and publications.
Methodology
Step 1 - Identification of Relevant Samples Size from Population Database


Step 2 - Approaches for Defining Global Market Size (Value, Volume* & Price*)

Note*: In applicable scenarios
Step 3 - Data Sources
Primary Research
- Web Analytics
- Survey Reports
- Research Institute
- Latest Research Reports
- Opinion Leaders
Secondary Research
- Annual Reports
- White Paper
- Latest Press Release
- Industry Association
- Paid Database
- Investor Presentations

Step 4 - Data Triangulation
Involves using different sources of information in order to increase the validity of a study
These sources are likely to be stakeholders in a program - participants, other researchers, program staff, other community members, and so on.
Then we put all data in single framework & apply various statistical tools to find out the dynamic on the market.
During the analysis stage, feedback from the stakeholder groups would be compared to determine areas of agreement as well as areas of divergence


