
Key Insights
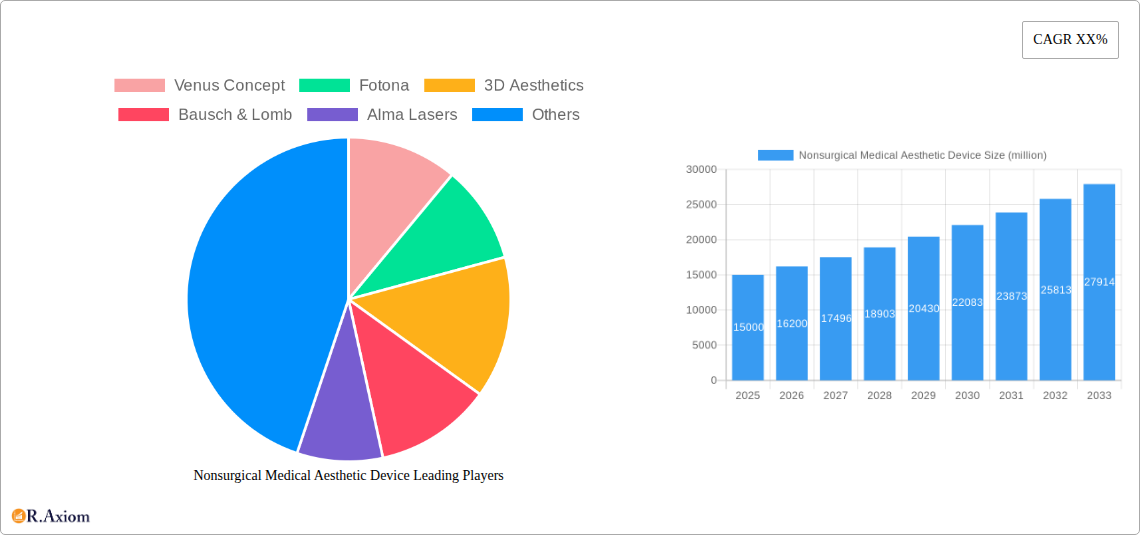
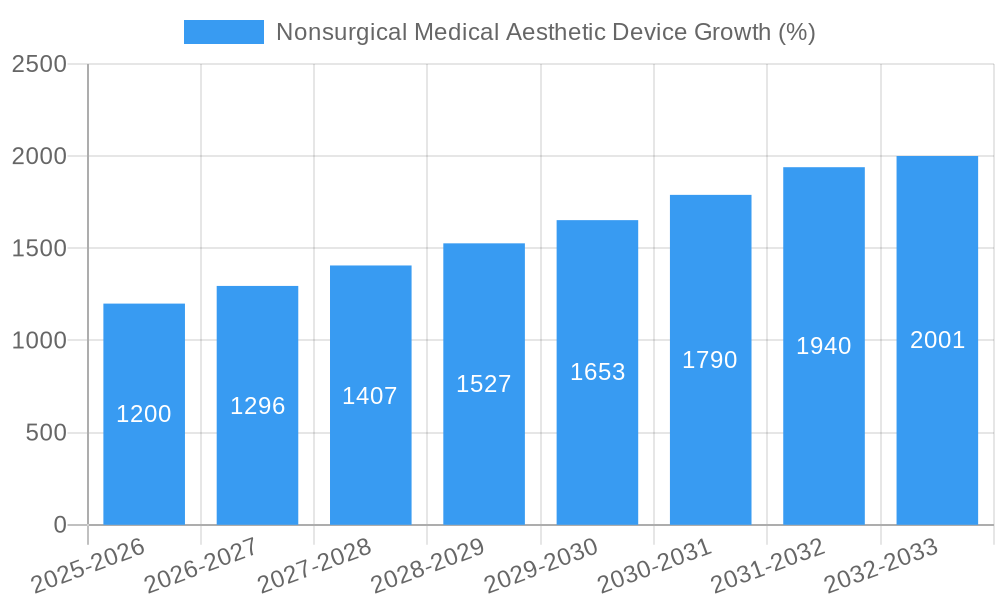
The nonsurgical medical aesthetic device market is experiencing robust growth, driven by increasing consumer demand for minimally invasive procedures, technological advancements leading to safer and more effective treatments, and rising disposable incomes globally. The market's value in 2025 is estimated at $15 billion, projecting a Compound Annual Growth Rate (CAGR) of 8% from 2025 to 2033. This expansion is fueled by several key factors: the growing popularity of non-invasive treatments like Botox and fillers, the increasing acceptance of aesthetic procedures among men, and the expansion of the market into emerging economies with rising middle classes. Technological innovation is a crucial driver, with advancements in laser technology, radiofrequency devices, and ultrasound leading to more precise treatments with reduced downtime and improved outcomes. However, the market also faces challenges, such as regulatory hurdles for new device approvals and varying levels of reimbursement from insurance companies, which can influence treatment accessibility and affordability.
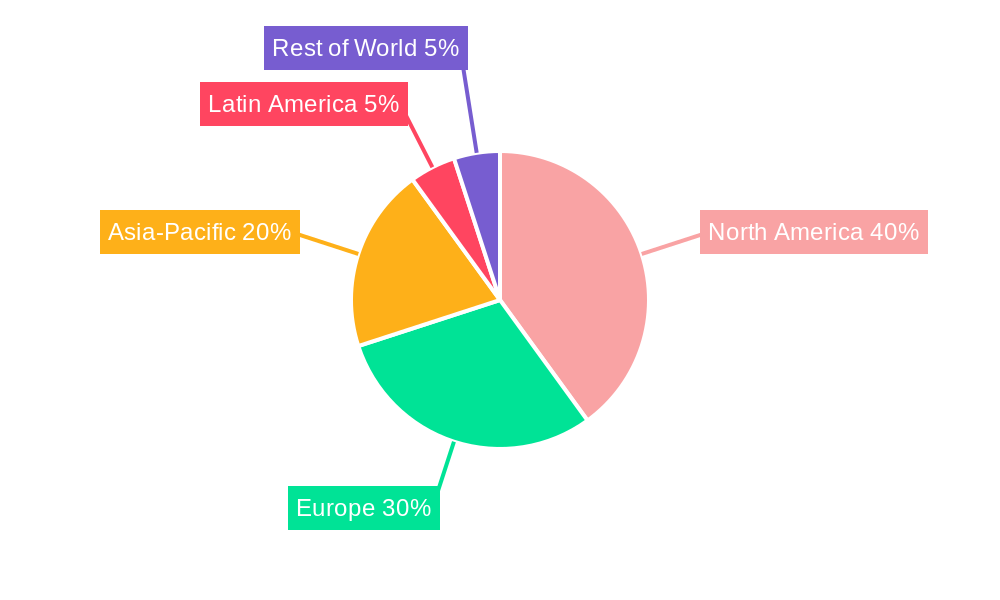
Segmentation within the market reveals strong performance across various device types. Energy-based devices (laser, radiofrequency, ultrasound) dominate, fueled by the versatility and effectiveness of their applications. Injectable fillers, another significant segment, are witnessing growth due to their quick and effective results, while other segments, such as micro-needling devices, are also contributing to the overall market expansion. Key players like Venus Concept, Fotona, Alma Lasers, and others are investing heavily in research and development, product innovation, and strategic acquisitions to maintain a competitive edge. Geographic analysis reveals a strong presence in North America and Europe, but significant growth potential exists in Asia-Pacific and Latin America as awareness and adoption of these procedures increase. The forecast period from 2025 to 2033 promises sustained expansion, driven by evolving consumer preferences and ongoing technological advancements, making the nonsurgical medical aesthetic device market a highly lucrative and dynamic sector.
Nonsurgical Medical Aesthetic Device Market Report: 2019-2033
This comprehensive report provides a detailed analysis of the global nonsurgical medical aesthetic device market from 2019 to 2033, offering invaluable insights for industry stakeholders, investors, and strategic decision-makers. The report covers market size, segmentation, competitive landscape, technological advancements, and future growth prospects, with a focus on key players and emerging trends. The study period spans 2019-2033, with 2025 as the base and estimated year, and a forecast period of 2025-2033. The historical period analyzed is 2019-2024. The market is valued at xx million USD in 2025 and is projected to reach xx million USD by 2033, exhibiting a CAGR of xx% during the forecast period.
Nonsurgical Medical Aesthetic Device Market Concentration & Innovation
The nonsurgical medical aesthetic device market is moderately concentrated, with several key players holding significant market share. Venus Concept, Alma Lasers, and Cutera, among others, command substantial portions of the market, estimated at a combined xx million USD in revenue in 2025. However, the market also features numerous smaller companies specializing in niche technologies or geographic regions. The market exhibits significant innovation, driven by advancements in energy-based technologies (laser, ultrasound, radiofrequency), injectables, and software solutions.
- Market Share (2025 Estimate): Venus Concept (xx%), Alma Lasers (xx%), Cutera (xx%), Others (xx%).
- Innovation Drivers: Technological advancements, rising consumer demand for minimally invasive procedures, and increased regulatory approvals.
- Regulatory Framework: Stringent regulatory approvals and safety standards are influencing market growth, promoting safety and efficacy.
- Product Substitutes: Competition from alternative treatments like traditional surgeries and home-use devices exerts moderate pressure.
- End-User Trends: Growing preference for non-invasive procedures among millennials and Gen Z is driving market expansion.
- M&A Activities: The past five years have witnessed xx million USD worth of mergers and acquisitions, with a significant number of smaller players acquired by larger companies to expand their portfolios.
Nonsurgical Medical Aesthetic Device Industry Trends & Insights
The global nonsurgical medical aesthetic device market is experiencing robust growth, propelled by several key factors. Increasing disposable incomes, particularly in emerging economies, are boosting consumer spending on aesthetic enhancements. The growing awareness about non-invasive cosmetic procedures and their safety profiles is fueling market expansion. Technological advancements such as AI-powered devices and personalized treatment plans contribute to higher efficacy and better patient outcomes, further driving adoption. The market is witnessing a shift towards personalized treatments, with devices offering customized solutions tailored to individual needs. Competitive dynamics are intense, with established players investing heavily in research and development and new entrants constantly emerging.
- Market Growth Drivers: Rising disposable incomes, increased consumer awareness, technological advancements, and favorable regulatory environment.
- Technological Disruptions: AI-powered devices, improved energy sources, and personalized treatment approaches are transforming the landscape.
- Consumer Preferences: Demand for minimally invasive, quick-recovery procedures with noticeable results is rising significantly.
- Competitive Dynamics: Intense competition amongst established players and new entrants is driving innovation and price competitiveness.
Dominant Markets & Segments in Nonsurgical Medical Aesthetic Device
The North American region currently dominates the nonsurgical medical aesthetic device market, accounting for xx million USD in revenue in 2025. This dominance is attributable to several factors:
- Key Drivers (North America): High disposable income levels, advanced healthcare infrastructure, strong regulatory frameworks, and high awareness of aesthetic procedures.
- Dominance Analysis: The well-established medical aesthetics industry in the US and Canada, coupled with high consumer demand and the presence of major device manufacturers, contributes to the region’s leading position. Europe is another important market, characterized by high adoption rates, followed by Asia Pacific exhibiting significant growth potential due to rising disposable income and increasing awareness of aesthetics.
Nonsurgical Medical Aesthetic Device Product Developments
Recent product developments have focused on enhancing efficacy, minimizing downtime, and expanding treatment applications. Innovative energy-based devices are increasingly incorporating advanced features such as real-time feedback systems, improved cooling mechanisms, and treatment parameter customization. The integration of artificial intelligence is gaining traction, enabling more personalized treatment plans and enhanced outcomes. Several new devices are gaining market traction by offering non-invasive treatments addressing a wider range of aesthetic concerns.
Report Scope & Segmentation Analysis
The report segments the nonsurgical medical aesthetic device market based on several key parameters:
- By Technology: Laser, Ultrasound, Radiofrequency, Micro-needling, Light-based devices, etc. Each segment exhibits distinct growth trajectories, with laser technologies currently leading, followed closely by radiofrequency treatments. The market size for each segment is detailed in the report.
- By Application: Skin rejuvenation, body contouring, hair removal, acne treatment. Growth varies across applications, with skin rejuvenation and body contouring showing particularly strong growth. The competitive landscape is also segmented by application area.
- By End User: Hospitals, clinics, dermatology practices. The majority of procedures are performed in specialized clinics and dermatology practices.
Key Drivers of Nonsurgical Medical Aesthetic Device Growth
The market's expansion is driven by several factors:
- Technological Advancements: Continuous innovation in energy-based devices and software platforms leading to improved efficacy, safety, and patient experience.
- Economic Factors: Rising disposable incomes and increased healthcare spending contribute to higher demand for aesthetic procedures.
- Regulatory Approvals: Regulatory approvals for new and improved devices accelerate market penetration.
Challenges in the Nonsurgical Medical Aesthetic Device Sector
The nonsurgical medical aesthetic device sector faces several challenges:
- Regulatory Hurdles: Stringent regulatory approvals and safety standards can delay product launches and increase development costs.
- Supply Chain Issues: Disruptions in the global supply chain can impact device availability and pricing.
- Competitive Pressure: Intense competition requires continuous innovation and marketing efforts to maintain market share.
Emerging Opportunities in Nonsurgical Medical Aesthetic Device
Several emerging trends present opportunities for growth:
- Expansion into Emerging Markets: Untapped potential exists in developing economies with rising disposable incomes and increased awareness of aesthetic procedures.
- Technological Advancements: The integration of AI, virtual reality, and personalized treatment plans offers scope for innovation.
- New Treatment Applications: Expanding applications to address diverse aesthetic concerns can open new market segments.
Leading Players in the Nonsurgical Medical Aesthetic Device Market
- Venus Concept
- Fotona
- 3D Aesthetics
- Bausch & Lomb
- Alma Lasers
- BTL
- Rohrer
- Solta Medical
- Lynton
- Cutera
- Lumenis
- Candela
- Fraxel laser
- Clinipro
- Ultherapy
- STRATA Skin Sciences
- Sciton
- El.En. S.p.A.
- INMODE
Key Developments in Nonsurgical Medical Aesthetic Device Industry
- 2022-Q4: Venus Concept launched a new radiofrequency device for body contouring.
- 2023-Q1: Alma Lasers received FDA clearance for a novel laser-based skin rejuvenation system.
- 2023-Q2: A major merger between two key players resulted in a significant shift in market share. (Further details within the full report.)
Strategic Outlook for Nonsurgical Medical Aesthetic Device Market
The nonsurgical medical aesthetic device market is poised for continued expansion, driven by technological innovation, rising consumer demand, and expansion into new markets. The integration of artificial intelligence and personalized treatment options will further enhance market growth. Strategic partnerships and acquisitions will continue to shape the competitive landscape, with a focus on expanding product portfolios and penetrating new geographical regions. The forecast period suggests substantial growth opportunities for companies that can innovate, adapt to changing consumer preferences, and navigate the regulatory landscape effectively.
Nonsurgical Medical Aesthetic Device Segmentation
-
1. Application
- 1.1. Hospital
- 1.2. Clinic
- 1.3. Beauty Salon
- 1.4. Others
-
2. Types
- 2.1. Body Shaping Equipment
- 2.2. Hair Removal Equipment
- 2.3. Facial Beauty Equipment
- 2.4. Others
Nonsurgical Medical Aesthetic Device Segmentation By Geography
-
1. North America
- 1.1. United States
- 1.2. Canada
- 1.3. Mexico
-
2. South America
- 2.1. Brazil
- 2.2. Argentina
- 2.3. Rest of South America
-
3. Europe
- 3.1. United Kingdom
- 3.2. Germany
- 3.3. France
- 3.4. Italy
- 3.5. Spain
- 3.6. Russia
- 3.7. Benelux
- 3.8. Nordics
- 3.9. Rest of Europe
-
4. Middle East & Africa
- 4.1. Turkey
- 4.2. Israel
- 4.3. GCC
- 4.4. North Africa
- 4.5. South Africa
- 4.6. Rest of Middle East & Africa
-
5. Asia Pacific
- 5.1. China
- 5.2. India
- 5.3. Japan
- 5.4. South Korea
- 5.5. ASEAN
- 5.6. Oceania
- 5.7. Rest of Asia Pacific
Nonsurgical Medical Aesthetic Device REPORT HIGHLIGHTS
| Aspects | Details |
|---|---|
| Study Period | 2019-2033 |
| Base Year | 2024 |
| Estimated Year | 2025 |
| Forecast Period | 2025-2033 |
| Historical Period | 2019-2024 |
| Growth Rate | CAGR of XX% from 2019-2033 |
| Segmentation |
|
Table of Contents
- 1. Introduction
- 1.1. Research Scope
- 1.2. Market Segmentation
- 1.3. Research Methodology
- 1.4. Definitions and Assumptions
- 2. Executive Summary
- 2.1. Introduction
- 3. Market Dynamics
- 3.1. Introduction
- 3.2. Market Drivers
- 3.3. Market Restrains
- 3.4. Market Trends
- 4. Market Factor Analysis
- 4.1. Porters Five Forces
- 4.2. Supply/Value Chain
- 4.3. PESTEL analysis
- 4.4. Market Entropy
- 4.5. Patent/Trademark Analysis
- 5. Global Nonsurgical Medical Aesthetic Device Analysis, Insights and Forecast, 2019-2031
- 5.1. Market Analysis, Insights and Forecast - by Application
- 5.1.1. Hospital
- 5.1.2. Clinic
- 5.1.3. Beauty Salon
- 5.1.4. Others
- 5.2. Market Analysis, Insights and Forecast - by Types
- 5.2.1. Body Shaping Equipment
- 5.2.2. Hair Removal Equipment
- 5.2.3. Facial Beauty Equipment
- 5.2.4. Others
- 5.3. Market Analysis, Insights and Forecast - by Region
- 5.3.1. North America
- 5.3.2. South America
- 5.3.3. Europe
- 5.3.4. Middle East & Africa
- 5.3.5. Asia Pacific
- 5.1. Market Analysis, Insights and Forecast - by Application
- 6. North America Nonsurgical Medical Aesthetic Device Analysis, Insights and Forecast, 2019-2031
- 6.1. Market Analysis, Insights and Forecast - by Application
- 6.1.1. Hospital
- 6.1.2. Clinic
- 6.1.3. Beauty Salon
- 6.1.4. Others
- 6.2. Market Analysis, Insights and Forecast - by Types
- 6.2.1. Body Shaping Equipment
- 6.2.2. Hair Removal Equipment
- 6.2.3. Facial Beauty Equipment
- 6.2.4. Others
- 6.1. Market Analysis, Insights and Forecast - by Application
- 7. South America Nonsurgical Medical Aesthetic Device Analysis, Insights and Forecast, 2019-2031
- 7.1. Market Analysis, Insights and Forecast - by Application
- 7.1.1. Hospital
- 7.1.2. Clinic
- 7.1.3. Beauty Salon
- 7.1.4. Others
- 7.2. Market Analysis, Insights and Forecast - by Types
- 7.2.1. Body Shaping Equipment
- 7.2.2. Hair Removal Equipment
- 7.2.3. Facial Beauty Equipment
- 7.2.4. Others
- 7.1. Market Analysis, Insights and Forecast - by Application
- 8. Europe Nonsurgical Medical Aesthetic Device Analysis, Insights and Forecast, 2019-2031
- 8.1. Market Analysis, Insights and Forecast - by Application
- 8.1.1. Hospital
- 8.1.2. Clinic
- 8.1.3. Beauty Salon
- 8.1.4. Others
- 8.2. Market Analysis, Insights and Forecast - by Types
- 8.2.1. Body Shaping Equipment
- 8.2.2. Hair Removal Equipment
- 8.2.3. Facial Beauty Equipment
- 8.2.4. Others
- 8.1. Market Analysis, Insights and Forecast - by Application
- 9. Middle East & Africa Nonsurgical Medical Aesthetic Device Analysis, Insights and Forecast, 2019-2031
- 9.1. Market Analysis, Insights and Forecast - by Application
- 9.1.1. Hospital
- 9.1.2. Clinic
- 9.1.3. Beauty Salon
- 9.1.4. Others
- 9.2. Market Analysis, Insights and Forecast - by Types
- 9.2.1. Body Shaping Equipment
- 9.2.2. Hair Removal Equipment
- 9.2.3. Facial Beauty Equipment
- 9.2.4. Others
- 9.1. Market Analysis, Insights and Forecast - by Application
- 10. Asia Pacific Nonsurgical Medical Aesthetic Device Analysis, Insights and Forecast, 2019-2031
- 10.1. Market Analysis, Insights and Forecast - by Application
- 10.1.1. Hospital
- 10.1.2. Clinic
- 10.1.3. Beauty Salon
- 10.1.4. Others
- 10.2. Market Analysis, Insights and Forecast - by Types
- 10.2.1. Body Shaping Equipment
- 10.2.2. Hair Removal Equipment
- 10.2.3. Facial Beauty Equipment
- 10.2.4. Others
- 10.1. Market Analysis, Insights and Forecast - by Application
- 11. Competitive Analysis
- 11.1. Global Market Share Analysis 2024
- 11.2. Company Profiles
- 11.2.1 Venus Concept
- 11.2.1.1. Overview
- 11.2.1.2. Products
- 11.2.1.3. SWOT Analysis
- 11.2.1.4. Recent Developments
- 11.2.1.5. Financials (Based on Availability)
- 11.2.2 Fotona
- 11.2.2.1. Overview
- 11.2.2.2. Products
- 11.2.2.3. SWOT Analysis
- 11.2.2.4. Recent Developments
- 11.2.2.5. Financials (Based on Availability)
- 11.2.3 3D Aesthetics
- 11.2.3.1. Overview
- 11.2.3.2. Products
- 11.2.3.3. SWOT Analysis
- 11.2.3.4. Recent Developments
- 11.2.3.5. Financials (Based on Availability)
- 11.2.4 Bausch & Lomb
- 11.2.4.1. Overview
- 11.2.4.2. Products
- 11.2.4.3. SWOT Analysis
- 11.2.4.4. Recent Developments
- 11.2.4.5. Financials (Based on Availability)
- 11.2.5 Alma Lasers
- 11.2.5.1. Overview
- 11.2.5.2. Products
- 11.2.5.3. SWOT Analysis
- 11.2.5.4. Recent Developments
- 11.2.5.5. Financials (Based on Availability)
- 11.2.6 BTL
- 11.2.6.1. Overview
- 11.2.6.2. Products
- 11.2.6.3. SWOT Analysis
- 11.2.6.4. Recent Developments
- 11.2.6.5. Financials (Based on Availability)
- 11.2.7 Rohrer
- 11.2.7.1. Overview
- 11.2.7.2. Products
- 11.2.7.3. SWOT Analysis
- 11.2.7.4. Recent Developments
- 11.2.7.5. Financials (Based on Availability)
- 11.2.8 Solta Medical
- 11.2.8.1. Overview
- 11.2.8.2. Products
- 11.2.8.3. SWOT Analysis
- 11.2.8.4. Recent Developments
- 11.2.8.5. Financials (Based on Availability)
- 11.2.9 Lynton
- 11.2.9.1. Overview
- 11.2.9.2. Products
- 11.2.9.3. SWOT Analysis
- 11.2.9.4. Recent Developments
- 11.2.9.5. Financials (Based on Availability)
- 11.2.10 Cutera
- 11.2.10.1. Overview
- 11.2.10.2. Products
- 11.2.10.3. SWOT Analysis
- 11.2.10.4. Recent Developments
- 11.2.10.5. Financials (Based on Availability)
- 11.2.11 Lumenis
- 11.2.11.1. Overview
- 11.2.11.2. Products
- 11.2.11.3. SWOT Analysis
- 11.2.11.4. Recent Developments
- 11.2.11.5. Financials (Based on Availability)
- 11.2.12 Candela
- 11.2.12.1. Overview
- 11.2.12.2. Products
- 11.2.12.3. SWOT Analysis
- 11.2.12.4. Recent Developments
- 11.2.12.5. Financials (Based on Availability)
- 11.2.13 Fraxel laser
- 11.2.13.1. Overview
- 11.2.13.2. Products
- 11.2.13.3. SWOT Analysis
- 11.2.13.4. Recent Developments
- 11.2.13.5. Financials (Based on Availability)
- 11.2.14 Clinipro
- 11.2.14.1. Overview
- 11.2.14.2. Products
- 11.2.14.3. SWOT Analysis
- 11.2.14.4. Recent Developments
- 11.2.14.5. Financials (Based on Availability)
- 11.2.15 Ultherapy
- 11.2.15.1. Overview
- 11.2.15.2. Products
- 11.2.15.3. SWOT Analysis
- 11.2.15.4. Recent Developments
- 11.2.15.5. Financials (Based on Availability)
- 11.2.16 STRATA Skin Sciences
- 11.2.16.1. Overview
- 11.2.16.2. Products
- 11.2.16.3. SWOT Analysis
- 11.2.16.4. Recent Developments
- 11.2.16.5. Financials (Based on Availability)
- 11.2.17 Sciton
- 11.2.17.1. Overview
- 11.2.17.2. Products
- 11.2.17.3. SWOT Analysis
- 11.2.17.4. Recent Developments
- 11.2.17.5. Financials (Based on Availability)
- 11.2.18 El.En. S.p.A.
- 11.2.18.1. Overview
- 11.2.18.2. Products
- 11.2.18.3. SWOT Analysis
- 11.2.18.4. Recent Developments
- 11.2.18.5. Financials (Based on Availability)
- 11.2.19 INMODE
- 11.2.19.1. Overview
- 11.2.19.2. Products
- 11.2.19.3. SWOT Analysis
- 11.2.19.4. Recent Developments
- 11.2.19.5. Financials (Based on Availability)
- 11.2.1 Venus Concept
List of Figures
- Figure 1: Global Nonsurgical Medical Aesthetic Device Revenue Breakdown (million, %) by Region 2024 & 2032
- Figure 2: Global Nonsurgical Medical Aesthetic Device Volume Breakdown (K, %) by Region 2024 & 2032
- Figure 3: North America Nonsurgical Medical Aesthetic Device Revenue (million), by Application 2024 & 2032
- Figure 4: North America Nonsurgical Medical Aesthetic Device Volume (K), by Application 2024 & 2032
- Figure 5: North America Nonsurgical Medical Aesthetic Device Revenue Share (%), by Application 2024 & 2032
- Figure 6: North America Nonsurgical Medical Aesthetic Device Volume Share (%), by Application 2024 & 2032
- Figure 7: North America Nonsurgical Medical Aesthetic Device Revenue (million), by Types 2024 & 2032
- Figure 8: North America Nonsurgical Medical Aesthetic Device Volume (K), by Types 2024 & 2032
- Figure 9: North America Nonsurgical Medical Aesthetic Device Revenue Share (%), by Types 2024 & 2032
- Figure 10: North America Nonsurgical Medical Aesthetic Device Volume Share (%), by Types 2024 & 2032
- Figure 11: North America Nonsurgical Medical Aesthetic Device Revenue (million), by Country 2024 & 2032
- Figure 12: North America Nonsurgical Medical Aesthetic Device Volume (K), by Country 2024 & 2032
- Figure 13: North America Nonsurgical Medical Aesthetic Device Revenue Share (%), by Country 2024 & 2032
- Figure 14: North America Nonsurgical Medical Aesthetic Device Volume Share (%), by Country 2024 & 2032
- Figure 15: South America Nonsurgical Medical Aesthetic Device Revenue (million), by Application 2024 & 2032
- Figure 16: South America Nonsurgical Medical Aesthetic Device Volume (K), by Application 2024 & 2032
- Figure 17: South America Nonsurgical Medical Aesthetic Device Revenue Share (%), by Application 2024 & 2032
- Figure 18: South America Nonsurgical Medical Aesthetic Device Volume Share (%), by Application 2024 & 2032
- Figure 19: South America Nonsurgical Medical Aesthetic Device Revenue (million), by Types 2024 & 2032
- Figure 20: South America Nonsurgical Medical Aesthetic Device Volume (K), by Types 2024 & 2032
- Figure 21: South America Nonsurgical Medical Aesthetic Device Revenue Share (%), by Types 2024 & 2032
- Figure 22: South America Nonsurgical Medical Aesthetic Device Volume Share (%), by Types 2024 & 2032
- Figure 23: South America Nonsurgical Medical Aesthetic Device Revenue (million), by Country 2024 & 2032
- Figure 24: South America Nonsurgical Medical Aesthetic Device Volume (K), by Country 2024 & 2032
- Figure 25: South America Nonsurgical Medical Aesthetic Device Revenue Share (%), by Country 2024 & 2032
- Figure 26: South America Nonsurgical Medical Aesthetic Device Volume Share (%), by Country 2024 & 2032
- Figure 27: Europe Nonsurgical Medical Aesthetic Device Revenue (million), by Application 2024 & 2032
- Figure 28: Europe Nonsurgical Medical Aesthetic Device Volume (K), by Application 2024 & 2032
- Figure 29: Europe Nonsurgical Medical Aesthetic Device Revenue Share (%), by Application 2024 & 2032
- Figure 30: Europe Nonsurgical Medical Aesthetic Device Volume Share (%), by Application 2024 & 2032
- Figure 31: Europe Nonsurgical Medical Aesthetic Device Revenue (million), by Types 2024 & 2032
- Figure 32: Europe Nonsurgical Medical Aesthetic Device Volume (K), by Types 2024 & 2032
- Figure 33: Europe Nonsurgical Medical Aesthetic Device Revenue Share (%), by Types 2024 & 2032
- Figure 34: Europe Nonsurgical Medical Aesthetic Device Volume Share (%), by Types 2024 & 2032
- Figure 35: Europe Nonsurgical Medical Aesthetic Device Revenue (million), by Country 2024 & 2032
- Figure 36: Europe Nonsurgical Medical Aesthetic Device Volume (K), by Country 2024 & 2032
- Figure 37: Europe Nonsurgical Medical Aesthetic Device Revenue Share (%), by Country 2024 & 2032
- Figure 38: Europe Nonsurgical Medical Aesthetic Device Volume Share (%), by Country 2024 & 2032
- Figure 39: Middle East & Africa Nonsurgical Medical Aesthetic Device Revenue (million), by Application 2024 & 2032
- Figure 40: Middle East & Africa Nonsurgical Medical Aesthetic Device Volume (K), by Application 2024 & 2032
- Figure 41: Middle East & Africa Nonsurgical Medical Aesthetic Device Revenue Share (%), by Application 2024 & 2032
- Figure 42: Middle East & Africa Nonsurgical Medical Aesthetic Device Volume Share (%), by Application 2024 & 2032
- Figure 43: Middle East & Africa Nonsurgical Medical Aesthetic Device Revenue (million), by Types 2024 & 2032
- Figure 44: Middle East & Africa Nonsurgical Medical Aesthetic Device Volume (K), by Types 2024 & 2032
- Figure 45: Middle East & Africa Nonsurgical Medical Aesthetic Device Revenue Share (%), by Types 2024 & 2032
- Figure 46: Middle East & Africa Nonsurgical Medical Aesthetic Device Volume Share (%), by Types 2024 & 2032
- Figure 47: Middle East & Africa Nonsurgical Medical Aesthetic Device Revenue (million), by Country 2024 & 2032
- Figure 48: Middle East & Africa Nonsurgical Medical Aesthetic Device Volume (K), by Country 2024 & 2032
- Figure 49: Middle East & Africa Nonsurgical Medical Aesthetic Device Revenue Share (%), by Country 2024 & 2032
- Figure 50: Middle East & Africa Nonsurgical Medical Aesthetic Device Volume Share (%), by Country 2024 & 2032
- Figure 51: Asia Pacific Nonsurgical Medical Aesthetic Device Revenue (million), by Application 2024 & 2032
- Figure 52: Asia Pacific Nonsurgical Medical Aesthetic Device Volume (K), by Application 2024 & 2032
- Figure 53: Asia Pacific Nonsurgical Medical Aesthetic Device Revenue Share (%), by Application 2024 & 2032
- Figure 54: Asia Pacific Nonsurgical Medical Aesthetic Device Volume Share (%), by Application 2024 & 2032
- Figure 55: Asia Pacific Nonsurgical Medical Aesthetic Device Revenue (million), by Types 2024 & 2032
- Figure 56: Asia Pacific Nonsurgical Medical Aesthetic Device Volume (K), by Types 2024 & 2032
- Figure 57: Asia Pacific Nonsurgical Medical Aesthetic Device Revenue Share (%), by Types 2024 & 2032
- Figure 58: Asia Pacific Nonsurgical Medical Aesthetic Device Volume Share (%), by Types 2024 & 2032
- Figure 59: Asia Pacific Nonsurgical Medical Aesthetic Device Revenue (million), by Country 2024 & 2032
- Figure 60: Asia Pacific Nonsurgical Medical Aesthetic Device Volume (K), by Country 2024 & 2032
- Figure 61: Asia Pacific Nonsurgical Medical Aesthetic Device Revenue Share (%), by Country 2024 & 2032
- Figure 62: Asia Pacific Nonsurgical Medical Aesthetic Device Volume Share (%), by Country 2024 & 2032
List of Tables
- Table 1: Global Nonsurgical Medical Aesthetic Device Revenue million Forecast, by Region 2019 & 2032
- Table 2: Global Nonsurgical Medical Aesthetic Device Volume K Forecast, by Region 2019 & 2032
- Table 3: Global Nonsurgical Medical Aesthetic Device Revenue million Forecast, by Application 2019 & 2032
- Table 4: Global Nonsurgical Medical Aesthetic Device Volume K Forecast, by Application 2019 & 2032
- Table 5: Global Nonsurgical Medical Aesthetic Device Revenue million Forecast, by Types 2019 & 2032
- Table 6: Global Nonsurgical Medical Aesthetic Device Volume K Forecast, by Types 2019 & 2032
- Table 7: Global Nonsurgical Medical Aesthetic Device Revenue million Forecast, by Region 2019 & 2032
- Table 8: Global Nonsurgical Medical Aesthetic Device Volume K Forecast, by Region 2019 & 2032
- Table 9: Global Nonsurgical Medical Aesthetic Device Revenue million Forecast, by Application 2019 & 2032
- Table 10: Global Nonsurgical Medical Aesthetic Device Volume K Forecast, by Application 2019 & 2032
- Table 11: Global Nonsurgical Medical Aesthetic Device Revenue million Forecast, by Types 2019 & 2032
- Table 12: Global Nonsurgical Medical Aesthetic Device Volume K Forecast, by Types 2019 & 2032
- Table 13: Global Nonsurgical Medical Aesthetic Device Revenue million Forecast, by Country 2019 & 2032
- Table 14: Global Nonsurgical Medical Aesthetic Device Volume K Forecast, by Country 2019 & 2032
- Table 15: United States Nonsurgical Medical Aesthetic Device Revenue (million) Forecast, by Application 2019 & 2032
- Table 16: United States Nonsurgical Medical Aesthetic Device Volume (K) Forecast, by Application 2019 & 2032
- Table 17: Canada Nonsurgical Medical Aesthetic Device Revenue (million) Forecast, by Application 2019 & 2032
- Table 18: Canada Nonsurgical Medical Aesthetic Device Volume (K) Forecast, by Application 2019 & 2032
- Table 19: Mexico Nonsurgical Medical Aesthetic Device Revenue (million) Forecast, by Application 2019 & 2032
- Table 20: Mexico Nonsurgical Medical Aesthetic Device Volume (K) Forecast, by Application 2019 & 2032
- Table 21: Global Nonsurgical Medical Aesthetic Device Revenue million Forecast, by Application 2019 & 2032
- Table 22: Global Nonsurgical Medical Aesthetic Device Volume K Forecast, by Application 2019 & 2032
- Table 23: Global Nonsurgical Medical Aesthetic Device Revenue million Forecast, by Types 2019 & 2032
- Table 24: Global Nonsurgical Medical Aesthetic Device Volume K Forecast, by Types 2019 & 2032
- Table 25: Global Nonsurgical Medical Aesthetic Device Revenue million Forecast, by Country 2019 & 2032
- Table 26: Global Nonsurgical Medical Aesthetic Device Volume K Forecast, by Country 2019 & 2032
- Table 27: Brazil Nonsurgical Medical Aesthetic Device Revenue (million) Forecast, by Application 2019 & 2032
- Table 28: Brazil Nonsurgical Medical Aesthetic Device Volume (K) Forecast, by Application 2019 & 2032
- Table 29: Argentina Nonsurgical Medical Aesthetic Device Revenue (million) Forecast, by Application 2019 & 2032
- Table 30: Argentina Nonsurgical Medical Aesthetic Device Volume (K) Forecast, by Application 2019 & 2032
- Table 31: Rest of South America Nonsurgical Medical Aesthetic Device Revenue (million) Forecast, by Application 2019 & 2032
- Table 32: Rest of South America Nonsurgical Medical Aesthetic Device Volume (K) Forecast, by Application 2019 & 2032
- Table 33: Global Nonsurgical Medical Aesthetic Device Revenue million Forecast, by Application 2019 & 2032
- Table 34: Global Nonsurgical Medical Aesthetic Device Volume K Forecast, by Application 2019 & 2032
- Table 35: Global Nonsurgical Medical Aesthetic Device Revenue million Forecast, by Types 2019 & 2032
- Table 36: Global Nonsurgical Medical Aesthetic Device Volume K Forecast, by Types 2019 & 2032
- Table 37: Global Nonsurgical Medical Aesthetic Device Revenue million Forecast, by Country 2019 & 2032
- Table 38: Global Nonsurgical Medical Aesthetic Device Volume K Forecast, by Country 2019 & 2032
- Table 39: United Kingdom Nonsurgical Medical Aesthetic Device Revenue (million) Forecast, by Application 2019 & 2032
- Table 40: United Kingdom Nonsurgical Medical Aesthetic Device Volume (K) Forecast, by Application 2019 & 2032
- Table 41: Germany Nonsurgical Medical Aesthetic Device Revenue (million) Forecast, by Application 2019 & 2032
- Table 42: Germany Nonsurgical Medical Aesthetic Device Volume (K) Forecast, by Application 2019 & 2032
- Table 43: France Nonsurgical Medical Aesthetic Device Revenue (million) Forecast, by Application 2019 & 2032
- Table 44: France Nonsurgical Medical Aesthetic Device Volume (K) Forecast, by Application 2019 & 2032
- Table 45: Italy Nonsurgical Medical Aesthetic Device Revenue (million) Forecast, by Application 2019 & 2032
- Table 46: Italy Nonsurgical Medical Aesthetic Device Volume (K) Forecast, by Application 2019 & 2032
- Table 47: Spain Nonsurgical Medical Aesthetic Device Revenue (million) Forecast, by Application 2019 & 2032
- Table 48: Spain Nonsurgical Medical Aesthetic Device Volume (K) Forecast, by Application 2019 & 2032
- Table 49: Russia Nonsurgical Medical Aesthetic Device Revenue (million) Forecast, by Application 2019 & 2032
- Table 50: Russia Nonsurgical Medical Aesthetic Device Volume (K) Forecast, by Application 2019 & 2032
- Table 51: Benelux Nonsurgical Medical Aesthetic Device Revenue (million) Forecast, by Application 2019 & 2032
- Table 52: Benelux Nonsurgical Medical Aesthetic Device Volume (K) Forecast, by Application 2019 & 2032
- Table 53: Nordics Nonsurgical Medical Aesthetic Device Revenue (million) Forecast, by Application 2019 & 2032
- Table 54: Nordics Nonsurgical Medical Aesthetic Device Volume (K) Forecast, by Application 2019 & 2032
- Table 55: Rest of Europe Nonsurgical Medical Aesthetic Device Revenue (million) Forecast, by Application 2019 & 2032
- Table 56: Rest of Europe Nonsurgical Medical Aesthetic Device Volume (K) Forecast, by Application 2019 & 2032
- Table 57: Global Nonsurgical Medical Aesthetic Device Revenue million Forecast, by Application 2019 & 2032
- Table 58: Global Nonsurgical Medical Aesthetic Device Volume K Forecast, by Application 2019 & 2032
- Table 59: Global Nonsurgical Medical Aesthetic Device Revenue million Forecast, by Types 2019 & 2032
- Table 60: Global Nonsurgical Medical Aesthetic Device Volume K Forecast, by Types 2019 & 2032
- Table 61: Global Nonsurgical Medical Aesthetic Device Revenue million Forecast, by Country 2019 & 2032
- Table 62: Global Nonsurgical Medical Aesthetic Device Volume K Forecast, by Country 2019 & 2032
- Table 63: Turkey Nonsurgical Medical Aesthetic Device Revenue (million) Forecast, by Application 2019 & 2032
- Table 64: Turkey Nonsurgical Medical Aesthetic Device Volume (K) Forecast, by Application 2019 & 2032
- Table 65: Israel Nonsurgical Medical Aesthetic Device Revenue (million) Forecast, by Application 2019 & 2032
- Table 66: Israel Nonsurgical Medical Aesthetic Device Volume (K) Forecast, by Application 2019 & 2032
- Table 67: GCC Nonsurgical Medical Aesthetic Device Revenue (million) Forecast, by Application 2019 & 2032
- Table 68: GCC Nonsurgical Medical Aesthetic Device Volume (K) Forecast, by Application 2019 & 2032
- Table 69: North Africa Nonsurgical Medical Aesthetic Device Revenue (million) Forecast, by Application 2019 & 2032
- Table 70: North Africa Nonsurgical Medical Aesthetic Device Volume (K) Forecast, by Application 2019 & 2032
- Table 71: South Africa Nonsurgical Medical Aesthetic Device Revenue (million) Forecast, by Application 2019 & 2032
- Table 72: South Africa Nonsurgical Medical Aesthetic Device Volume (K) Forecast, by Application 2019 & 2032
- Table 73: Rest of Middle East & Africa Nonsurgical Medical Aesthetic Device Revenue (million) Forecast, by Application 2019 & 2032
- Table 74: Rest of Middle East & Africa Nonsurgical Medical Aesthetic Device Volume (K) Forecast, by Application 2019 & 2032
- Table 75: Global Nonsurgical Medical Aesthetic Device Revenue million Forecast, by Application 2019 & 2032
- Table 76: Global Nonsurgical Medical Aesthetic Device Volume K Forecast, by Application 2019 & 2032
- Table 77: Global Nonsurgical Medical Aesthetic Device Revenue million Forecast, by Types 2019 & 2032
- Table 78: Global Nonsurgical Medical Aesthetic Device Volume K Forecast, by Types 2019 & 2032
- Table 79: Global Nonsurgical Medical Aesthetic Device Revenue million Forecast, by Country 2019 & 2032
- Table 80: Global Nonsurgical Medical Aesthetic Device Volume K Forecast, by Country 2019 & 2032
- Table 81: China Nonsurgical Medical Aesthetic Device Revenue (million) Forecast, by Application 2019 & 2032
- Table 82: China Nonsurgical Medical Aesthetic Device Volume (K) Forecast, by Application 2019 & 2032
- Table 83: India Nonsurgical Medical Aesthetic Device Revenue (million) Forecast, by Application 2019 & 2032
- Table 84: India Nonsurgical Medical Aesthetic Device Volume (K) Forecast, by Application 2019 & 2032
- Table 85: Japan Nonsurgical Medical Aesthetic Device Revenue (million) Forecast, by Application 2019 & 2032
- Table 86: Japan Nonsurgical Medical Aesthetic Device Volume (K) Forecast, by Application 2019 & 2032
- Table 87: South Korea Nonsurgical Medical Aesthetic Device Revenue (million) Forecast, by Application 2019 & 2032
- Table 88: South Korea Nonsurgical Medical Aesthetic Device Volume (K) Forecast, by Application 2019 & 2032
- Table 89: ASEAN Nonsurgical Medical Aesthetic Device Revenue (million) Forecast, by Application 2019 & 2032
- Table 90: ASEAN Nonsurgical Medical Aesthetic Device Volume (K) Forecast, by Application 2019 & 2032
- Table 91: Oceania Nonsurgical Medical Aesthetic Device Revenue (million) Forecast, by Application 2019 & 2032
- Table 92: Oceania Nonsurgical Medical Aesthetic Device Volume (K) Forecast, by Application 2019 & 2032
- Table 93: Rest of Asia Pacific Nonsurgical Medical Aesthetic Device Revenue (million) Forecast, by Application 2019 & 2032
- Table 94: Rest of Asia Pacific Nonsurgical Medical Aesthetic Device Volume (K) Forecast, by Application 2019 & 2032
Frequently Asked Questions
1. What is the projected Compound Annual Growth Rate (CAGR) of the Nonsurgical Medical Aesthetic Device?
The projected CAGR is approximately XX%.
2. Which companies are prominent players in the Nonsurgical Medical Aesthetic Device?
Key companies in the market include Venus Concept, Fotona, 3D Aesthetics, Bausch & Lomb, Alma Lasers, BTL, Rohrer, Solta Medical, Lynton, Cutera, Lumenis, Candela, Fraxel laser, Clinipro, Ultherapy, STRATA Skin Sciences, Sciton, El.En. S.p.A., INMODE.
3. What are the main segments of the Nonsurgical Medical Aesthetic Device?
The market segments include Application, Types.
4. Can you provide details about the market size?
The market size is estimated to be USD XXX million as of 2022.
5. What are some drivers contributing to market growth?
N/A
6. What are the notable trends driving market growth?
N/A
7. Are there any restraints impacting market growth?
N/A
8. Can you provide examples of recent developments in the market?
N/A
9. What pricing options are available for accessing the report?
Pricing options include single-user, multi-user, and enterprise licenses priced at USD 3950.00, USD 5925.00, and USD 7900.00 respectively.
10. Is the market size provided in terms of value or volume?
The market size is provided in terms of value, measured in million and volume, measured in K.
11. Are there any specific market keywords associated with the report?
Yes, the market keyword associated with the report is "Nonsurgical Medical Aesthetic Device," which aids in identifying and referencing the specific market segment covered.
12. How do I determine which pricing option suits my needs best?
The pricing options vary based on user requirements and access needs. Individual users may opt for single-user licenses, while businesses requiring broader access may choose multi-user or enterprise licenses for cost-effective access to the report.
13. Are there any additional resources or data provided in the Nonsurgical Medical Aesthetic Device report?
While the report offers comprehensive insights, it's advisable to review the specific contents or supplementary materials provided to ascertain if additional resources or data are available.
14. How can I stay updated on further developments or reports in the Nonsurgical Medical Aesthetic Device?
To stay informed about further developments, trends, and reports in the Nonsurgical Medical Aesthetic Device, consider subscribing to industry newsletters, following relevant companies and organizations, or regularly checking reputable industry news sources and publications.
Methodology
Step 1 - Identification of Relevant Samples Size from Population Database


Step 2 - Approaches for Defining Global Market Size (Value, Volume* & Price*)

Note*: In applicable scenarios
Step 3 - Data Sources
Primary Research
- Web Analytics
- Survey Reports
- Research Institute
- Latest Research Reports
- Opinion Leaders
Secondary Research
- Annual Reports
- White Paper
- Latest Press Release
- Industry Association
- Paid Database
- Investor Presentations

Step 4 - Data Triangulation
Involves using different sources of information in order to increase the validity of a study
These sources are likely to be stakeholders in a program - participants, other researchers, program staff, other community members, and so on.
Then we put all data in single framework & apply various statistical tools to find out the dynamic on the market.
During the analysis stage, feedback from the stakeholder groups would be compared to determine areas of agreement as well as areas of divergence


