
Key Insights
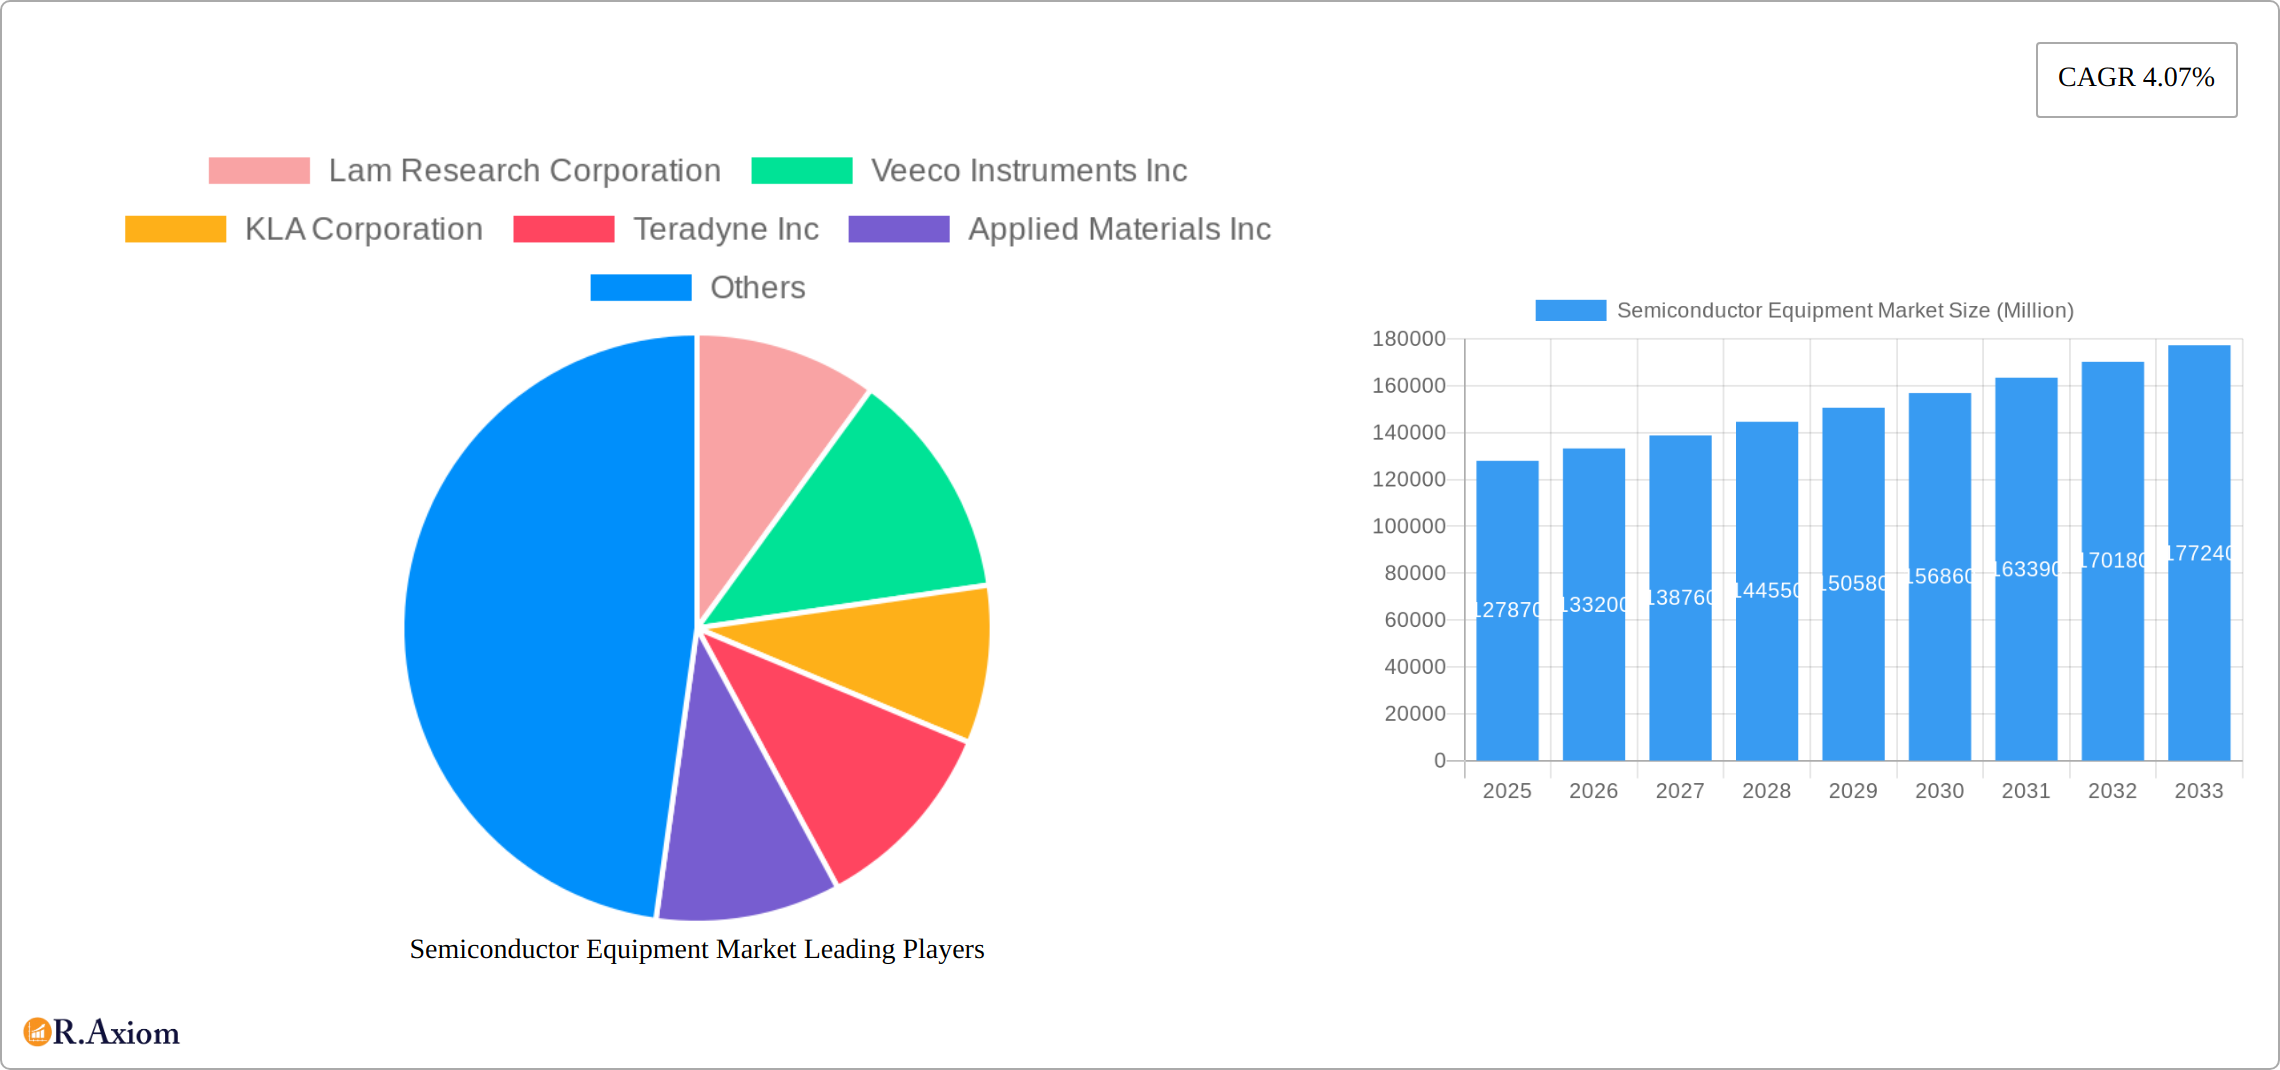
The global semiconductor equipment market, valued at $127.87 billion in 2025, is projected to experience robust growth, driven by a compound annual growth rate (CAGR) of 4.07% from 2025 to 2033. This expansion is fueled by several key factors. The increasing demand for advanced semiconductor devices in diverse applications such as smartphones, artificial intelligence, high-performance computing, and automotive electronics is a major catalyst. Furthermore, the ongoing shift towards miniaturization and increased processing power necessitates continuous investment in cutting-edge equipment. Technological advancements in areas like EUV lithography and advanced packaging solutions are also contributing to market growth. Significant investments in research and development by key players further bolster the market's positive trajectory. Competition among leading manufacturers like Lam Research, Applied Materials, and ASML is fostering innovation and driving down costs, making semiconductor equipment more accessible to a wider range of manufacturers.
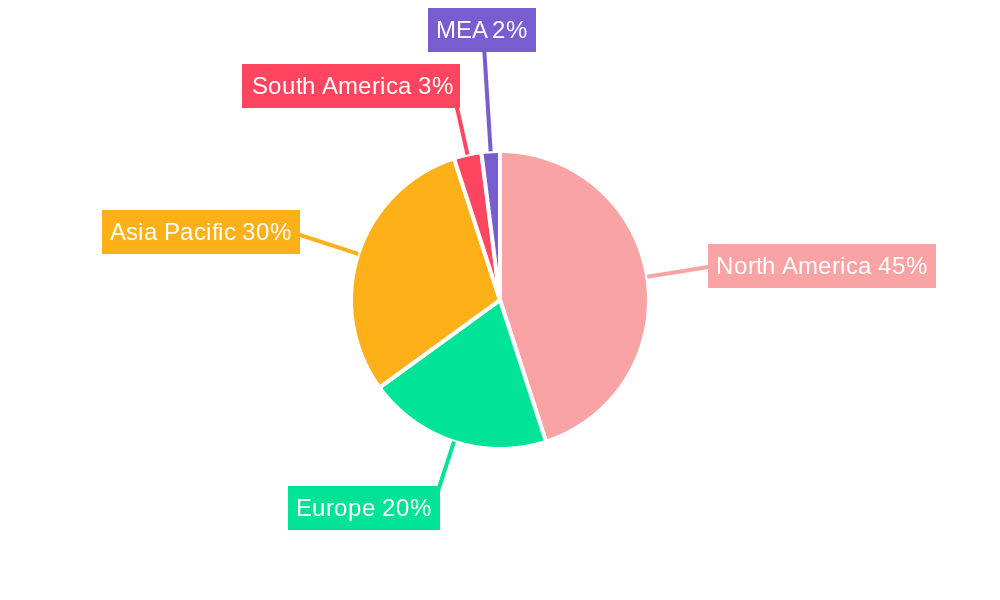
However, market growth is not without its challenges. Supply chain disruptions, particularly the availability of crucial raw materials and skilled labor, pose significant restraints. Geopolitical uncertainties and trade tensions can also impact market dynamics. Furthermore, the high capital expenditure required for purchasing and maintaining sophisticated semiconductor equipment presents a barrier to entry for smaller players. Despite these challenges, the long-term outlook for the semiconductor equipment market remains positive, driven by the unwavering demand for advanced electronics and ongoing technological innovation. The market segmentation reveals strong growth across all equipment types (front-end and back-end) and supply chain participants (IDMs, OSATs, and foundries), indicating a robust and diverse market landscape. Regional analysis suggests North America and Asia Pacific will continue to dominate the market, driven by substantial manufacturing hubs and technological advancements within these regions.
Semiconductor Equipment Market: A Comprehensive Analysis (2019-2033)
This in-depth report provides a comprehensive analysis of the Semiconductor Equipment Market, covering historical data (2019-2024), the base year (2025), and a detailed forecast (2025-2033). It offers invaluable insights for industry stakeholders, investors, and strategic decision-makers seeking to navigate the complexities of this dynamic market. The report leverages rigorous research methodologies and incorporates real-world data to provide actionable intelligence. The total market size is projected to reach xx Million by 2033.
Semiconductor Equipment Market Concentration & Innovation
The Semiconductor Equipment market exhibits a moderately concentrated structure, with a few dominant players capturing a significant market share. Lam Research Corporation, Applied Materials Inc, ASML Holding Semiconductor Company, Tokyo Electron Limited, and KLA Corporation are key players, collectively holding an estimated xx% market share in 2024. This concentration is driven by significant investments in R&D, economies of scale, and strong intellectual property portfolios. However, the market also displays a considerable degree of innovation, with smaller companies specializing in niche technologies and new entrants constantly emerging.
Market innovation is spurred by the relentless demand for higher performance, smaller feature sizes, and increased efficiency in semiconductor devices. This fuels advancements in lithography, etching, deposition, and testing equipment. Stringent regulatory frameworks, focusing on environmental sustainability and worker safety, influence innovation as manufacturers adapt to comply with evolving standards. The increasing use of artificial intelligence (AI) and machine learning (ML) in equipment design and operation is another noteworthy trend. Product substitutes are limited due to the specialized nature of the equipment, although the emergence of advanced materials and processes occasionally creates alternative solutions. End-user trends, particularly the growing demand for high-performance computing (HPC) and advanced mobile devices, strongly influence the direction of innovation.
M&A activity plays a crucial role in shaping market dynamics. Recent years have witnessed several significant mergers and acquisitions, valued at xx Million in total (2019-2024), primarily focused on consolidating market share, acquiring specialized technologies, and expanding geographical reach. These deals have increased market concentration and enhanced the capabilities of major players.
Semiconductor Equipment Market Industry Trends & Insights
The Semiconductor Equipment market is experiencing robust growth, fueled by the escalating demand for semiconductors across diverse sectors. These include consumer electronics, the burgeoning automotive industry, expansive data centers, and the increasingly automated industrial landscape. Market analysts project a Compound Annual Growth Rate (CAGR) of [Insert Updated CAGR Percentage]% during the forecast period (2025-2033), reflecting significant expansion. This growth is significantly catalyzed by technological advancements, such as the migration to advanced semiconductor manufacturing nodes (e.g., EUV lithography), demanding substantial investments in cutting-edge equipment. The continuous miniaturization and performance enhancements of consumer electronics, driven by demand for smaller, faster, and more energy-efficient devices, further fuels this growth.
The competitive landscape is characterized by intense rivalry among leading players, each vying for technological leadership, economies of scale, and strategic partnerships. This competitive pressure fosters continuous innovation, leading to the development of more sophisticated and cost-effective equipment, ultimately benefiting end-users. The market penetration of advanced technologies, notably EUV lithography, is steadily increasing, signaling a clear shift toward more complex and precise manufacturing processes. This dynamic interplay of technological innovation and market competition underscores the sector's robust and evolving nature. Increased automation and the integration of AI and ML are further streamlining operations and driving efficiency gains.
Dominant Markets & Segments in Semiconductor Equipment Market
Leading Region: Asia-Pacific, particularly Taiwan, South Korea, and China, dominates the Semiconductor Equipment market due to the significant concentration of semiconductor manufacturing facilities in these regions. This dominance is driven by substantial government investments in semiconductor manufacturing infrastructure, a large pool of skilled labor, and proactive economic policies supporting the industry's growth.
Leading Country: Taiwan's robust semiconductor industry and government support make it the leading country in this market.
Leading Segment (By Equipment Type): Front-end equipment holds the largest market share, driven by the increasing demand for advanced semiconductor nodes and associated processing technologies.
Leading Segment (By Supply Chain Participants): Foundries represent the dominant segment due to the growing outsourcing of semiconductor manufacturing and the expansion of leading foundries.
Key Drivers for Dominant Segments:
- Economic policies: Government incentives and subsidies aimed at fostering semiconductor manufacturing.
- Infrastructure: Availability of advanced infrastructure, including power grids, clean water, and skilled workforce.
- Technological advancements: Adoption of advanced technologies, such as EUV lithography and advanced packaging solutions.
- Market demand: Increasing global demand for semiconductor devices across various applications.
Semiconductor Equipment Market Product Developments
Recent years have witnessed significant product innovations in semiconductor equipment, characterized by higher throughput, improved precision, and enhanced process control. These advancements focus on enabling the manufacturing of smaller, more energy-efficient, and faster semiconductor devices. New equipment designs incorporate AI and ML for process optimization and yield improvement. The market has seen a significant rise in the adoption of EUV lithography, enabling the production of advanced chips with smaller features. These products offer significant competitive advantages through enhanced productivity, cost reduction, and superior device performance, thereby aligning with market needs for advanced semiconductor technologies.
Report Scope & Segmentation Analysis
This report segments the Semiconductor Equipment market based on Equipment Type (Front-end Equipment, Back-end Equipment) and Supply Chain Participants (IDM, OSAT, Foundry).
By Equipment Type: The Front-end equipment segment is projected to witness faster growth due to the increased demand for advanced process technologies, while the back-end segment displays a steady growth trajectory.
By Supply Chain Participants: The Foundry segment is expected to exhibit the highest growth rate due to the increasing outsourcing trend in semiconductor manufacturing. Each segment has its unique competitive dynamics shaped by technological advancements and industry trends. The report offers detailed growth projections and market sizes for each segment, enabling detailed competitive analysis.
Key Drivers of Semiconductor Equipment Market Growth
The Semiconductor Equipment market is propelled by several key drivers: Technological advancements in semiconductor manufacturing, such as EUV lithography and advanced packaging, are primary drivers. The increasing demand for high-performance computing (HPC), artificial intelligence (AI), and 5G technologies fuels the growth. Furthermore, supportive government policies and investments in semiconductor manufacturing, particularly in Asia-Pacific regions, significantly influence market expansion. The proliferation of Internet of Things (IoT) devices and the rise of electric vehicles (EVs) also contribute to robust market growth.
Challenges in the Semiconductor Equipment Market Sector
Despite its strong growth trajectory, the semiconductor equipment market faces significant hurdles. Geopolitical instability and international trade tensions frequently disrupt supply chains, leading to substantial financial losses – estimated at [Insert Updated Loss Figure] in 2024. The substantial capital investment required for advanced equipment creates a high barrier to entry for smaller companies, intensifying competition from established industry giants. The constant need for innovation to maintain a competitive edge adds to the pressure. Furthermore, stringent environmental regulations and worker safety standards add complexity to operations, demanding continuous adaptation and investment in compliance.
Emerging Opportunities in Semiconductor Equipment Market
Several promising opportunities are emerging within the semiconductor equipment market. Advanced packaging technologies, enabling greater device density and improved performance, represent a key area of growth. The surging demand for specialized semiconductors in the automotive and industrial sectors presents substantial potential. The development of sustainable and energy-efficient manufacturing processes is gaining traction, offering lucrative opportunities for equipment manufacturers seeking to capitalize on the increasing focus on environmental responsibility. Furthermore, the integration of artificial intelligence (AI) and machine learning (ML) into semiconductor manufacturing operations is optimizing production processes and improving yields. The exploration and adoption of novel materials also offer a strong avenue for future expansion.
Leading Players in the Semiconductor Equipment Market Market
- Lam Research Corporation
- Veeco Instruments Inc
- KLA Corporation
- Teradyne Inc
- Applied Materials Inc
- Screen Holdings Co Ltd
- Hitachi High-Technologies Corporation
- Tokyo Electron Limited
- ASML Holding Semiconductor Company
Key Developments in Semiconductor Equipment Market Industry
June 2022: RIBER secured an order for a multi-4' GSMBE 49 production system, underscoring the strong demand for advanced MBE equipment in datacom applications. This order reinforces Riber's leading position in the high-precision epitaxial growth market.
June 2022: Veeco's Propel system was chosen by the Taiwan Semiconductor Research Institute, highlighting the growing adoption of advanced MOCVD systems for both R&D and high-volume manufacturing. This selection underscores Veeco's technological leadership in this sector.
[Add more recent key developments with dates and concise descriptions. Include company names and specifics for impact.]
Strategic Outlook for Semiconductor Equipment Market Market
The Semiconductor Equipment market is poised for sustained growth, driven by the continuous expansion of the semiconductor industry and the increasing demand for advanced devices. Future market potential is substantial, with opportunities in emerging technologies such as quantum computing and neuromorphic computing. Companies focused on innovation, strategic partnerships, and agile adaptation to market dynamics are best positioned to capitalize on this growth. The market's trajectory will be significantly influenced by advancements in materials science, process technology, and artificial intelligence.
Semiconductor Equipment Market Segmentation
-
1. Equipment Type
-
1.1. Front-end Equipment
- 1.1.1. Lithography Equipment
- 1.1.2. Etch Equipment
- 1.1.3. Deposition Equipment
- 1.1.4. Metrology/Inspection Equipment
- 1.1.5. Material Removal/Cleaning Equipment
- 1.1.6. Photoresist Processing Equipment
- 1.1.7. Other Equipment Types
-
1.2. Back-end Equipment
- 1.2.1. Test Equipment
- 1.2.2. Assembly and Packaging Equipment
-
1.1. Front-end Equipment
-
2. End-User Industry
- 2.1. consumer electronics
- 2.2. automotive
- 2.3. other industries
- 2.4. industrial
Semiconductor Equipment Market Segmentation By Geography
- 1. North America: United States Canada Mexico
- 2. Europe: Germany: France: Italy: United Kingdom Netherlands Rest of Europe
- 3. Europe: Germany: France: Italy: United Kingdom Netherlands Rest of Europe Asia Pacific: China, Japan, India, South Korea, Taiwan, Australia, Rest of Asia-Pacific
- 4. South America : Brazil, Argentina, Rest of South America
- 5. MEA: Middle East, Africa
Semiconductor Equipment Market REPORT HIGHLIGHTS
| Aspects | Details |
|---|---|
| Study Period | 2019-2033 |
| Base Year | 2024 |
| Estimated Year | 2025 |
| Forecast Period | 2025-2033 |
| Historical Period | 2019-2024 |
| Growth Rate | CAGR of 4.07% from 2019-2033 |
| Segmentation |
|
Table of Contents
- 1. Introduction
- 1.1. Research Scope
- 1.2. Market Segmentation
- 1.3. Research Methodology
- 1.4. Definitions and Assumptions
- 2. Executive Summary
- 2.1. Introduction
- 3. Market Dynamics
- 3.1. Introduction
- 3.2. Market Drivers
- 3.2.1 Increasing Demand for Consumer Electronic Devices; Proliferation of AI
- 3.2.2 IoT
- 3.2.3 And Connected Devices Across Industry Verticals
- 3.3. Market Restrains
- 3.3.1. Dynamic Nature of Technologies Requires Several Changes in Manufacturing Equipment
- 3.4. Market Trends
- 3.4.1. Increasing Demand for Consumer Electronic Devices
- 4. Market Factor Analysis
- 4.1. Porters Five Forces
- 4.2. Supply/Value Chain
- 4.3. PESTEL analysis
- 4.4. Market Entropy
- 4.5. Patent/Trademark Analysis
- 5. Global Semiconductor Equipment Market Analysis, Insights and Forecast, 2019-2031
- 5.1. Market Analysis, Insights and Forecast - by Equipment Type
- 5.1.1. Front-end Equipment
- 5.1.1.1. Lithography Equipment
- 5.1.1.2. Etch Equipment
- 5.1.1.3. Deposition Equipment
- 5.1.1.4. Metrology/Inspection Equipment
- 5.1.1.5. Material Removal/Cleaning Equipment
- 5.1.1.6. Photoresist Processing Equipment
- 5.1.1.7. Other Equipment Types
- 5.1.2. Back-end Equipment
- 5.1.2.1. Test Equipment
- 5.1.2.2. Assembly and Packaging Equipment
- 5.1.1. Front-end Equipment
- 5.2. Market Analysis, Insights and Forecast - by End-User Industry
- 5.2.1. consumer electronics
- 5.2.2. automotive
- 5.2.3. other industries
- 5.2.4. industrial
- 5.3. Market Analysis, Insights and Forecast - by Region
- 5.3.1. North America: United States Canada Mexico
- 5.3.2. Europe: Germany: France: Italy: United Kingdom Netherlands Rest of Europe
- 5.3.3. Europe: Germany: France: Italy: United Kingdom Netherlands Rest of Europe Asia Pacific: China, Japan, India, South Korea, Taiwan, Australia, Rest of Asia-Pacific
- 5.3.4. South America : Brazil, Argentina, Rest of South America
- 5.3.5. MEA: Middle East, Africa
- 5.1. Market Analysis, Insights and Forecast - by Equipment Type
- 6. North America: United States Canada Mexico Semiconductor Equipment Market Analysis, Insights and Forecast, 2019-2031
- 6.1. Market Analysis, Insights and Forecast - by Equipment Type
- 6.1.1. Front-end Equipment
- 6.1.1.1. Lithography Equipment
- 6.1.1.2. Etch Equipment
- 6.1.1.3. Deposition Equipment
- 6.1.1.4. Metrology/Inspection Equipment
- 6.1.1.5. Material Removal/Cleaning Equipment
- 6.1.1.6. Photoresist Processing Equipment
- 6.1.1.7. Other Equipment Types
- 6.1.2. Back-end Equipment
- 6.1.2.1. Test Equipment
- 6.1.2.2. Assembly and Packaging Equipment
- 6.1.1. Front-end Equipment
- 6.2. Market Analysis, Insights and Forecast - by End-User Industry
- 6.2.1. consumer electronics
- 6.2.2. automotive
- 6.2.3. other industries
- 6.2.4. industrial
- 6.1. Market Analysis, Insights and Forecast - by Equipment Type
- 7. Europe: Germany: France: Italy: United Kingdom Netherlands Rest of Europe Semiconductor Equipment Market Analysis, Insights and Forecast, 2019-2031
- 7.1. Market Analysis, Insights and Forecast - by Equipment Type
- 7.1.1. Front-end Equipment
- 7.1.1.1. Lithography Equipment
- 7.1.1.2. Etch Equipment
- 7.1.1.3. Deposition Equipment
- 7.1.1.4. Metrology/Inspection Equipment
- 7.1.1.5. Material Removal/Cleaning Equipment
- 7.1.1.6. Photoresist Processing Equipment
- 7.1.1.7. Other Equipment Types
- 7.1.2. Back-end Equipment
- 7.1.2.1. Test Equipment
- 7.1.2.2. Assembly and Packaging Equipment
- 7.1.1. Front-end Equipment
- 7.2. Market Analysis, Insights and Forecast - by End-User Industry
- 7.2.1. consumer electronics
- 7.2.2. automotive
- 7.2.3. other industries
- 7.2.4. industrial
- 7.1. Market Analysis, Insights and Forecast - by Equipment Type
- 8. Europe: Germany: France: Italy: United Kingdom Netherlands Rest of Europe Asia Pacific: China, Japan, India, South Korea, Taiwan, Australia, Rest of Asia-Pacific Semiconductor Equipment Market Analysis, Insights and Forecast, 2019-2031
- 8.1. Market Analysis, Insights and Forecast - by Equipment Type
- 8.1.1. Front-end Equipment
- 8.1.1.1. Lithography Equipment
- 8.1.1.2. Etch Equipment
- 8.1.1.3. Deposition Equipment
- 8.1.1.4. Metrology/Inspection Equipment
- 8.1.1.5. Material Removal/Cleaning Equipment
- 8.1.1.6. Photoresist Processing Equipment
- 8.1.1.7. Other Equipment Types
- 8.1.2. Back-end Equipment
- 8.1.2.1. Test Equipment
- 8.1.2.2. Assembly and Packaging Equipment
- 8.1.1. Front-end Equipment
- 8.2. Market Analysis, Insights and Forecast - by End-User Industry
- 8.2.1. consumer electronics
- 8.2.2. automotive
- 8.2.3. other industries
- 8.2.4. industrial
- 8.1. Market Analysis, Insights and Forecast - by Equipment Type
- 9. South America : Brazil, Argentina, Rest of South America Semiconductor Equipment Market Analysis, Insights and Forecast, 2019-2031
- 9.1. Market Analysis, Insights and Forecast - by Equipment Type
- 9.1.1. Front-end Equipment
- 9.1.1.1. Lithography Equipment
- 9.1.1.2. Etch Equipment
- 9.1.1.3. Deposition Equipment
- 9.1.1.4. Metrology/Inspection Equipment
- 9.1.1.5. Material Removal/Cleaning Equipment
- 9.1.1.6. Photoresist Processing Equipment
- 9.1.1.7. Other Equipment Types
- 9.1.2. Back-end Equipment
- 9.1.2.1. Test Equipment
- 9.1.2.2. Assembly and Packaging Equipment
- 9.1.1. Front-end Equipment
- 9.2. Market Analysis, Insights and Forecast - by End-User Industry
- 9.2.1. consumer electronics
- 9.2.2. automotive
- 9.2.3. other industries
- 9.2.4. industrial
- 9.1. Market Analysis, Insights and Forecast - by Equipment Type
- 10. MEA: Middle East, Africa Semiconductor Equipment Market Analysis, Insights and Forecast, 2019-2031
- 10.1. Market Analysis, Insights and Forecast - by Equipment Type
- 10.1.1. Front-end Equipment
- 10.1.1.1. Lithography Equipment
- 10.1.1.2. Etch Equipment
- 10.1.1.3. Deposition Equipment
- 10.1.1.4. Metrology/Inspection Equipment
- 10.1.1.5. Material Removal/Cleaning Equipment
- 10.1.1.6. Photoresist Processing Equipment
- 10.1.1.7. Other Equipment Types
- 10.1.2. Back-end Equipment
- 10.1.2.1. Test Equipment
- 10.1.2.2. Assembly and Packaging Equipment
- 10.1.1. Front-end Equipment
- 10.2. Market Analysis, Insights and Forecast - by End-User Industry
- 10.2.1. consumer electronics
- 10.2.2. automotive
- 10.2.3. other industries
- 10.2.4. industrial
- 10.1. Market Analysis, Insights and Forecast - by Equipment Type
- 11. North America Semiconductor Equipment Market Analysis, Insights and Forecast, 2019-2031
- 11.1. Market Analysis, Insights and Forecast - By Country/Sub-region
- 11.1.1 United States
- 11.1.2 Canada
- 11.1.3 Mexico
- 12. Europe Semiconductor Equipment Market Analysis, Insights and Forecast, 2019-2031
- 12.1. Market Analysis, Insights and Forecast - By Country/Sub-region
- 12.1.1 Germany
- 12.1.2 United Kingdom
- 12.1.3 France
- 12.1.4 Spain
- 12.1.5 Italy
- 12.1.6 Spain
- 12.1.7 Belgium
- 12.1.8 Netherland
- 12.1.9 Nordics
- 12.1.10 Rest of Europe
- 13. Asia Pacific Semiconductor Equipment Market Analysis, Insights and Forecast, 2019-2031
- 13.1. Market Analysis, Insights and Forecast - By Country/Sub-region
- 13.1.1 China
- 13.1.2 Japan
- 13.1.3 India
- 13.1.4 South Korea
- 13.1.5 Southeast Asia
- 13.1.6 Australia
- 13.1.7 Indonesia
- 13.1.8 Phillipes
- 13.1.9 Singapore
- 13.1.10 Thailandc
- 13.1.11 Rest of Asia Pacific
- 14. South America Semiconductor Equipment Market Analysis, Insights and Forecast, 2019-2031
- 14.1. Market Analysis, Insights and Forecast - By Country/Sub-region
- 14.1.1 Brazil
- 14.1.2 Argentina
- 14.1.3 Peru
- 14.1.4 Chile
- 14.1.5 Colombia
- 14.1.6 Ecuador
- 14.1.7 Venezuela
- 14.1.8 Rest of South America
- 15. North America Semiconductor Equipment Market Analysis, Insights and Forecast, 2019-2031
- 15.1. Market Analysis, Insights and Forecast - By Country/Sub-region
- 15.1.1 United States
- 15.1.2 Canada
- 15.1.3 Mexico
- 16. MEA Semiconductor Equipment Market Analysis, Insights and Forecast, 2019-2031
- 16.1. Market Analysis, Insights and Forecast - By Country/Sub-region
- 16.1.1 United Arab Emirates
- 16.1.2 Saudi Arabia
- 16.1.3 South Africa
- 16.1.4 Rest of Middle East and Africa
- 17. Competitive Analysis
- 17.1. Global Market Share Analysis 2024
- 17.2. Company Profiles
- 17.2.1 Lam Research Corporation
- 17.2.1.1. Overview
- 17.2.1.2. Products
- 17.2.1.3. SWOT Analysis
- 17.2.1.4. Recent Developments
- 17.2.1.5. Financials (Based on Availability)
- 17.2.2 Veeco Instruments Inc
- 17.2.2.1. Overview
- 17.2.2.2. Products
- 17.2.2.3. SWOT Analysis
- 17.2.2.4. Recent Developments
- 17.2.2.5. Financials (Based on Availability)
- 17.2.3 KLA Corporation
- 17.2.3.1. Overview
- 17.2.3.2. Products
- 17.2.3.3. SWOT Analysis
- 17.2.3.4. Recent Developments
- 17.2.3.5. Financials (Based on Availability)
- 17.2.4 Teradyne Inc
- 17.2.4.1. Overview
- 17.2.4.2. Products
- 17.2.4.3. SWOT Analysis
- 17.2.4.4. Recent Developments
- 17.2.4.5. Financials (Based on Availability)
- 17.2.5 Applied Materials Inc
- 17.2.5.1. Overview
- 17.2.5.2. Products
- 17.2.5.3. SWOT Analysis
- 17.2.5.4. Recent Developments
- 17.2.5.5. Financials (Based on Availability)
- 17.2.6 Screen Holdings Co Ltd
- 17.2.6.1. Overview
- 17.2.6.2. Products
- 17.2.6.3. SWOT Analysis
- 17.2.6.4. Recent Developments
- 17.2.6.5. Financials (Based on Availability)
- 17.2.7 Hitachi High -Technologies Corporation
- 17.2.7.1. Overview
- 17.2.7.2. Products
- 17.2.7.3. SWOT Analysis
- 17.2.7.4. Recent Developments
- 17.2.7.5. Financials (Based on Availability)
- 17.2.8 Tokyo Electron Limited
- 17.2.8.1. Overview
- 17.2.8.2. Products
- 17.2.8.3. SWOT Analysis
- 17.2.8.4. Recent Developments
- 17.2.8.5. Financials (Based on Availability)
- 17.2.9 ASML Holding Semiconductor Company
- 17.2.9.1. Overview
- 17.2.9.2. Products
- 17.2.9.3. SWOT Analysis
- 17.2.9.4. Recent Developments
- 17.2.9.5. Financials (Based on Availability)
- 17.2.1 Lam Research Corporation
List of Figures
- Figure 1: Global Semiconductor Equipment Market Revenue Breakdown (Million, %) by Region 2024 & 2032
- Figure 2: Global Semiconductor Equipment Market Volume Breakdown (K Unit, %) by Region 2024 & 2032
- Figure 3: North America Semiconductor Equipment Market Revenue (Million), by Country 2024 & 2032
- Figure 4: North America Semiconductor Equipment Market Volume (K Unit), by Country 2024 & 2032
- Figure 5: North America Semiconductor Equipment Market Revenue Share (%), by Country 2024 & 2032
- Figure 6: North America Semiconductor Equipment Market Volume Share (%), by Country 2024 & 2032
- Figure 7: Europe Semiconductor Equipment Market Revenue (Million), by Country 2024 & 2032
- Figure 8: Europe Semiconductor Equipment Market Volume (K Unit), by Country 2024 & 2032
- Figure 9: Europe Semiconductor Equipment Market Revenue Share (%), by Country 2024 & 2032
- Figure 10: Europe Semiconductor Equipment Market Volume Share (%), by Country 2024 & 2032
- Figure 11: Asia Pacific Semiconductor Equipment Market Revenue (Million), by Country 2024 & 2032
- Figure 12: Asia Pacific Semiconductor Equipment Market Volume (K Unit), by Country 2024 & 2032
- Figure 13: Asia Pacific Semiconductor Equipment Market Revenue Share (%), by Country 2024 & 2032
- Figure 14: Asia Pacific Semiconductor Equipment Market Volume Share (%), by Country 2024 & 2032
- Figure 15: South America Semiconductor Equipment Market Revenue (Million), by Country 2024 & 2032
- Figure 16: South America Semiconductor Equipment Market Volume (K Unit), by Country 2024 & 2032
- Figure 17: South America Semiconductor Equipment Market Revenue Share (%), by Country 2024 & 2032
- Figure 18: South America Semiconductor Equipment Market Volume Share (%), by Country 2024 & 2032
- Figure 19: North America Semiconductor Equipment Market Revenue (Million), by Country 2024 & 2032
- Figure 20: North America Semiconductor Equipment Market Volume (K Unit), by Country 2024 & 2032
- Figure 21: North America Semiconductor Equipment Market Revenue Share (%), by Country 2024 & 2032
- Figure 22: North America Semiconductor Equipment Market Volume Share (%), by Country 2024 & 2032
- Figure 23: MEA Semiconductor Equipment Market Revenue (Million), by Country 2024 & 2032
- Figure 24: MEA Semiconductor Equipment Market Volume (K Unit), by Country 2024 & 2032
- Figure 25: MEA Semiconductor Equipment Market Revenue Share (%), by Country 2024 & 2032
- Figure 26: MEA Semiconductor Equipment Market Volume Share (%), by Country 2024 & 2032
- Figure 27: North America: United States Canada Mexico Semiconductor Equipment Market Revenue (Million), by Equipment Type 2024 & 2032
- Figure 28: North America: United States Canada Mexico Semiconductor Equipment Market Volume (K Unit), by Equipment Type 2024 & 2032
- Figure 29: North America: United States Canada Mexico Semiconductor Equipment Market Revenue Share (%), by Equipment Type 2024 & 2032
- Figure 30: North America: United States Canada Mexico Semiconductor Equipment Market Volume Share (%), by Equipment Type 2024 & 2032
- Figure 31: North America: United States Canada Mexico Semiconductor Equipment Market Revenue (Million), by End-User Industry 2024 & 2032
- Figure 32: North America: United States Canada Mexico Semiconductor Equipment Market Volume (K Unit), by End-User Industry 2024 & 2032
- Figure 33: North America: United States Canada Mexico Semiconductor Equipment Market Revenue Share (%), by End-User Industry 2024 & 2032
- Figure 34: North America: United States Canada Mexico Semiconductor Equipment Market Volume Share (%), by End-User Industry 2024 & 2032
- Figure 35: North America: United States Canada Mexico Semiconductor Equipment Market Revenue (Million), by Country 2024 & 2032
- Figure 36: North America: United States Canada Mexico Semiconductor Equipment Market Volume (K Unit), by Country 2024 & 2032
- Figure 37: North America: United States Canada Mexico Semiconductor Equipment Market Revenue Share (%), by Country 2024 & 2032
- Figure 38: North America: United States Canada Mexico Semiconductor Equipment Market Volume Share (%), by Country 2024 & 2032
- Figure 39: Europe: Germany: France: Italy: United Kingdom Netherlands Rest of Europe Semiconductor Equipment Market Revenue (Million), by Equipment Type 2024 & 2032
- Figure 40: Europe: Germany: France: Italy: United Kingdom Netherlands Rest of Europe Semiconductor Equipment Market Volume (K Unit), by Equipment Type 2024 & 2032
- Figure 41: Europe: Germany: France: Italy: United Kingdom Netherlands Rest of Europe Semiconductor Equipment Market Revenue Share (%), by Equipment Type 2024 & 2032
- Figure 42: Europe: Germany: France: Italy: United Kingdom Netherlands Rest of Europe Semiconductor Equipment Market Volume Share (%), by Equipment Type 2024 & 2032
- Figure 43: Europe: Germany: France: Italy: United Kingdom Netherlands Rest of Europe Semiconductor Equipment Market Revenue (Million), by End-User Industry 2024 & 2032
- Figure 44: Europe: Germany: France: Italy: United Kingdom Netherlands Rest of Europe Semiconductor Equipment Market Volume (K Unit), by End-User Industry 2024 & 2032
- Figure 45: Europe: Germany: France: Italy: United Kingdom Netherlands Rest of Europe Semiconductor Equipment Market Revenue Share (%), by End-User Industry 2024 & 2032
- Figure 46: Europe: Germany: France: Italy: United Kingdom Netherlands Rest of Europe Semiconductor Equipment Market Volume Share (%), by End-User Industry 2024 & 2032
- Figure 47: Europe: Germany: France: Italy: United Kingdom Netherlands Rest of Europe Semiconductor Equipment Market Revenue (Million), by Country 2024 & 2032
- Figure 48: Europe: Germany: France: Italy: United Kingdom Netherlands Rest of Europe Semiconductor Equipment Market Volume (K Unit), by Country 2024 & 2032
- Figure 49: Europe: Germany: France: Italy: United Kingdom Netherlands Rest of Europe Semiconductor Equipment Market Revenue Share (%), by Country 2024 & 2032
- Figure 50: Europe: Germany: France: Italy: United Kingdom Netherlands Rest of Europe Semiconductor Equipment Market Volume Share (%), by Country 2024 & 2032
- Figure 51: Europe: Germany: France: Italy: United Kingdom Netherlands Rest of Europe Asia Pacific: China, Japan, India, South Korea, Taiwan, Australia, Rest of Asia-Pacific Semiconductor Equipment Market Revenue (Million), by Equipment Type 2024 & 2032
- Figure 52: Europe: Germany: France: Italy: United Kingdom Netherlands Rest of Europe Asia Pacific: China, Japan, India, South Korea, Taiwan, Australia, Rest of Asia-Pacific Semiconductor Equipment Market Volume (K Unit), by Equipment Type 2024 & 2032
- Figure 53: Europe: Germany: France: Italy: United Kingdom Netherlands Rest of Europe Asia Pacific: China, Japan, India, South Korea, Taiwan, Australia, Rest of Asia-Pacific Semiconductor Equipment Market Revenue Share (%), by Equipment Type 2024 & 2032
- Figure 54: Europe: Germany: France: Italy: United Kingdom Netherlands Rest of Europe Asia Pacific: China, Japan, India, South Korea, Taiwan, Australia, Rest of Asia-Pacific Semiconductor Equipment Market Volume Share (%), by Equipment Type 2024 & 2032
- Figure 55: Europe: Germany: France: Italy: United Kingdom Netherlands Rest of Europe Asia Pacific: China, Japan, India, South Korea, Taiwan, Australia, Rest of Asia-Pacific Semiconductor Equipment Market Revenue (Million), by End-User Industry 2024 & 2032
- Figure 56: Europe: Germany: France: Italy: United Kingdom Netherlands Rest of Europe Asia Pacific: China, Japan, India, South Korea, Taiwan, Australia, Rest of Asia-Pacific Semiconductor Equipment Market Volume (K Unit), by End-User Industry 2024 & 2032
- Figure 57: Europe: Germany: France: Italy: United Kingdom Netherlands Rest of Europe Asia Pacific: China, Japan, India, South Korea, Taiwan, Australia, Rest of Asia-Pacific Semiconductor Equipment Market Revenue Share (%), by End-User Industry 2024 & 2032
- Figure 58: Europe: Germany: France: Italy: United Kingdom Netherlands Rest of Europe Asia Pacific: China, Japan, India, South Korea, Taiwan, Australia, Rest of Asia-Pacific Semiconductor Equipment Market Volume Share (%), by End-User Industry 2024 & 2032
- Figure 59: Europe: Germany: France: Italy: United Kingdom Netherlands Rest of Europe Asia Pacific: China, Japan, India, South Korea, Taiwan, Australia, Rest of Asia-Pacific Semiconductor Equipment Market Revenue (Million), by Country 2024 & 2032
- Figure 60: Europe: Germany: France: Italy: United Kingdom Netherlands Rest of Europe Asia Pacific: China, Japan, India, South Korea, Taiwan, Australia, Rest of Asia-Pacific Semiconductor Equipment Market Volume (K Unit), by Country 2024 & 2032
- Figure 61: Europe: Germany: France: Italy: United Kingdom Netherlands Rest of Europe Asia Pacific: China, Japan, India, South Korea, Taiwan, Australia, Rest of Asia-Pacific Semiconductor Equipment Market Revenue Share (%), by Country 2024 & 2032
- Figure 62: Europe: Germany: France: Italy: United Kingdom Netherlands Rest of Europe Asia Pacific: China, Japan, India, South Korea, Taiwan, Australia, Rest of Asia-Pacific Semiconductor Equipment Market Volume Share (%), by Country 2024 & 2032
- Figure 63: South America : Brazil, Argentina, Rest of South America Semiconductor Equipment Market Revenue (Million), by Equipment Type 2024 & 2032
- Figure 64: South America : Brazil, Argentina, Rest of South America Semiconductor Equipment Market Volume (K Unit), by Equipment Type 2024 & 2032
- Figure 65: South America : Brazil, Argentina, Rest of South America Semiconductor Equipment Market Revenue Share (%), by Equipment Type 2024 & 2032
- Figure 66: South America : Brazil, Argentina, Rest of South America Semiconductor Equipment Market Volume Share (%), by Equipment Type 2024 & 2032
- Figure 67: South America : Brazil, Argentina, Rest of South America Semiconductor Equipment Market Revenue (Million), by End-User Industry 2024 & 2032
- Figure 68: South America : Brazil, Argentina, Rest of South America Semiconductor Equipment Market Volume (K Unit), by End-User Industry 2024 & 2032
- Figure 69: South America : Brazil, Argentina, Rest of South America Semiconductor Equipment Market Revenue Share (%), by End-User Industry 2024 & 2032
- Figure 70: South America : Brazil, Argentina, Rest of South America Semiconductor Equipment Market Volume Share (%), by End-User Industry 2024 & 2032
- Figure 71: South America : Brazil, Argentina, Rest of South America Semiconductor Equipment Market Revenue (Million), by Country 2024 & 2032
- Figure 72: South America : Brazil, Argentina, Rest of South America Semiconductor Equipment Market Volume (K Unit), by Country 2024 & 2032
- Figure 73: South America : Brazil, Argentina, Rest of South America Semiconductor Equipment Market Revenue Share (%), by Country 2024 & 2032
- Figure 74: South America : Brazil, Argentina, Rest of South America Semiconductor Equipment Market Volume Share (%), by Country 2024 & 2032
- Figure 75: MEA: Middle East, Africa Semiconductor Equipment Market Revenue (Million), by Equipment Type 2024 & 2032
- Figure 76: MEA: Middle East, Africa Semiconductor Equipment Market Volume (K Unit), by Equipment Type 2024 & 2032
- Figure 77: MEA: Middle East, Africa Semiconductor Equipment Market Revenue Share (%), by Equipment Type 2024 & 2032
- Figure 78: MEA: Middle East, Africa Semiconductor Equipment Market Volume Share (%), by Equipment Type 2024 & 2032
- Figure 79: MEA: Middle East, Africa Semiconductor Equipment Market Revenue (Million), by End-User Industry 2024 & 2032
- Figure 80: MEA: Middle East, Africa Semiconductor Equipment Market Volume (K Unit), by End-User Industry 2024 & 2032
- Figure 81: MEA: Middle East, Africa Semiconductor Equipment Market Revenue Share (%), by End-User Industry 2024 & 2032
- Figure 82: MEA: Middle East, Africa Semiconductor Equipment Market Volume Share (%), by End-User Industry 2024 & 2032
- Figure 83: MEA: Middle East, Africa Semiconductor Equipment Market Revenue (Million), by Country 2024 & 2032
- Figure 84: MEA: Middle East, Africa Semiconductor Equipment Market Volume (K Unit), by Country 2024 & 2032
- Figure 85: MEA: Middle East, Africa Semiconductor Equipment Market Revenue Share (%), by Country 2024 & 2032
- Figure 86: MEA: Middle East, Africa Semiconductor Equipment Market Volume Share (%), by Country 2024 & 2032
List of Tables
- Table 1: Global Semiconductor Equipment Market Revenue Million Forecast, by Region 2019 & 2032
- Table 2: Global Semiconductor Equipment Market Volume K Unit Forecast, by Region 2019 & 2032
- Table 3: Global Semiconductor Equipment Market Revenue Million Forecast, by Equipment Type 2019 & 2032
- Table 4: Global Semiconductor Equipment Market Volume K Unit Forecast, by Equipment Type 2019 & 2032
- Table 5: Global Semiconductor Equipment Market Revenue Million Forecast, by End-User Industry 2019 & 2032
- Table 6: Global Semiconductor Equipment Market Volume K Unit Forecast, by End-User Industry 2019 & 2032
- Table 7: Global Semiconductor Equipment Market Revenue Million Forecast, by Region 2019 & 2032
- Table 8: Global Semiconductor Equipment Market Volume K Unit Forecast, by Region 2019 & 2032
- Table 9: Global Semiconductor Equipment Market Revenue Million Forecast, by Country 2019 & 2032
- Table 10: Global Semiconductor Equipment Market Volume K Unit Forecast, by Country 2019 & 2032
- Table 11: United States Semiconductor Equipment Market Revenue (Million) Forecast, by Application 2019 & 2032
- Table 12: United States Semiconductor Equipment Market Volume (K Unit) Forecast, by Application 2019 & 2032
- Table 13: Canada Semiconductor Equipment Market Revenue (Million) Forecast, by Application 2019 & 2032
- Table 14: Canada Semiconductor Equipment Market Volume (K Unit) Forecast, by Application 2019 & 2032
- Table 15: Mexico Semiconductor Equipment Market Revenue (Million) Forecast, by Application 2019 & 2032
- Table 16: Mexico Semiconductor Equipment Market Volume (K Unit) Forecast, by Application 2019 & 2032
- Table 17: Global Semiconductor Equipment Market Revenue Million Forecast, by Country 2019 & 2032
- Table 18: Global Semiconductor Equipment Market Volume K Unit Forecast, by Country 2019 & 2032
- Table 19: Germany Semiconductor Equipment Market Revenue (Million) Forecast, by Application 2019 & 2032
- Table 20: Germany Semiconductor Equipment Market Volume (K Unit) Forecast, by Application 2019 & 2032
- Table 21: United Kingdom Semiconductor Equipment Market Revenue (Million) Forecast, by Application 2019 & 2032
- Table 22: United Kingdom Semiconductor Equipment Market Volume (K Unit) Forecast, by Application 2019 & 2032
- Table 23: France Semiconductor Equipment Market Revenue (Million) Forecast, by Application 2019 & 2032
- Table 24: France Semiconductor Equipment Market Volume (K Unit) Forecast, by Application 2019 & 2032
- Table 25: Spain Semiconductor Equipment Market Revenue (Million) Forecast, by Application 2019 & 2032
- Table 26: Spain Semiconductor Equipment Market Volume (K Unit) Forecast, by Application 2019 & 2032
- Table 27: Italy Semiconductor Equipment Market Revenue (Million) Forecast, by Application 2019 & 2032
- Table 28: Italy Semiconductor Equipment Market Volume (K Unit) Forecast, by Application 2019 & 2032
- Table 29: Spain Semiconductor Equipment Market Revenue (Million) Forecast, by Application 2019 & 2032
- Table 30: Spain Semiconductor Equipment Market Volume (K Unit) Forecast, by Application 2019 & 2032
- Table 31: Belgium Semiconductor Equipment Market Revenue (Million) Forecast, by Application 2019 & 2032
- Table 32: Belgium Semiconductor Equipment Market Volume (K Unit) Forecast, by Application 2019 & 2032
- Table 33: Netherland Semiconductor Equipment Market Revenue (Million) Forecast, by Application 2019 & 2032
- Table 34: Netherland Semiconductor Equipment Market Volume (K Unit) Forecast, by Application 2019 & 2032
- Table 35: Nordics Semiconductor Equipment Market Revenue (Million) Forecast, by Application 2019 & 2032
- Table 36: Nordics Semiconductor Equipment Market Volume (K Unit) Forecast, by Application 2019 & 2032
- Table 37: Rest of Europe Semiconductor Equipment Market Revenue (Million) Forecast, by Application 2019 & 2032
- Table 38: Rest of Europe Semiconductor Equipment Market Volume (K Unit) Forecast, by Application 2019 & 2032
- Table 39: Global Semiconductor Equipment Market Revenue Million Forecast, by Country 2019 & 2032
- Table 40: Global Semiconductor Equipment Market Volume K Unit Forecast, by Country 2019 & 2032
- Table 41: China Semiconductor Equipment Market Revenue (Million) Forecast, by Application 2019 & 2032
- Table 42: China Semiconductor Equipment Market Volume (K Unit) Forecast, by Application 2019 & 2032
- Table 43: Japan Semiconductor Equipment Market Revenue (Million) Forecast, by Application 2019 & 2032
- Table 44: Japan Semiconductor Equipment Market Volume (K Unit) Forecast, by Application 2019 & 2032
- Table 45: India Semiconductor Equipment Market Revenue (Million) Forecast, by Application 2019 & 2032
- Table 46: India Semiconductor Equipment Market Volume (K Unit) Forecast, by Application 2019 & 2032
- Table 47: South Korea Semiconductor Equipment Market Revenue (Million) Forecast, by Application 2019 & 2032
- Table 48: South Korea Semiconductor Equipment Market Volume (K Unit) Forecast, by Application 2019 & 2032
- Table 49: Southeast Asia Semiconductor Equipment Market Revenue (Million) Forecast, by Application 2019 & 2032
- Table 50: Southeast Asia Semiconductor Equipment Market Volume (K Unit) Forecast, by Application 2019 & 2032
- Table 51: Australia Semiconductor Equipment Market Revenue (Million) Forecast, by Application 2019 & 2032
- Table 52: Australia Semiconductor Equipment Market Volume (K Unit) Forecast, by Application 2019 & 2032
- Table 53: Indonesia Semiconductor Equipment Market Revenue (Million) Forecast, by Application 2019 & 2032
- Table 54: Indonesia Semiconductor Equipment Market Volume (K Unit) Forecast, by Application 2019 & 2032
- Table 55: Phillipes Semiconductor Equipment Market Revenue (Million) Forecast, by Application 2019 & 2032
- Table 56: Phillipes Semiconductor Equipment Market Volume (K Unit) Forecast, by Application 2019 & 2032
- Table 57: Singapore Semiconductor Equipment Market Revenue (Million) Forecast, by Application 2019 & 2032
- Table 58: Singapore Semiconductor Equipment Market Volume (K Unit) Forecast, by Application 2019 & 2032
- Table 59: Thailandc Semiconductor Equipment Market Revenue (Million) Forecast, by Application 2019 & 2032
- Table 60: Thailandc Semiconductor Equipment Market Volume (K Unit) Forecast, by Application 2019 & 2032
- Table 61: Rest of Asia Pacific Semiconductor Equipment Market Revenue (Million) Forecast, by Application 2019 & 2032
- Table 62: Rest of Asia Pacific Semiconductor Equipment Market Volume (K Unit) Forecast, by Application 2019 & 2032
- Table 63: Global Semiconductor Equipment Market Revenue Million Forecast, by Country 2019 & 2032
- Table 64: Global Semiconductor Equipment Market Volume K Unit Forecast, by Country 2019 & 2032
- Table 65: Brazil Semiconductor Equipment Market Revenue (Million) Forecast, by Application 2019 & 2032
- Table 66: Brazil Semiconductor Equipment Market Volume (K Unit) Forecast, by Application 2019 & 2032
- Table 67: Argentina Semiconductor Equipment Market Revenue (Million) Forecast, by Application 2019 & 2032
- Table 68: Argentina Semiconductor Equipment Market Volume (K Unit) Forecast, by Application 2019 & 2032
- Table 69: Peru Semiconductor Equipment Market Revenue (Million) Forecast, by Application 2019 & 2032
- Table 70: Peru Semiconductor Equipment Market Volume (K Unit) Forecast, by Application 2019 & 2032
- Table 71: Chile Semiconductor Equipment Market Revenue (Million) Forecast, by Application 2019 & 2032
- Table 72: Chile Semiconductor Equipment Market Volume (K Unit) Forecast, by Application 2019 & 2032
- Table 73: Colombia Semiconductor Equipment Market Revenue (Million) Forecast, by Application 2019 & 2032
- Table 74: Colombia Semiconductor Equipment Market Volume (K Unit) Forecast, by Application 2019 & 2032
- Table 75: Ecuador Semiconductor Equipment Market Revenue (Million) Forecast, by Application 2019 & 2032
- Table 76: Ecuador Semiconductor Equipment Market Volume (K Unit) Forecast, by Application 2019 & 2032
- Table 77: Venezuela Semiconductor Equipment Market Revenue (Million) Forecast, by Application 2019 & 2032
- Table 78: Venezuela Semiconductor Equipment Market Volume (K Unit) Forecast, by Application 2019 & 2032
- Table 79: Rest of South America Semiconductor Equipment Market Revenue (Million) Forecast, by Application 2019 & 2032
- Table 80: Rest of South America Semiconductor Equipment Market Volume (K Unit) Forecast, by Application 2019 & 2032
- Table 81: Global Semiconductor Equipment Market Revenue Million Forecast, by Country 2019 & 2032
- Table 82: Global Semiconductor Equipment Market Volume K Unit Forecast, by Country 2019 & 2032
- Table 83: United States Semiconductor Equipment Market Revenue (Million) Forecast, by Application 2019 & 2032
- Table 84: United States Semiconductor Equipment Market Volume (K Unit) Forecast, by Application 2019 & 2032
- Table 85: Canada Semiconductor Equipment Market Revenue (Million) Forecast, by Application 2019 & 2032
- Table 86: Canada Semiconductor Equipment Market Volume (K Unit) Forecast, by Application 2019 & 2032
- Table 87: Mexico Semiconductor Equipment Market Revenue (Million) Forecast, by Application 2019 & 2032
- Table 88: Mexico Semiconductor Equipment Market Volume (K Unit) Forecast, by Application 2019 & 2032
- Table 89: Global Semiconductor Equipment Market Revenue Million Forecast, by Country 2019 & 2032
- Table 90: Global Semiconductor Equipment Market Volume K Unit Forecast, by Country 2019 & 2032
- Table 91: United Arab Emirates Semiconductor Equipment Market Revenue (Million) Forecast, by Application 2019 & 2032
- Table 92: United Arab Emirates Semiconductor Equipment Market Volume (K Unit) Forecast, by Application 2019 & 2032
- Table 93: Saudi Arabia Semiconductor Equipment Market Revenue (Million) Forecast, by Application 2019 & 2032
- Table 94: Saudi Arabia Semiconductor Equipment Market Volume (K Unit) Forecast, by Application 2019 & 2032
- Table 95: South Africa Semiconductor Equipment Market Revenue (Million) Forecast, by Application 2019 & 2032
- Table 96: South Africa Semiconductor Equipment Market Volume (K Unit) Forecast, by Application 2019 & 2032
- Table 97: Rest of Middle East and Africa Semiconductor Equipment Market Revenue (Million) Forecast, by Application 2019 & 2032
- Table 98: Rest of Middle East and Africa Semiconductor Equipment Market Volume (K Unit) Forecast, by Application 2019 & 2032
- Table 99: Global Semiconductor Equipment Market Revenue Million Forecast, by Equipment Type 2019 & 2032
- Table 100: Global Semiconductor Equipment Market Volume K Unit Forecast, by Equipment Type 2019 & 2032
- Table 101: Global Semiconductor Equipment Market Revenue Million Forecast, by End-User Industry 2019 & 2032
- Table 102: Global Semiconductor Equipment Market Volume K Unit Forecast, by End-User Industry 2019 & 2032
- Table 103: Global Semiconductor Equipment Market Revenue Million Forecast, by Country 2019 & 2032
- Table 104: Global Semiconductor Equipment Market Volume K Unit Forecast, by Country 2019 & 2032
- Table 105: Global Semiconductor Equipment Market Revenue Million Forecast, by Equipment Type 2019 & 2032
- Table 106: Global Semiconductor Equipment Market Volume K Unit Forecast, by Equipment Type 2019 & 2032
- Table 107: Global Semiconductor Equipment Market Revenue Million Forecast, by End-User Industry 2019 & 2032
- Table 108: Global Semiconductor Equipment Market Volume K Unit Forecast, by End-User Industry 2019 & 2032
- Table 109: Global Semiconductor Equipment Market Revenue Million Forecast, by Country 2019 & 2032
- Table 110: Global Semiconductor Equipment Market Volume K Unit Forecast, by Country 2019 & 2032
- Table 111: Global Semiconductor Equipment Market Revenue Million Forecast, by Equipment Type 2019 & 2032
- Table 112: Global Semiconductor Equipment Market Volume K Unit Forecast, by Equipment Type 2019 & 2032
- Table 113: Global Semiconductor Equipment Market Revenue Million Forecast, by End-User Industry 2019 & 2032
- Table 114: Global Semiconductor Equipment Market Volume K Unit Forecast, by End-User Industry 2019 & 2032
- Table 115: Global Semiconductor Equipment Market Revenue Million Forecast, by Country 2019 & 2032
- Table 116: Global Semiconductor Equipment Market Volume K Unit Forecast, by Country 2019 & 2032
- Table 117: Global Semiconductor Equipment Market Revenue Million Forecast, by Equipment Type 2019 & 2032
- Table 118: Global Semiconductor Equipment Market Volume K Unit Forecast, by Equipment Type 2019 & 2032
- Table 119: Global Semiconductor Equipment Market Revenue Million Forecast, by End-User Industry 2019 & 2032
- Table 120: Global Semiconductor Equipment Market Volume K Unit Forecast, by End-User Industry 2019 & 2032
- Table 121: Global Semiconductor Equipment Market Revenue Million Forecast, by Country 2019 & 2032
- Table 122: Global Semiconductor Equipment Market Volume K Unit Forecast, by Country 2019 & 2032
- Table 123: Global Semiconductor Equipment Market Revenue Million Forecast, by Equipment Type 2019 & 2032
- Table 124: Global Semiconductor Equipment Market Volume K Unit Forecast, by Equipment Type 2019 & 2032
- Table 125: Global Semiconductor Equipment Market Revenue Million Forecast, by End-User Industry 2019 & 2032
- Table 126: Global Semiconductor Equipment Market Volume K Unit Forecast, by End-User Industry 2019 & 2032
- Table 127: Global Semiconductor Equipment Market Revenue Million Forecast, by Country 2019 & 2032
- Table 128: Global Semiconductor Equipment Market Volume K Unit Forecast, by Country 2019 & 2032
Frequently Asked Questions
1. What is the projected Compound Annual Growth Rate (CAGR) of the Semiconductor Equipment Market?
The projected CAGR is approximately 4.07%.
2. Which companies are prominent players in the Semiconductor Equipment Market?
Key companies in the market include Lam Research Corporation, Veeco Instruments Inc, KLA Corporation, Teradyne Inc, Applied Materials Inc, Screen Holdings Co Ltd, Hitachi High -Technologies Corporation, Tokyo Electron Limited, ASML Holding Semiconductor Company.
3. What are the main segments of the Semiconductor Equipment Market?
The market segments include Equipment Type, End-User Industry .
4. Can you provide details about the market size?
The market size is estimated to be USD 127.87 Million as of 2022.
5. What are some drivers contributing to market growth?
Increasing Demand for Consumer Electronic Devices; Proliferation of AI. IoT. And Connected Devices Across Industry Verticals.
6. What are the notable trends driving market growth?
Increasing Demand for Consumer Electronic Devices.
7. Are there any restraints impacting market growth?
Dynamic Nature of Technologies Requires Several Changes in Manufacturing Equipment.
8. Can you provide examples of recent developments in the market?
June 2022: RIBER, a global market player for molecular beam epitaxy (MBE) equipment serving the semiconductor industry, announced an order for a multi-4' GSMBE 49 production system. The new generation of datacom devices requires highly precise control of the epitaxial growth process, which is achieved by the recognized performance of Riber's machines and by the sophistication of the machine's control software. The ordered machine is expected to be delivered in 2023.
9. What pricing options are available for accessing the report?
Pricing options include single-user, multi-user, and enterprise licenses priced at USD 4750, USD 5250, and USD 8750 respectively.
10. Is the market size provided in terms of value or volume?
The market size is provided in terms of value, measured in Million and volume, measured in K Unit.
11. Are there any specific market keywords associated with the report?
Yes, the market keyword associated with the report is "Semiconductor Equipment Market," which aids in identifying and referencing the specific market segment covered.
12. How do I determine which pricing option suits my needs best?
The pricing options vary based on user requirements and access needs. Individual users may opt for single-user licenses, while businesses requiring broader access may choose multi-user or enterprise licenses for cost-effective access to the report.
13. Are there any additional resources or data provided in the Semiconductor Equipment Market report?
While the report offers comprehensive insights, it's advisable to review the specific contents or supplementary materials provided to ascertain if additional resources or data are available.
14. How can I stay updated on further developments or reports in the Semiconductor Equipment Market?
To stay informed about further developments, trends, and reports in the Semiconductor Equipment Market, consider subscribing to industry newsletters, following relevant companies and organizations, or regularly checking reputable industry news sources and publications.
Methodology
Step 1 - Identification of Relevant Samples Size from Population Database


Step 2 - Approaches for Defining Global Market Size (Value, Volume* & Price*)

Note*: In applicable scenarios
Step 3 - Data Sources
Primary Research
- Web Analytics
- Survey Reports
- Research Institute
- Latest Research Reports
- Opinion Leaders
Secondary Research
- Annual Reports
- White Paper
- Latest Press Release
- Industry Association
- Paid Database
- Investor Presentations

Step 4 - Data Triangulation
Involves using different sources of information in order to increase the validity of a study
These sources are likely to be stakeholders in a program - participants, other researchers, program staff, other community members, and so on.
Then we put all data in single framework & apply various statistical tools to find out the dynamic on the market.
During the analysis stage, feedback from the stakeholder groups would be compared to determine areas of agreement as well as areas of divergence


