Key Insights
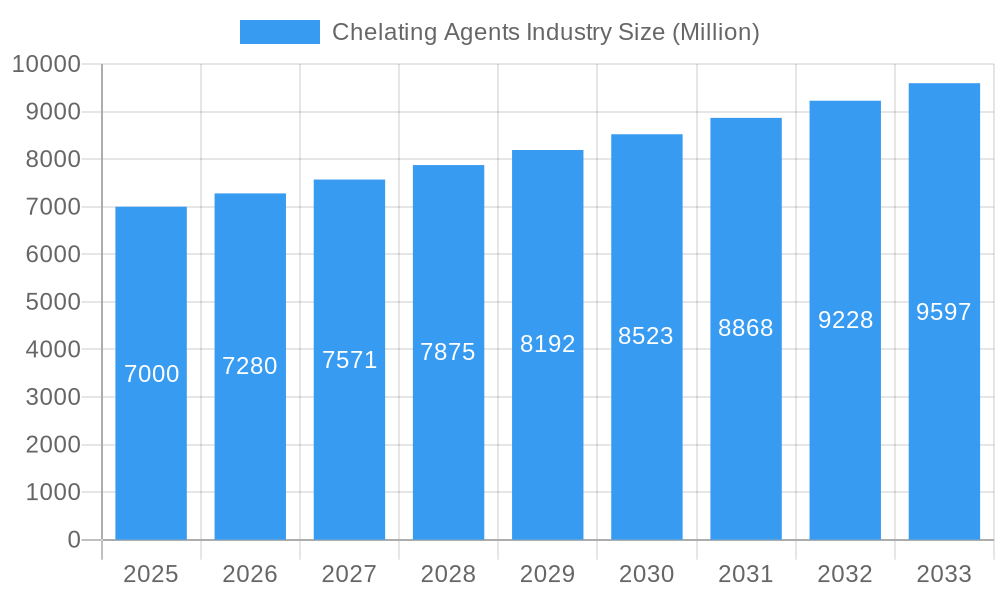
The global Chelating Agents market is poised for substantial growth, projected to reach an estimated market size of approximately $7,000 million by 2025, with a robust Compound Annual Growth Rate (CAGR) exceeding 4.00% through 2033. This expansion is fueled by escalating demand across a multitude of industries, including water treatment, detergents, agrochemicals, and pharmaceuticals. The increasing stringency of environmental regulations, particularly concerning water quality and industrial effluent management, is a significant driver, promoting the adoption of chelating agents for their ability to sequester metal ions. Furthermore, the burgeoning food and beverage and personal care sectors, driven by consumer preference for enhanced product stability and shelf-life, are also contributing to market dynamism. The growing awareness of the benefits of efficient nutrient delivery in agriculture further bolsters demand from the agrochemical segment.
Chelating Agents Industry Market Size (In Billion)
The market landscape is characterized by a dual segmentation of both biodegradable and non-biodegradable chelating agents, with a discernible shift towards more environmentally friendly alternatives. While non-biodegradable agents like EDTA continue to hold a significant market share due to their cost-effectiveness and efficacy, the development and adoption of biodegradable options such as EDDS and GLDA are gaining traction, driven by sustainability initiatives and corporate social responsibility. Key players like BASF SE, Dow, ADM, and Nouryon are actively investing in research and development to innovate and expand their product portfolios, focusing on both performance enhancement and eco-friendly solutions. Geographically, the Asia Pacific region is expected to lead market growth, propelled by rapid industrialization, urbanization, and a growing population in countries like China and India, creating substantial demand for chelating agents in various applications.
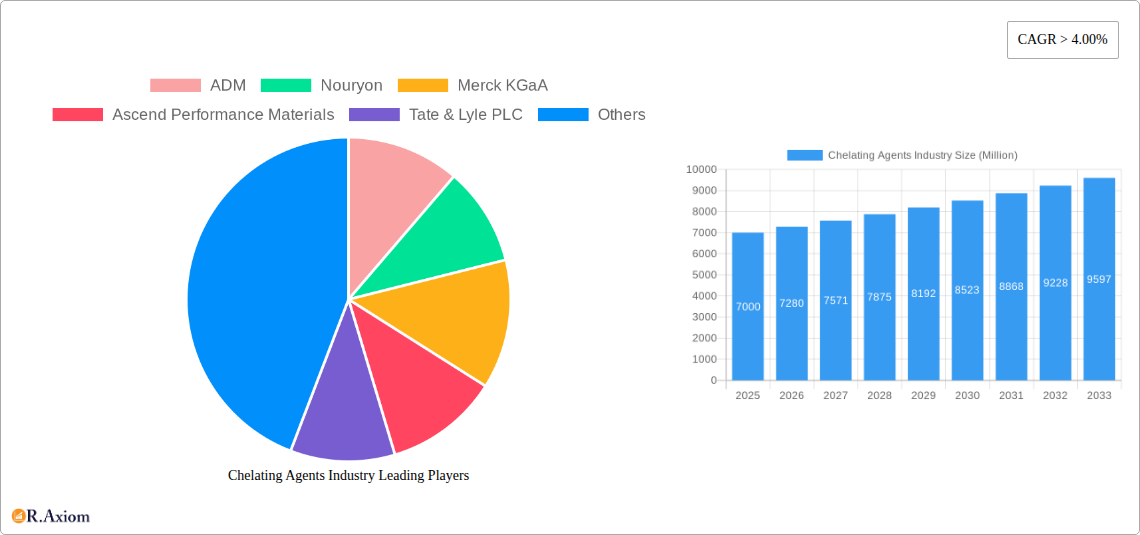
Chelating Agents Industry Company Market Share
This detailed report offers an in-depth analysis of the global Chelating Agents Market, exploring its dynamics, growth drivers, challenges, and future potential. Covering the period from 2019 to 2033, with a base year of 2025 and a forecast period of 2025–2033, this report provides actionable insights for industry stakeholders, including manufacturers, suppliers, investors, and end-users. We delve into market concentration, innovation, regulatory landscapes, emerging technologies, and evolving consumer preferences to equip you with the knowledge needed to navigate this vital sector.
Chelating Agents Industry Market Concentration & Innovation
The Chelating Agents Market exhibits a moderate level of concentration, characterized by the presence of both large, established chemical giants and agile, specialized players. Key companies like BASF SE, Dow, and Kemira command significant market share, driven by their extensive product portfolios, robust R&D capabilities, and global distribution networks. Innovation is a critical differentiator, fueled by the increasing demand for sustainable and biodegradable chelating agents. Companies are investing heavily in developing greener alternatives to traditional chelants, responding to stringent environmental regulations and growing consumer consciousness. Regulatory frameworks, particularly concerning environmental impact and product safety, play a pivotal role in shaping market dynamics. Product substitutes, such as ion-exchange resins and reverse osmosis, are present but often face limitations in specific applications or cost-effectiveness compared to chelating agents. End-user trends are gravitating towards high-performance, environmentally friendly solutions, particularly in sectors like water treatment, personal care, and food & beverages. Mergers and acquisitions (M&A) activities are also shaping the market landscape, with strategic acquisitions aimed at expanding product offerings, gaining market access, and enhancing technological capabilities. For instance, the acquisition of ADOB by Nouryon in January 2023 highlights the strategic importance of expanding into specialized agricultural solutions. M&A deal values in the past year are estimated to be in the range of several hundred million dollars, reflecting the strategic investments being made in this sector.
Chelating Agents Industry Industry Trends & Insights
The global Chelating Agents Market is poised for robust growth, projected to experience a Compound Annual Growth Rate (CAGR) of approximately 5.5% over the forecast period of 2025–2033. This expansion is primarily driven by the escalating demand across diverse end-use industries and the continuous push for sustainable chemical solutions. The increasing focus on water scarcity and the need for efficient water treatment processes are significant market growth drivers. Chelating agents play a crucial role in sequestering metal ions, thereby preventing scaling, corrosion, and improving the overall efficiency of industrial water systems. The pulp and paper industry also contributes to market growth, utilizing chelating agents to improve bleaching processes and enhance paper quality. Furthermore, the agrochemical sector's demand for chelated micronutrients, which improve nutrient availability to plants, is a substantial contributor. The personal care and cosmetics industry is witnessing a growing preference for chelating agents that improve product stability and efficacy while adhering to ‘green’ formulations. Technological disruptions, such as advancements in the synthesis of biodegradable chelates and the development of novel applications for existing chelating agents, are reshaping the competitive landscape. Consumer preferences are increasingly leaning towards eco-friendly products, driving innovation in biodegradable chelating agents. Companies like Nouryon, with its commissioned biodegradable chelates production facility in the Netherlands in February 2022, are strategically positioning themselves to capitalize on this trend. Competitive dynamics are characterized by intense R&D efforts, strategic partnerships, and a focus on cost-effectiveness and product performance. Market penetration of biodegradable chelating agents is on an upward trajectory, expected to reach approximately 30% by 2033. The overall market size is estimated to reach close to twenty billion dollars by 2033, indicating substantial growth potential.
Dominant Markets & Segments in Chelating Agents Industry
The Chelating Agents Market is segmented by Type and Application, with distinct regional dominance.
By Type:
- Non-biodegradable Chelating Agents: While historically dominant, this segment is experiencing a gradual shift towards biodegradable alternatives due to environmental concerns. However, their cost-effectiveness and proven efficacy in certain demanding industrial applications continue to ensure their market presence, particularly in regions with less stringent environmental regulations. Economic policies promoting industrial growth and infrastructure development in emerging economies often favor the adoption of these established solutions.
- Biodegradable Chelating Agents: This segment is witnessing the most significant growth, driven by regulatory mandates and consumer preference for sustainable products. Technological advancements in producing bio-based chelates are making them increasingly competitive. Market penetration in developed economies in North America and Europe is notably high, with further expansion anticipated due to their eco-friendly profile.
By Application:
- Cleaners: A major consumer of chelating agents, these are used in household and industrial cleaning products to enhance detergency and prevent scale formation. Economic stability and disposable income in developed and developing nations directly influence demand in this segment.
- Pulp and Paper: Chelating agents are vital for optimizing bleaching processes and improving paper quality. The demand is closely tied to global paper consumption trends and the growth of packaging industries.
- Water Treatment: This is a rapidly growing application, with chelating agents essential for industrial and municipal water treatment to remove metal ions, prevent scaling, and control corrosion. Government initiatives focused on water conservation and pollution control significantly boost demand.
- Agrochemicals: The use of chelating agents in fertilizers to improve micronutrient bioavailability to crops is a key growth area, particularly in regions with intensive agriculture and concerns about soil nutrient depletion. Agricultural policies promoting sustainable farming practices are a key driver.
- Chemical: Chelating agents serve as process aids and reactants in various chemical manufacturing processes, contributing to overall industrial output.
- Food and Beverages: Used as preservatives and to prevent metallic discoloration, this segment is driven by global food production and processing volumes, with stringent quality and safety regulations shaping product choices.
- Pharmaceuticals: Essential for drug formulation and stability, this segment's growth is linked to advancements in healthcare and the pharmaceutical industry's expansion.
- Personal Care: Chelating agents enhance the efficacy and stability of cosmetics and personal care products, driven by evolving consumer preferences for high-performance and sustainable formulations.
Geographically, Asia Pacific is emerging as the dominant market, driven by rapid industrialization, growing manufacturing sectors, and increasing investments in water treatment infrastructure. China and India, with their vast populations and expanding economies, represent significant demand centers. Government policies supporting industrial growth and environmental protection are key contributors to this dominance.
Chelating Agents Industry Product Developments
Product development in the Chelating Agents Market is characterized by a strong emphasis on sustainability and enhanced performance. Innovations are focused on creating biodegradable chelates with improved efficacy in metal sequestration and a wider range of applications. Companies are actively developing bio-based chelating agents derived from renewable resources, offering a greener alternative to petroleum-based products. These developments aim to provide competitive advantages by meeting stringent environmental regulations, appealing to eco-conscious consumers, and offering specialized solutions for niche markets. For instance, advancements in the synthesis of biodegradable chelates are improving their stability and performance in harsh industrial environments.
Report Scope & Segmentation Analysis
This report encompasses a comprehensive analysis of the Chelating Agents Market segmented by Type and Application.
- Non-biodegradable Chelating Agents: This segment is projected to grow at a CAGR of approximately 3.2% from 2025 to 2033, with an estimated market size of nearly eight billion dollars by 2033.
- Biodegradable Chelating Agents: This segment is expected to witness robust growth at a CAGR of around 7.8% from 2025 to 2033, with an estimated market size of over eleven billion dollars by 2033.
- Cleaners: This application segment is estimated to reach a market size of over four billion dollars by 2033, with a CAGR of approximately 5.0%.
- Pulp and Paper: The market for chelating agents in pulp and paper is expected to grow at a CAGR of 4.5%, reaching approximately three billion dollars by 2033.
- Water Treatment: This segment is a significant growth driver, projected to reach over five billion dollars by 2033 with a CAGR of 6.5%.
- Agrochemicals: Driven by precision agriculture, this segment is expected to grow at a CAGR of 6.0%, reaching approximately three billion dollars by 2033.
- Chemical: This segment is anticipated to grow at a CAGR of 4.8%, reaching around two billion dollars by 2033.
- Food and Beverages: With a stable growth rate, this segment is projected to reach approximately 1.5 billion dollars by 2033, with a CAGR of 4.0%.
- Pharmaceuticals: This segment is expected to experience steady growth at a CAGR of 5.2%, reaching nearly one billion dollars by 2033.
- Personal Care: Driven by consumer demand for natural and effective products, this segment is projected to grow at a CAGR of 5.8%, reaching over one billion dollars by 2033.
Key Drivers of Chelating Agents Industry Growth
The Chelating Agents Market is propelled by several key drivers. The increasing global focus on water scarcity and the imperative for efficient water management are significant growth catalysts, driving demand in the water treatment sector. Stringent environmental regulations worldwide are pushing industries to adopt more sustainable and biodegradable chelating agents, fostering innovation in this area. The burgeoning demand from the agrochemical industry for enhanced nutrient delivery systems also contributes significantly to market expansion. Furthermore, the growth of end-use industries such as pulp and paper, cleaning products, and personal care, fueled by population growth and rising living standards, directly impacts the consumption of chelating agents. Technological advancements in the synthesis and application of chelates are also unlocking new market opportunities.
Challenges in the Chelating Agents Industry Sector
Despite robust growth, the Chelating Agents Industry faces several challenges. Fluctuations in raw material prices, particularly for petrochemical-based precursors, can impact profit margins and pricing strategies. Intense competition among established players and emerging manufacturers can lead to price wars and pressure on market share. The regulatory landscape, while driving sustainable innovation, can also pose challenges with evolving compliance requirements and the need for extensive product testing and certification. Supply chain disruptions, as witnessed in recent global events, can affect the availability and cost of raw materials and finished products. Furthermore, the development of cost-effective and high-performance biodegradable alternatives that can match the efficacy of traditional chelating agents remains an ongoing challenge.
Emerging Opportunities in Chelating Agents Industry
Emerging opportunities in the Chelating Agents Market are diverse and promising. The growing demand for bio-based and biodegradable chelating agents presents a significant avenue for growth, driven by increasing consumer and regulatory pressure for sustainable solutions. The expansion of the circular economy concept is creating opportunities for chelating agents in recycling processes and waste valorization. Advancements in nanotechnology are paving the way for the development of novel chelating agents with enhanced targeted delivery and efficacy for specific applications. The untapped potential in emerging economies in Asia, Africa, and Latin America, with their rapidly developing industrial sectors and increasing focus on environmental protection, offers substantial market expansion opportunities. Furthermore, the application of chelating agents in emerging fields like bioremediation and advanced materials science presents exciting future prospects.
Leading Players in the Chelating Agents Industry Market
- ADM
- Nouryon
- Merck KGaA
- Ascend Performance Materials
- Tate & Lyle PLC
- BASF SE
- Macrocyclics
- Ava Chemicals Pvt Ltd
- Tosoh Corporation
- Kemira
- Dow
- Hexion
- Nippon Shokubai Co Ltd
- Mitsubishi Chemical Holdings Corporation
- Shandong IRO Chelating Chemical Co Ltd
- Chemtex Specialty Limited
- Nagase & Co Ltd
- Lanxess
- Zhonglan Industry Co Ltd
- Bozzetto Group
Key Developments in Chelating Agents Industry Industry
- January 2023: Nouryon acquired ADOB, a supplier of chelated micronutrients, foliars, and other specialty agricultural solutions headquartered in Poland. This acquisition strengthens Nouryon's position in the agricultural solutions market and expands its portfolio of specialty ingredients.
- February 2022: Nouryon commissioned a biodegradable chelates production facility in the Netherlands. This strategic investment underscores the company's commitment to sustainability and its response to the growing consumer demand for eco-friendly products in auto dishwashing and liquid laundry applications.
Strategic Outlook for Chelating Agents Industry Market
The strategic outlook for the Chelating Agents Market is overwhelmingly positive, driven by a confluence of escalating demand across diverse sectors and a global imperative for sustainable solutions. Key growth catalysts include the intensified focus on water conservation and treatment, stringent environmental regulations favoring biodegradable alternatives, and the expanding agrochemical sector's need for efficient nutrient delivery. The ongoing development of bio-based chelates and novel applications in emerging technologies will further solidify market expansion. Companies that prioritize R&D in sustainable chemistry, strategically invest in production capacities for biodegradable chelates, and focus on expanding their presence in high-growth regions like Asia Pacific will be well-positioned to capitalize on the substantial future market potential. The market is poised for continued innovation, increased M&A activity, and a sustained shift towards environmentally responsible chemical solutions.
Chelating Agents Industry Segmentation
-
1. Type
- 1.1. Non-biodegradable
- 1.2. Biodegradable
-
2. Application
- 2.1. Cleaners
- 2.2. Pulp and Paper
- 2.3. Water Treament
- 2.4. Agrochemicals
- 2.5. Chemical
- 2.6. Food and Beverages
- 2.7. Pharmaceuticals
- 2.8. Personal Care
- 2.9. Other Ap
Chelating Agents Industry Segmentation By Geography
-
1. Asia Pacific
- 1.1. China
- 1.2. India
- 1.3. Japan
- 1.4. South Korea
- 1.5. Rest of Asia Pacific
-
2. North America
- 2.1. United States
- 2.2. Canada
- 2.3. Mexico
-
3. Europe
- 3.1. Germany
- 3.2. United Kingdom
- 3.3. Italy
- 3.4. France
- 3.5. Rest of Europe
-
4. South America
- 4.1. Brazil
- 4.2. Argentina
- 4.3. Rest of South America
-
5. Middle East and Africa
- 5.1. Saudi Arabia
- 5.2. South Africa
- 5.3. Rest of Middle East and Africa
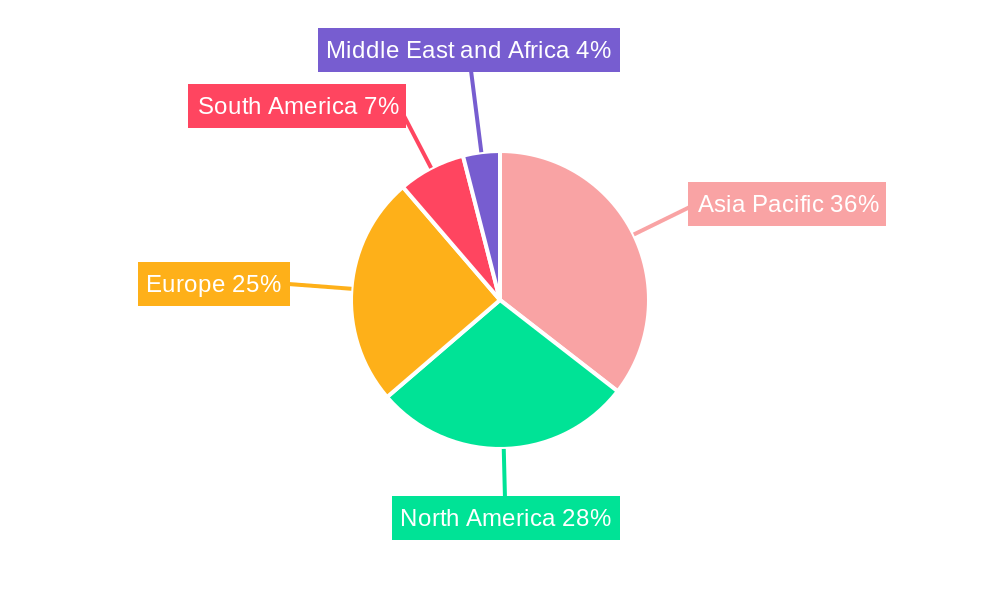
Chelating Agents Industry Regional Market Share
Geographic Coverage of Chelating Agents Industry
Chelating Agents Industry REPORT HIGHLIGHTS
| Aspects | Details |
|---|---|
| Study Period | 2020-2034 |
| Base Year | 2025 |
| Estimated Year | 2026 |
| Forecast Period | 2026-2034 |
| Historical Period | 2020-2025 |
| Growth Rate | CAGR of 4.38% from 2020-2034 |
| Segmentation |
|
Table of Contents
- 1. Introduction
- 1.1. Research Scope
- 1.2. Market Segmentation
- 1.3. Research Objective
- 1.4. Definitions and Assumptions
- 2. Executive Summary
- 2.1. Market Snapshot
- 3. Market Dynamics
- 3.1. Market Drivers
- 3.2. Market Restrains
- 3.3. Market Trends
- 3.4. Market Opportunities
- 4. Market Factor Analysis
- 4.1. Porters Five Forces
- 4.1.1. Bargaining Power of Suppliers
- 4.1.2. Bargaining Power of Buyers
- 4.1.3. Threat of New Entrants
- 4.1.4. Threat of Substitutes
- 4.1.5. Competitive Rivalry
- 4.2. PESTEL analysis
- 4.3. BCG Analysis
- 4.3.1. Stars (High Growth, High Market Share)
- 4.3.2. Cash Cows (Low Growth, High Market Share)
- 4.3.3. Question Mark (High Growth, Low Market Share)
- 4.3.4. Dogs (Low Growth, Low Market Share)
- 4.4. Ansoff Matrix Analysis
- 4.5. Supply Chain Analysis
- 4.6. Regulatory Landscape
- 4.7. Current Market Potential and Opportunity Assessment (TAM–SAM–SOM Framework)
- 4.8. RAX Analyst Note
- 4.1. Porters Five Forces
- 5. Market Analysis, Insights and Forecast 2021-2033
- 5.1. Market Analysis, Insights and Forecast - by Type
- 5.1.1. Non-biodegradable
- 5.1.2. Biodegradable
- 5.2. Market Analysis, Insights and Forecast - by Application
- 5.2.1. Cleaners
- 5.2.2. Pulp and Paper
- 5.2.3. Water Treament
- 5.2.4. Agrochemicals
- 5.2.5. Chemical
- 5.2.6. Food and Beverages
- 5.2.7. Pharmaceuticals
- 5.2.8. Personal Care
- 5.2.9. Other Ap
- 5.3. Market Analysis, Insights and Forecast - by Region
- 5.3.1. Asia Pacific
- 5.3.2. North America
- 5.3.3. Europe
- 5.3.4. South America
- 5.3.5. Middle East and Africa
- 5.1. Market Analysis, Insights and Forecast - by Type
- 6. Global Chelating Agents Industry Analysis, Insights and Forecast, 2021-2033
- 6.1. Market Analysis, Insights and Forecast - by Type
- 6.1.1. Non-biodegradable
- 6.1.2. Biodegradable
- 6.2. Market Analysis, Insights and Forecast - by Application
- 6.2.1. Cleaners
- 6.2.2. Pulp and Paper
- 6.2.3. Water Treament
- 6.2.4. Agrochemicals
- 6.2.5. Chemical
- 6.2.6. Food and Beverages
- 6.2.7. Pharmaceuticals
- 6.2.8. Personal Care
- 6.2.9. Other Ap
- 6.1. Market Analysis, Insights and Forecast - by Type
- 7. Asia Pacific Chelating Agents Industry Analysis, Insights and Forecast, 2020-2032
- 7.1. Market Analysis, Insights and Forecast - by Type
- 7.1.1. Non-biodegradable
- 7.1.2. Biodegradable
- 7.2. Market Analysis, Insights and Forecast - by Application
- 7.2.1. Cleaners
- 7.2.2. Pulp and Paper
- 7.2.3. Water Treament
- 7.2.4. Agrochemicals
- 7.2.5. Chemical
- 7.2.6. Food and Beverages
- 7.2.7. Pharmaceuticals
- 7.2.8. Personal Care
- 7.2.9. Other Ap
- 7.1. Market Analysis, Insights and Forecast - by Type
- 8. North America Chelating Agents Industry Analysis, Insights and Forecast, 2020-2032
- 8.1. Market Analysis, Insights and Forecast - by Type
- 8.1.1. Non-biodegradable
- 8.1.2. Biodegradable
- 8.2. Market Analysis, Insights and Forecast - by Application
- 8.2.1. Cleaners
- 8.2.2. Pulp and Paper
- 8.2.3. Water Treament
- 8.2.4. Agrochemicals
- 8.2.5. Chemical
- 8.2.6. Food and Beverages
- 8.2.7. Pharmaceuticals
- 8.2.8. Personal Care
- 8.2.9. Other Ap
- 8.1. Market Analysis, Insights and Forecast - by Type
- 9. Europe Chelating Agents Industry Analysis, Insights and Forecast, 2020-2032
- 9.1. Market Analysis, Insights and Forecast - by Type
- 9.1.1. Non-biodegradable
- 9.1.2. Biodegradable
- 9.2. Market Analysis, Insights and Forecast - by Application
- 9.2.1. Cleaners
- 9.2.2. Pulp and Paper
- 9.2.3. Water Treament
- 9.2.4. Agrochemicals
- 9.2.5. Chemical
- 9.2.6. Food and Beverages
- 9.2.7. Pharmaceuticals
- 9.2.8. Personal Care
- 9.2.9. Other Ap
- 9.1. Market Analysis, Insights and Forecast - by Type
- 10. South America Chelating Agents Industry Analysis, Insights and Forecast, 2020-2032
- 10.1. Market Analysis, Insights and Forecast - by Type
- 10.1.1. Non-biodegradable
- 10.1.2. Biodegradable
- 10.2. Market Analysis, Insights and Forecast - by Application
- 10.2.1. Cleaners
- 10.2.2. Pulp and Paper
- 10.2.3. Water Treament
- 10.2.4. Agrochemicals
- 10.2.5. Chemical
- 10.2.6. Food and Beverages
- 10.2.7. Pharmaceuticals
- 10.2.8. Personal Care
- 10.2.9. Other Ap
- 10.1. Market Analysis, Insights and Forecast - by Type
- 11. Middle East and Africa Chelating Agents Industry Analysis, Insights and Forecast, 2020-2032
- 11.1. Market Analysis, Insights and Forecast - by Type
- 11.1.1. Non-biodegradable
- 11.1.2. Biodegradable
- 11.2. Market Analysis, Insights and Forecast - by Application
- 11.2.1. Cleaners
- 11.2.2. Pulp and Paper
- 11.2.3. Water Treament
- 11.2.4. Agrochemicals
- 11.2.5. Chemical
- 11.2.6. Food and Beverages
- 11.2.7. Pharmaceuticals
- 11.2.8. Personal Care
- 11.2.9. Other Ap
- 11.1. Market Analysis, Insights and Forecast - by Type
- 12. Competitive Analysis
- 12.1. Company Profiles
- 12.1.1 ADM
- 12.1.1.1. Company Overview
- 12.1.1.2. Products
- 12.1.1.3. Company Financials
- 12.1.1.4. SWOT Analysis
- 12.1.2 Nouryon
- 12.1.2.1. Company Overview
- 12.1.2.2. Products
- 12.1.2.3. Company Financials
- 12.1.2.4. SWOT Analysis
- 12.1.3 Merck KGaA
- 12.1.3.1. Company Overview
- 12.1.3.2. Products
- 12.1.3.3. Company Financials
- 12.1.3.4. SWOT Analysis
- 12.1.4 Ascend Performance Materials
- 12.1.4.1. Company Overview
- 12.1.4.2. Products
- 12.1.4.3. Company Financials
- 12.1.4.4. SWOT Analysis
- 12.1.5 Tate & Lyle PLC
- 12.1.5.1. Company Overview
- 12.1.5.2. Products
- 12.1.5.3. Company Financials
- 12.1.5.4. SWOT Analysis
- 12.1.6 BASF SE
- 12.1.6.1. Company Overview
- 12.1.6.2. Products
- 12.1.6.3. Company Financials
- 12.1.6.4. SWOT Analysis
- 12.1.7 Macrocyclics
- 12.1.7.1. Company Overview
- 12.1.7.2. Products
- 12.1.7.3. Company Financials
- 12.1.7.4. SWOT Analysis
- 12.1.8 Ava Chemicals Pvt Ltd
- 12.1.8.1. Company Overview
- 12.1.8.2. Products
- 12.1.8.3. Company Financials
- 12.1.8.4. SWOT Analysis
- 12.1.9 Tosoh Corporation
- 12.1.9.1. Company Overview
- 12.1.9.2. Products
- 12.1.9.3. Company Financials
- 12.1.9.4. SWOT Analysis
- 12.1.10 Kemira
- 12.1.10.1. Company Overview
- 12.1.10.2. Products
- 12.1.10.3. Company Financials
- 12.1.10.4. SWOT Analysis
- 12.1.11 Dow
- 12.1.11.1. Company Overview
- 12.1.11.2. Products
- 12.1.11.3. Company Financials
- 12.1.11.4. SWOT Analysis
- 12.1.12 Hexion
- 12.1.12.1. Company Overview
- 12.1.12.2. Products
- 12.1.12.3. Company Financials
- 12.1.12.4. SWOT Analysis
- 12.1.13 Nippon Shokubai Co Ltd
- 12.1.13.1. Company Overview
- 12.1.13.2. Products
- 12.1.13.3. Company Financials
- 12.1.13.4. SWOT Analysis
- 12.1.14 Mitsubishi Chemical Holdings Corporation
- 12.1.14.1. Company Overview
- 12.1.14.2. Products
- 12.1.14.3. Company Financials
- 12.1.14.4. SWOT Analysis
- 12.1.15 Shandong IRO Chelating Chemical Co Ltd
- 12.1.15.1. Company Overview
- 12.1.15.2. Products
- 12.1.15.3. Company Financials
- 12.1.15.4. SWOT Analysis
- 12.1.16 Chemtex Specialty Limited
- 12.1.16.1. Company Overview
- 12.1.16.2. Products
- 12.1.16.3. Company Financials
- 12.1.16.4. SWOT Analysis
- 12.1.17 Nagase & Co Ltd
- 12.1.17.1. Company Overview
- 12.1.17.2. Products
- 12.1.17.3. Company Financials
- 12.1.17.4. SWOT Analysis
- 12.1.18 Lanxess
- 12.1.18.1. Company Overview
- 12.1.18.2. Products
- 12.1.18.3. Company Financials
- 12.1.18.4. SWOT Analysis
- 12.1.19 Zhonglan Industry Co Ltd *List Not Exhaustive
- 12.1.19.1. Company Overview
- 12.1.19.2. Products
- 12.1.19.3. Company Financials
- 12.1.19.4. SWOT Analysis
- 12.1.20 Bozzetto Group
- 12.1.20.1. Company Overview
- 12.1.20.2. Products
- 12.1.20.3. Company Financials
- 12.1.20.4. SWOT Analysis
- 12.1.1 ADM
- 12.2. Market Entropy
- 12.2.1 Company's Key Areas Served
- 12.2.2 Recent Developments
- 12.3. Company Market Share Analysis 2025
- 12.3.1 Top 5 Companies Market Share Analysis
- 12.3.2 Top 3 Companies Market Share Analysis
- 12.4. List of Potential Customers
- 13. Research Methodology
List of Figures
- Figure 1: Global Chelating Agents Industry Revenue Breakdown (billion, %) by Region 2025 & 2033
- Figure 2: Global Chelating Agents Industry Volume Breakdown (Thousand, %) by Region 2025 & 2033
- Figure 3: Asia Pacific Chelating Agents Industry Revenue (billion), by Type 2025 & 2033
- Figure 4: Asia Pacific Chelating Agents Industry Volume (Thousand), by Type 2025 & 2033
- Figure 5: Asia Pacific Chelating Agents Industry Revenue Share (%), by Type 2025 & 2033
- Figure 6: Asia Pacific Chelating Agents Industry Volume Share (%), by Type 2025 & 2033
- Figure 7: Asia Pacific Chelating Agents Industry Revenue (billion), by Application 2025 & 2033
- Figure 8: Asia Pacific Chelating Agents Industry Volume (Thousand), by Application 2025 & 2033
- Figure 9: Asia Pacific Chelating Agents Industry Revenue Share (%), by Application 2025 & 2033
- Figure 10: Asia Pacific Chelating Agents Industry Volume Share (%), by Application 2025 & 2033
- Figure 11: Asia Pacific Chelating Agents Industry Revenue (billion), by Country 2025 & 2033
- Figure 12: Asia Pacific Chelating Agents Industry Volume (Thousand), by Country 2025 & 2033
- Figure 13: Asia Pacific Chelating Agents Industry Revenue Share (%), by Country 2025 & 2033
- Figure 14: Asia Pacific Chelating Agents Industry Volume Share (%), by Country 2025 & 2033
- Figure 15: North America Chelating Agents Industry Revenue (billion), by Type 2025 & 2033
- Figure 16: North America Chelating Agents Industry Volume (Thousand), by Type 2025 & 2033
- Figure 17: North America Chelating Agents Industry Revenue Share (%), by Type 2025 & 2033
- Figure 18: North America Chelating Agents Industry Volume Share (%), by Type 2025 & 2033
- Figure 19: North America Chelating Agents Industry Revenue (billion), by Application 2025 & 2033
- Figure 20: North America Chelating Agents Industry Volume (Thousand), by Application 2025 & 2033
- Figure 21: North America Chelating Agents Industry Revenue Share (%), by Application 2025 & 2033
- Figure 22: North America Chelating Agents Industry Volume Share (%), by Application 2025 & 2033
- Figure 23: North America Chelating Agents Industry Revenue (billion), by Country 2025 & 2033
- Figure 24: North America Chelating Agents Industry Volume (Thousand), by Country 2025 & 2033
- Figure 25: North America Chelating Agents Industry Revenue Share (%), by Country 2025 & 2033
- Figure 26: North America Chelating Agents Industry Volume Share (%), by Country 2025 & 2033
- Figure 27: Europe Chelating Agents Industry Revenue (billion), by Type 2025 & 2033
- Figure 28: Europe Chelating Agents Industry Volume (Thousand), by Type 2025 & 2033
- Figure 29: Europe Chelating Agents Industry Revenue Share (%), by Type 2025 & 2033
- Figure 30: Europe Chelating Agents Industry Volume Share (%), by Type 2025 & 2033
- Figure 31: Europe Chelating Agents Industry Revenue (billion), by Application 2025 & 2033
- Figure 32: Europe Chelating Agents Industry Volume (Thousand), by Application 2025 & 2033
- Figure 33: Europe Chelating Agents Industry Revenue Share (%), by Application 2025 & 2033
- Figure 34: Europe Chelating Agents Industry Volume Share (%), by Application 2025 & 2033
- Figure 35: Europe Chelating Agents Industry Revenue (billion), by Country 2025 & 2033
- Figure 36: Europe Chelating Agents Industry Volume (Thousand), by Country 2025 & 2033
- Figure 37: Europe Chelating Agents Industry Revenue Share (%), by Country 2025 & 2033
- Figure 38: Europe Chelating Agents Industry Volume Share (%), by Country 2025 & 2033
- Figure 39: South America Chelating Agents Industry Revenue (billion), by Type 2025 & 2033
- Figure 40: South America Chelating Agents Industry Volume (Thousand), by Type 2025 & 2033
- Figure 41: South America Chelating Agents Industry Revenue Share (%), by Type 2025 & 2033
- Figure 42: South America Chelating Agents Industry Volume Share (%), by Type 2025 & 2033
- Figure 43: South America Chelating Agents Industry Revenue (billion), by Application 2025 & 2033
- Figure 44: South America Chelating Agents Industry Volume (Thousand), by Application 2025 & 2033
- Figure 45: South America Chelating Agents Industry Revenue Share (%), by Application 2025 & 2033
- Figure 46: South America Chelating Agents Industry Volume Share (%), by Application 2025 & 2033
- Figure 47: South America Chelating Agents Industry Revenue (billion), by Country 2025 & 2033
- Figure 48: South America Chelating Agents Industry Volume (Thousand), by Country 2025 & 2033
- Figure 49: South America Chelating Agents Industry Revenue Share (%), by Country 2025 & 2033
- Figure 50: South America Chelating Agents Industry Volume Share (%), by Country 2025 & 2033
- Figure 51: Middle East and Africa Chelating Agents Industry Revenue (billion), by Type 2025 & 2033
- Figure 52: Middle East and Africa Chelating Agents Industry Volume (Thousand), by Type 2025 & 2033
- Figure 53: Middle East and Africa Chelating Agents Industry Revenue Share (%), by Type 2025 & 2033
- Figure 54: Middle East and Africa Chelating Agents Industry Volume Share (%), by Type 2025 & 2033
- Figure 55: Middle East and Africa Chelating Agents Industry Revenue (billion), by Application 2025 & 2033
- Figure 56: Middle East and Africa Chelating Agents Industry Volume (Thousand), by Application 2025 & 2033
- Figure 57: Middle East and Africa Chelating Agents Industry Revenue Share (%), by Application 2025 & 2033
- Figure 58: Middle East and Africa Chelating Agents Industry Volume Share (%), by Application 2025 & 2033
- Figure 59: Middle East and Africa Chelating Agents Industry Revenue (billion), by Country 2025 & 2033
- Figure 60: Middle East and Africa Chelating Agents Industry Volume (Thousand), by Country 2025 & 2033
- Figure 61: Middle East and Africa Chelating Agents Industry Revenue Share (%), by Country 2025 & 2033
- Figure 62: Middle East and Africa Chelating Agents Industry Volume Share (%), by Country 2025 & 2033
List of Tables
- Table 1: Global Chelating Agents Industry Revenue billion Forecast, by Type 2020 & 2033
- Table 2: Global Chelating Agents Industry Volume Thousand Forecast, by Type 2020 & 2033
- Table 3: Global Chelating Agents Industry Revenue billion Forecast, by Application 2020 & 2033
- Table 4: Global Chelating Agents Industry Volume Thousand Forecast, by Application 2020 & 2033
- Table 5: Global Chelating Agents Industry Revenue billion Forecast, by Region 2020 & 2033
- Table 6: Global Chelating Agents Industry Volume Thousand Forecast, by Region 2020 & 2033
- Table 7: Global Chelating Agents Industry Revenue billion Forecast, by Type 2020 & 2033
- Table 8: Global Chelating Agents Industry Volume Thousand Forecast, by Type 2020 & 2033
- Table 9: Global Chelating Agents Industry Revenue billion Forecast, by Application 2020 & 2033
- Table 10: Global Chelating Agents Industry Volume Thousand Forecast, by Application 2020 & 2033
- Table 11: Global Chelating Agents Industry Revenue billion Forecast, by Country 2020 & 2033
- Table 12: Global Chelating Agents Industry Volume Thousand Forecast, by Country 2020 & 2033
- Table 13: China Chelating Agents Industry Revenue (billion) Forecast, by Application 2020 & 2033
- Table 14: China Chelating Agents Industry Volume (Thousand) Forecast, by Application 2020 & 2033
- Table 15: India Chelating Agents Industry Revenue (billion) Forecast, by Application 2020 & 2033
- Table 16: India Chelating Agents Industry Volume (Thousand) Forecast, by Application 2020 & 2033
- Table 17: Japan Chelating Agents Industry Revenue (billion) Forecast, by Application 2020 & 2033
- Table 18: Japan Chelating Agents Industry Volume (Thousand) Forecast, by Application 2020 & 2033
- Table 19: South Korea Chelating Agents Industry Revenue (billion) Forecast, by Application 2020 & 2033
- Table 20: South Korea Chelating Agents Industry Volume (Thousand) Forecast, by Application 2020 & 2033
- Table 21: Rest of Asia Pacific Chelating Agents Industry Revenue (billion) Forecast, by Application 2020 & 2033
- Table 22: Rest of Asia Pacific Chelating Agents Industry Volume (Thousand) Forecast, by Application 2020 & 2033
- Table 23: Global Chelating Agents Industry Revenue billion Forecast, by Type 2020 & 2033
- Table 24: Global Chelating Agents Industry Volume Thousand Forecast, by Type 2020 & 2033
- Table 25: Global Chelating Agents Industry Revenue billion Forecast, by Application 2020 & 2033
- Table 26: Global Chelating Agents Industry Volume Thousand Forecast, by Application 2020 & 2033
- Table 27: Global Chelating Agents Industry Revenue billion Forecast, by Country 2020 & 2033
- Table 28: Global Chelating Agents Industry Volume Thousand Forecast, by Country 2020 & 2033
- Table 29: United States Chelating Agents Industry Revenue (billion) Forecast, by Application 2020 & 2033
- Table 30: United States Chelating Agents Industry Volume (Thousand) Forecast, by Application 2020 & 2033
- Table 31: Canada Chelating Agents Industry Revenue (billion) Forecast, by Application 2020 & 2033
- Table 32: Canada Chelating Agents Industry Volume (Thousand) Forecast, by Application 2020 & 2033
- Table 33: Mexico Chelating Agents Industry Revenue (billion) Forecast, by Application 2020 & 2033
- Table 34: Mexico Chelating Agents Industry Volume (Thousand) Forecast, by Application 2020 & 2033
- Table 35: Global Chelating Agents Industry Revenue billion Forecast, by Type 2020 & 2033
- Table 36: Global Chelating Agents Industry Volume Thousand Forecast, by Type 2020 & 2033
- Table 37: Global Chelating Agents Industry Revenue billion Forecast, by Application 2020 & 2033
- Table 38: Global Chelating Agents Industry Volume Thousand Forecast, by Application 2020 & 2033
- Table 39: Global Chelating Agents Industry Revenue billion Forecast, by Country 2020 & 2033
- Table 40: Global Chelating Agents Industry Volume Thousand Forecast, by Country 2020 & 2033
- Table 41: Germany Chelating Agents Industry Revenue (billion) Forecast, by Application 2020 & 2033
- Table 42: Germany Chelating Agents Industry Volume (Thousand) Forecast, by Application 2020 & 2033
- Table 43: United Kingdom Chelating Agents Industry Revenue (billion) Forecast, by Application 2020 & 2033
- Table 44: United Kingdom Chelating Agents Industry Volume (Thousand) Forecast, by Application 2020 & 2033
- Table 45: Italy Chelating Agents Industry Revenue (billion) Forecast, by Application 2020 & 2033
- Table 46: Italy Chelating Agents Industry Volume (Thousand) Forecast, by Application 2020 & 2033
- Table 47: France Chelating Agents Industry Revenue (billion) Forecast, by Application 2020 & 2033
- Table 48: France Chelating Agents Industry Volume (Thousand) Forecast, by Application 2020 & 2033
- Table 49: Rest of Europe Chelating Agents Industry Revenue (billion) Forecast, by Application 2020 & 2033
- Table 50: Rest of Europe Chelating Agents Industry Volume (Thousand) Forecast, by Application 2020 & 2033
- Table 51: Global Chelating Agents Industry Revenue billion Forecast, by Type 2020 & 2033
- Table 52: Global Chelating Agents Industry Volume Thousand Forecast, by Type 2020 & 2033
- Table 53: Global Chelating Agents Industry Revenue billion Forecast, by Application 2020 & 2033
- Table 54: Global Chelating Agents Industry Volume Thousand Forecast, by Application 2020 & 2033
- Table 55: Global Chelating Agents Industry Revenue billion Forecast, by Country 2020 & 2033
- Table 56: Global Chelating Agents Industry Volume Thousand Forecast, by Country 2020 & 2033
- Table 57: Brazil Chelating Agents Industry Revenue (billion) Forecast, by Application 2020 & 2033
- Table 58: Brazil Chelating Agents Industry Volume (Thousand) Forecast, by Application 2020 & 2033
- Table 59: Argentina Chelating Agents Industry Revenue (billion) Forecast, by Application 2020 & 2033
- Table 60: Argentina Chelating Agents Industry Volume (Thousand) Forecast, by Application 2020 & 2033
- Table 61: Rest of South America Chelating Agents Industry Revenue (billion) Forecast, by Application 2020 & 2033
- Table 62: Rest of South America Chelating Agents Industry Volume (Thousand) Forecast, by Application 2020 & 2033
- Table 63: Global Chelating Agents Industry Revenue billion Forecast, by Type 2020 & 2033
- Table 64: Global Chelating Agents Industry Volume Thousand Forecast, by Type 2020 & 2033
- Table 65: Global Chelating Agents Industry Revenue billion Forecast, by Application 2020 & 2033
- Table 66: Global Chelating Agents Industry Volume Thousand Forecast, by Application 2020 & 2033
- Table 67: Global Chelating Agents Industry Revenue billion Forecast, by Country 2020 & 2033
- Table 68: Global Chelating Agents Industry Volume Thousand Forecast, by Country 2020 & 2033
- Table 69: Saudi Arabia Chelating Agents Industry Revenue (billion) Forecast, by Application 2020 & 2033
- Table 70: Saudi Arabia Chelating Agents Industry Volume (Thousand) Forecast, by Application 2020 & 2033
- Table 71: South Africa Chelating Agents Industry Revenue (billion) Forecast, by Application 2020 & 2033
- Table 72: South Africa Chelating Agents Industry Volume (Thousand) Forecast, by Application 2020 & 2033
- Table 73: Rest of Middle East and Africa Chelating Agents Industry Revenue (billion) Forecast, by Application 2020 & 2033
- Table 74: Rest of Middle East and Africa Chelating Agents Industry Volume (Thousand) Forecast, by Application 2020 & 2033
Frequently Asked Questions
1. What is the projected Compound Annual Growth Rate (CAGR) of the Chelating Agents Industry?
The projected CAGR is approximately 4.38%.
2. Which companies are prominent players in the Chelating Agents Industry?
Key companies in the market include ADM, Nouryon, Merck KGaA, Ascend Performance Materials, Tate & Lyle PLC, BASF SE, Macrocyclics, Ava Chemicals Pvt Ltd, Tosoh Corporation, Kemira, Dow, Hexion, Nippon Shokubai Co Ltd, Mitsubishi Chemical Holdings Corporation, Shandong IRO Chelating Chemical Co Ltd, Chemtex Specialty Limited, Nagase & Co Ltd, Lanxess, Zhonglan Industry Co Ltd *List Not Exhaustive, Bozzetto Group.
3. What are the main segments of the Chelating Agents Industry?
The market segments include Type, Application.
4. Can you provide details about the market size?
The market size is estimated to be USD 7.73 billion as of 2022.
5. What are some drivers contributing to market growth?
Increasing Use of Cleaners in Households; Escalating Chelating Agents Consumption in the Pulp and Paper Industry; Growing Demand in Water Treatment Applications.
6. What are the notable trends driving market growth?
Increasing Consumption of Chelating Agents in Cleaning Applications.
7. Are there any restraints impacting market growth?
Environmental Risks Associated With Non-Biodegradable Chelating Agents; Other Restraints.
8. Can you provide examples of recent developments in the market?
January 2023: Nouryon acquired ADOB, a supplier of chelated micronutrients, foliars, and other specialty agricultural solutions headquartered in Poland.
9. What pricing options are available for accessing the report?
Pricing options include single-user, multi-user, and enterprise licenses priced at USD 4750, USD 5250, and USD 8750 respectively.
10. Is the market size provided in terms of value or volume?
The market size is provided in terms of value, measured in billion and volume, measured in Thousand.
11. Are there any specific market keywords associated with the report?
Yes, the market keyword associated with the report is "Chelating Agents Industry," which aids in identifying and referencing the specific market segment covered.
12. How do I determine which pricing option suits my needs best?
The pricing options vary based on user requirements and access needs. Individual users may opt for single-user licenses, while businesses requiring broader access may choose multi-user or enterprise licenses for cost-effective access to the report.
13. Are there any additional resources or data provided in the Chelating Agents Industry report?
While the report offers comprehensive insights, it's advisable to review the specific contents or supplementary materials provided to ascertain if additional resources or data are available.
14. How can I stay updated on further developments or reports in the Chelating Agents Industry?
To stay informed about further developments, trends, and reports in the Chelating Agents Industry, consider subscribing to industry newsletters, following relevant companies and organizations, or regularly checking reputable industry news sources and publications.
Methodology
Step 1 - Identification of Relevant Samples Size from Population Database


Step 2 - Approaches for Defining Global Market Size (Value, Volume* & Price*)

Note*: In applicable scenarios
Step 3 - Data Sources
Primary Research
- Web Analytics
- Survey Reports
- Research Institute
- Latest Research Reports
- Opinion Leaders
Secondary Research
- Annual Reports
- White Paper
- Latest Press Release
- Industry Association
- Paid Database
- Investor Presentations

Step 4 - Data Triangulation
Involves using different sources of information in order to increase the validity of a study
These sources are likely to be stakeholders in a program - participants, other researchers, program staff, other community members, and so on.
Then we put all data in single framework & apply various statistical tools to find out the dynamic on the market.
During the analysis stage, feedback from the stakeholder groups would be compared to determine areas of agreement as well as areas of divergence

