

Key Insights
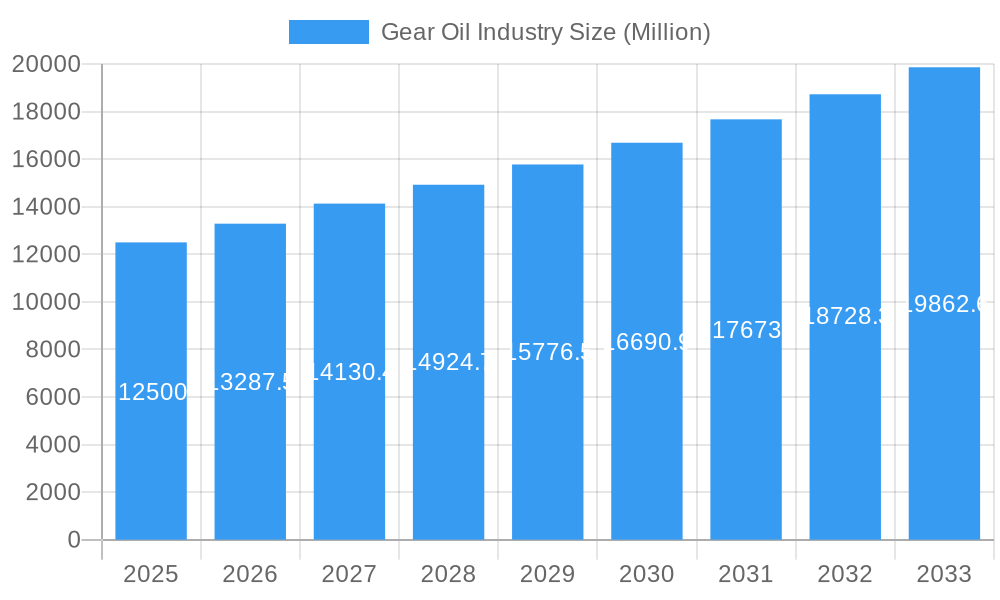
The global Gear Oil market is projected to reach $8.77 billion by 2025, exhibiting a Compound Annual Growth Rate (CAGR) of 2.7% from 2025 to 2033. This expansion is driven by increasing lubricant demand in automotive applications, vehicle production, and complex transmission systems. Industrial machinery in manufacturing, agriculture, and energy sectors also requires high-performance gear oils for optimal operation, longevity, and wear reduction. Historical data from 2019-2024 shows a consistent upward trend, reflecting the market's resilience and adaptability to technological advancements and industrial needs.
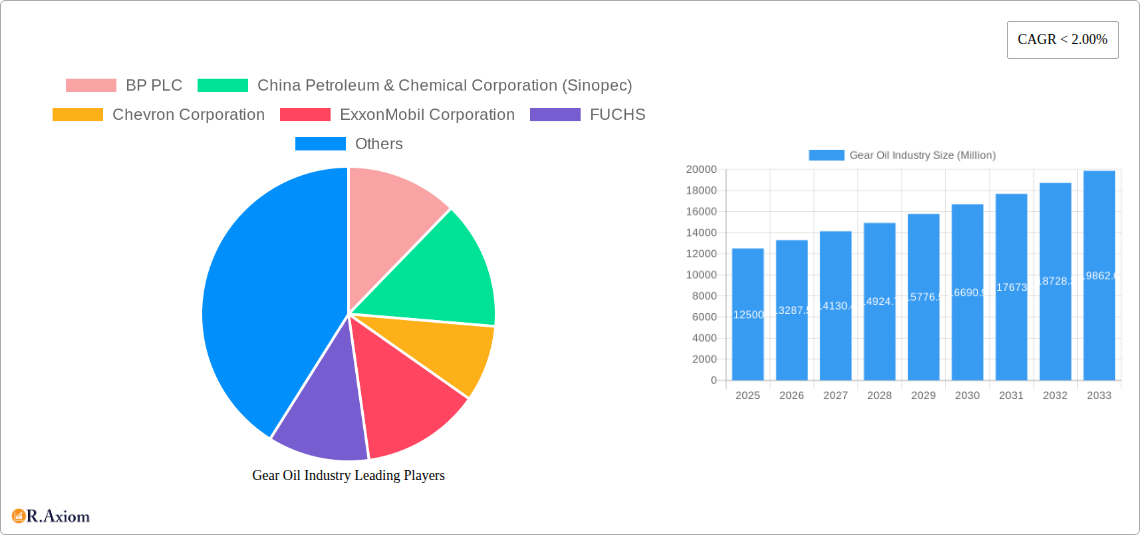
Gear Oil Industry Market Size (In Billion)
Advancements in synthetic and semi-synthetic gear oil formulations, offering superior thermal stability, extended drain intervals, and enhanced protection against extreme pressures and temperatures, are further accelerating growth. The focus on energy efficiency and sustainability in industries also boosts demand for specialized gear oils that minimize friction and energy loss. North America and Europe are expected to maintain dominant market positions due to established industrial bases and stringent performance standards. However, the Asia-Pacific region is forecast to experience the most dynamic growth, propelled by rapid industrialization, a growing automotive sector, and significant infrastructure investments. Emerging economies offer substantial opportunities as they upgrade machinery and manufacturing capabilities, requiring advanced lubrication solutions.
Gear Oil Industry Company Market Share
This detailed report provides an in-depth analysis of the Gear Oil industry, including market size, growth forecasts, and key trends.
Gear Oil Industry Market Concentration & Innovation
The global gear oil market exhibits a moderate to high level of concentration, with major multinational corporations like BP PLC, China Petroleum & Chemical Corporation (Sinopec), Chevron Corporation, ExxonMobil Corporation, FUCHS, Lukoil, and Royal Dutch Shell PLC holding significant market share. These industry giants invest heavily in research and development, driving innovation in areas such as advanced synthetic formulations and eco-friendly lubricant solutions. Regulatory frameworks, including stringent emissions standards and environmental protection mandates, play a crucial role in shaping product development and market entry. The increasing demand for higher performance, fuel efficiency, and extended drain intervals are key innovation drivers. While direct product substitutes are limited, advancements in transmission technologies (e.g., the rise of Electric Vehicles impacting manual gearbox oil demand) and alternative lubrication methods present potential disruptors. Mergers and acquisitions remain a strategic tool for market consolidation and expansion, with recent M&A deal values estimated to be in the hundreds of millions of dollars as companies seek to broaden their product portfolios and geographical reach. Understanding these dynamics is crucial for stakeholders in the industrial lubricants and automotive fluids sectors.
Gear Oil Industry Industry Trends & Insights
The global gear oil market is poised for sustained growth, driven by robust demand across various end-user industries and burgeoning technological advancements. The projected Compound Annual Growth Rate (CAGR) for the forecast period of 2025–2033 is estimated to be in the range of 4.5% to 6.0%. This growth is underpinned by several key trends. The expanding automotive sector, particularly in emerging economies, continues to be a primary demand generator for transportation gear oils, including those for manual gearboxes, automatic gearboxes (CVT, DCT, etc.), and axle oils. The increasing production of vehicles, coupled with a rising average vehicle age, necessitates regular maintenance and replacement of essential components like gear oils. Furthermore, the industrial segment, encompassing power generation, metallurgy & metalworking, and heavy equipment manufacturing, is experiencing significant expansion, fueling demand for high-performance industrial gear oils. Technological disruptions are playing a pivotal role, with a noticeable shift towards synthetic and semi-synthetic formulations that offer superior performance characteristics such as enhanced thermal stability, reduced friction, and extended service life. This trend is particularly evident in demanding applications within the heavy equipment and metallurgy & metalworking sectors. Consumer preferences are evolving towards lubricants that offer improved fuel economy, reduced environmental impact, and longer intervals between maintenance. This has led to increased adoption of premium, high-performance gear oils. Competitive dynamics are characterized by intense innovation, strategic partnerships, and a focus on sustainable product offerings. Market penetration of advanced lubricant technologies is steadily increasing across all segments. The overall market penetration of high-performance gear oils is projected to reach over 65% by the end of the forecast period.
Dominant Markets & Segments in Gear Oil Industry
The global gear oil market is segmented by Product Type and End-user Industry, with the Transportation segment demonstrating significant dominance, particularly within the Automotive & Other Transportation end-user industry. This dominance is driven by the sheer volume of vehicles manufactured and in operation worldwide.
Product Type Dominance:
- Transportation: This segment accounts for an estimated 60% to 65% of the total market revenue.
- Automatic Gearbox (CVT, DCT, etc.) Oils: This sub-segment is experiencing the fastest growth due to the increasing adoption of automatic transmissions in new vehicle production, driven by consumer demand for convenience and fuel efficiency. Market share for automatic gearbox oils is projected to reach over 30% within the transportation segment by 2033.
- Manual Gearbox Oils: While still a substantial segment, its growth is more moderate, influenced by the continued, albeit declining, production of manual transmission vehicles and the existing large installed base.
- Axle Oils: Essential for drivetrain lubrication, this sub-segment maintains steady demand, closely tracking automotive production and the heavy-duty vehicle market.
End-user Industry Dominance:
Automotive & Other Transportation: This sector is the largest consumer of gear oils, representing approximately 55% to 60% of the overall market value.
- Key Drivers:
- Robust Vehicle Production: Sustained growth in global vehicle manufacturing, especially in Asia-Pacific, directly translates to increased demand for automotive gear lubricants.
- Fleet Modernization: The ongoing replacement of older vehicles with newer models equipped with advanced transmission systems fuels demand for specialized gear oils.
- Logistics and Freight Growth: An expanding global logistics network necessitates a large and well-maintained commercial vehicle fleet, driving demand for heavy-duty axle and transmission oils.
- Key Drivers:
Industrial: This segment collectively represents a significant portion of the market, with notable contributions from:
- Heavy Equipment: Demand from construction, mining, and agriculture industries for robust gear oils capable of withstanding extreme operating conditions. The market size for heavy equipment gear oils is estimated to be around US$ 8,000 million.
- Metallurgy & Metalworking: Requirements for specialized gear oils in rolling mills, presses, and other metal processing machinery, where high load-carrying capacity and extreme temperature resistance are crucial.
- Power Generation: Lubrication needs for wind turbines, hydroelectric power plants, and other power generation equipment, demanding long-life, high-performance lubricants.
Geographical Dominance:
- Asia-Pacific is the leading region, driven by its massive automotive production capacity, rapidly growing industrial base, and increasing infrastructure development. China and India are key contributors to this regional dominance.
Gear Oil Industry Product Developments
Recent product developments in the gear oil industry focus on enhanced performance and sustainability. Innovations include the formulation of advanced synthetic gear oils offering superior thermal stability, extended drain intervals, and improved fuel efficiency for automotive transmissions. Furthermore, there's a growing emphasis on biodegradable and low-toxicity industrial gear oils to meet stringent environmental regulations. These developments are driven by the need to optimize equipment longevity, reduce maintenance costs, and minimize environmental impact across diverse applications, from heavy-duty vehicles to critical industrial machinery. Competitive advantages are being gained through superior lubrication properties under extreme pressure and temperature conditions.
Report Scope & Segmentation Analysis
This report provides a comprehensive analysis of the global gear oil market, segmented across key product types and end-user industries. The Product Type segmentation includes Transportation (further broken down into Manual Gearbox Oils, Automatic Gearbox (CVT, DCT, etc.) Oils, and Axle Oils) and Industrial gear oils. The End-user Industry segmentation covers Power Generation, Automotive & Other Transportation, Heavy Equipment, Metallurgy & Metalworking, and Other End-user Industries. Each segment is analyzed for market size, growth projections, and competitive dynamics. The Transportation segment, particularly Automatic Gearbox oils, is projected to experience the highest growth, reaching an estimated market value of US$ 12,000 million by 2033. Industrial segments, especially Heavy Equipment, are expected to grow at a steady CAGR of around 4.0%.
Key Drivers of Gear Oil Industry Growth
Several key factors are propelling the growth of the gear oil industry. The sustained expansion of the global automotive sector, particularly in emerging economies, directly fuels demand for transportation gear oils. The increasing sophistication of vehicle transmissions, such as the widespread adoption of CVTs and DCTs, necessitates specialized and high-performance automatic transmission fluids. In the industrial realm, robust growth in sectors like heavy equipment manufacturing, mining, and renewable energy (especially wind turbines) drives demand for industrial gear oils capable of operating under extreme conditions. Technological advancements leading to the development of synthetic and semi-synthetic formulations offering enhanced lubrication, fuel efficiency, and extended service life are also significant growth catalysts. Stringent environmental regulations are pushing the adoption of more eco-friendly and biodegradable lubricant solutions.
Challenges in the Gear Oil Industry Sector
Despite robust growth, the gear oil industry faces several challenges. Fluctuations in raw material prices, particularly crude oil derivatives, can impact production costs and profit margins. The increasing adoption of electric vehicles (EVs) poses a long-term challenge to the demand for traditional manual and automatic gearbox oils, although EV transmissions still require specialized lubricants. Stringent environmental regulations, while driving innovation, also increase compliance costs for manufacturers. Intense competition among established players and the emergence of new entrants can lead to price pressures. Furthermore, ensuring the availability of consistent quality lubricants across vast and diverse geographical markets, especially in developing regions, presents logistical hurdles. Supply chain disruptions, as witnessed in recent years, can also impact product availability and lead times.
Emerging Opportunities in Gear Oil Industry
The gear oil industry is ripe with emerging opportunities. The continued growth of the heavy equipment and mining sectors in developing nations offers significant potential for industrial gear oil sales. The burgeoning renewable energy sector, particularly wind power, presents a growing market for specialized wind turbine gear oils that demand high performance and long service life. The increasing focus on sustainability is creating opportunities for manufacturers to develop and market biodegradable, bio-based, and low-emission gear oils. The aftermarket for automotive gear oils, driven by the growing global vehicle parc and the demand for extended maintenance intervals, remains a strong opportunity. Furthermore, the development of advanced lubrication solutions for the evolving electric vehicle powertrains, though different from traditional gear oils, represents a significant future growth area.
Leading Players in the Gear Oil Industry Market
- BP PLC
- China Petroleum & Chemical Corporation (Sinopec)
- Chevron Corporation
- ExxonMobil Corporation
- FUCHS
- Gazprom Neft PJSC
- Gulf Oil Corporation Limited
- Idemitsu Kosan Co Ltd
- Indian Oil Corporation Ltd
- JX Nippon Oil & Energy Corporation
- Kemipex
- Lukoil
- Royal Dutch Shell PLC
- Total SA
Key Developments in Gear Oil Industry Industry
- 2023 Q4: Launch of a new generation of synthetic heavy-duty transmission fluids designed for enhanced fuel economy and extended drain intervals in commercial vehicles.
- 2023 Q3: Acquisition of a specialty lubricant manufacturer by a major player to strengthen its presence in the industrial gear oil segment.
- 2023 Q2: Introduction of a range of biodegradable gear oils for wind turbine applications, meeting stringent environmental standards.
- 2023 Q1: Increased investment in R&D for advanced additive packages to improve the performance of automatic transmission fluids in electric and hybrid vehicles.
- 2022 Q4: Major oil companies announce strategic partnerships to develop and distribute next-generation gear lubricants.
- 2022 Q3: Expansion of manufacturing capacity for high-performance gear oils to meet growing demand in emerging markets.
Strategic Outlook for Gear Oil Industry Market
The strategic outlook for the gear oil industry is characterized by continued growth driven by evolving automotive technologies and sustained industrial expansion. A key focus will be on innovation in synthetic and specialty lubricants that offer superior performance, fuel efficiency, and extended component life. The increasing emphasis on sustainability will drive the development and adoption of environmentally friendly formulations. Companies that can adapt to the shift towards electric mobility by developing suitable EV transmission fluids will be well-positioned for future success. Strategic investments in research and development, coupled with a robust global distribution network and a keen understanding of regional market dynamics, will be crucial for maintaining a competitive edge. Expansion into emerging markets and strategic collaborations will further shape the industry landscape.
Gear Oil Industry Segmentation
-
1. Product Type
-
1.1. Transportation
- 1.1.1. Manual Gearbox
- 1.1.2. Automatic Gearbox (CVT, DCT, etc.)
- 1.1.3. Axle Oils
- 1.2. Industrial
-
1.1. Transportation
-
2. End-user Industry
- 2.1. Power Generation
- 2.2. Automotive & Other Transportation
- 2.3. Heavy Equipment
- 2.4. Metallurgy & Metalworking
- 2.5. Other End-user Industries
Gear Oil Industry Segmentation By Geography
-
1. Asia Pacific
- 1.1. China
- 1.2. India
- 1.3. Japan
- 1.4. South Korea
- 1.5. ASEAN Countries
- 1.6. Rest of Asia Pacific
-
2. North America
- 2.1. United States
- 2.2. Mexico
- 2.3. Canada
-
3. Europe
- 3.1. Germany
- 3.2. France
- 3.3. United Kingdom
- 3.4. Italy
- 3.5. Russia
- 3.6. Spain
- 3.7. Turkey
- 3.8. Rest of Europe
-
4. South America
- 4.1. Brazil
- 4.2. Argentina
- 4.3. Rest of South America
-
5. Middle East
- 5.1. Saudi Arabia
- 5.2. United Arab Emirates
- 5.3. Rest of the Middle East
-
6. Africa
- 6.1. Egypt
- 6.2. South Africa
- 6.3. Rest of Africa
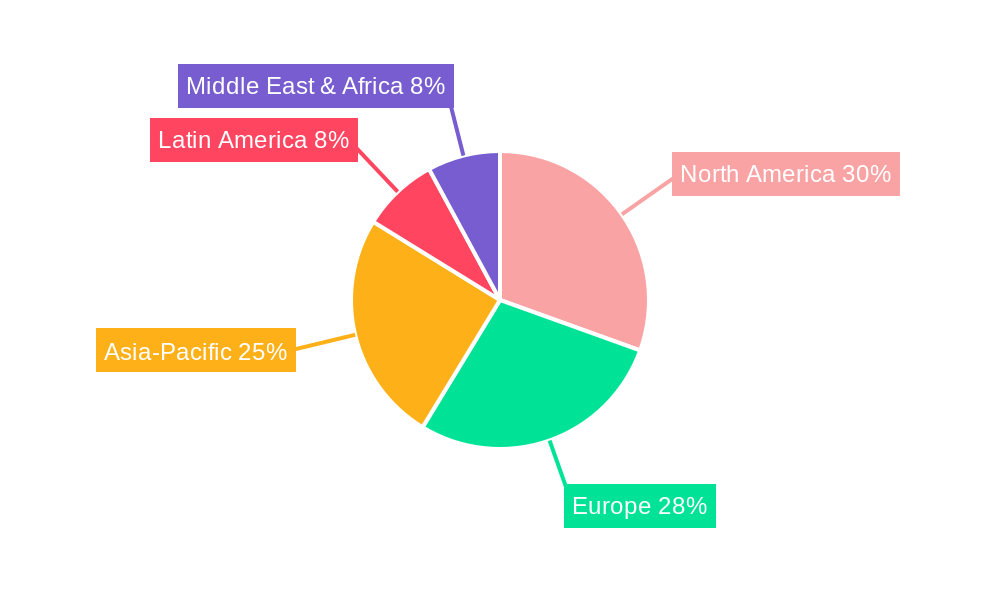
Gear Oil Industry Regional Market Share
Geographic Coverage of Gear Oil Industry
Gear Oil Industry REPORT HIGHLIGHTS
| Aspects | Details |
|---|---|
| Study Period | 2020-2034 |
| Base Year | 2025 |
| Estimated Year | 2026 |
| Forecast Period | 2026-2034 |
| Historical Period | 2020-2025 |
| Growth Rate | CAGR of 2.7% from 2020-2034 |
| Segmentation |
|
Table of Contents
- 1. Introduction
- 1.1. Research Scope
- 1.2. Market Segmentation
- 1.3. Research Objective
- 1.4. Definitions and Assumptions
- 2. Executive Summary
- 2.1. Market Snapshot
- 3. Market Dynamics
- 3.1. Market Drivers
- 3.2. Market Restrains
- 3.3. Market Trends
- 3.4. Market Opportunities
- 4. Market Factor Analysis
- 4.1. Porters Five Forces
- 4.1.1. Bargaining Power of Suppliers
- 4.1.2. Bargaining Power of Buyers
- 4.1.3. Threat of New Entrants
- 4.1.4. Threat of Substitutes
- 4.1.5. Competitive Rivalry
- 4.2. PESTEL analysis
- 4.3. BCG Analysis
- 4.3.1. Stars (High Growth, High Market Share)
- 4.3.2. Cash Cows (Low Growth, High Market Share)
- 4.3.3. Question Mark (High Growth, Low Market Share)
- 4.3.4. Dogs (Low Growth, Low Market Share)
- 4.4. Ansoff Matrix Analysis
- 4.5. Supply Chain Analysis
- 4.6. Regulatory Landscape
- 4.7. Current Market Potential and Opportunity Assessment (TAM–SAM–SOM Framework)
- 4.8. RAX Analyst Note
- 4.1. Porters Five Forces
- 5. Market Analysis, Insights and Forecast 2021-2033
- 5.1. Market Analysis, Insights and Forecast - by Product Type
- 5.1.1. Transportation
- 5.1.1.1. Manual Gearbox
- 5.1.1.2. Automatic Gearbox (CVT, DCT, etc.)
- 5.1.1.3. Axle Oils
- 5.1.2. Industrial
- 5.1.1. Transportation
- 5.2. Market Analysis, Insights and Forecast - by End-user Industry
- 5.2.1. Power Generation
- 5.2.2. Automotive & Other Transportation
- 5.2.3. Heavy Equipment
- 5.2.4. Metallurgy & Metalworking
- 5.2.5. Other End-user Industries
- 5.3. Market Analysis, Insights and Forecast - by Region
- 5.3.1. Asia Pacific
- 5.3.2. North America
- 5.3.3. Europe
- 5.3.4. South America
- 5.3.5. Middle East
- 5.3.6. Africa
- 5.1. Market Analysis, Insights and Forecast - by Product Type
- 6. Global Gear Oil Industry Analysis, Insights and Forecast, 2021-2033
- 6.1. Market Analysis, Insights and Forecast - by Product Type
- 6.1.1. Transportation
- 6.1.1.1. Manual Gearbox
- 6.1.1.2. Automatic Gearbox (CVT, DCT, etc.)
- 6.1.1.3. Axle Oils
- 6.1.2. Industrial
- 6.1.1. Transportation
- 6.2. Market Analysis, Insights and Forecast - by End-user Industry
- 6.2.1. Power Generation
- 6.2.2. Automotive & Other Transportation
- 6.2.3. Heavy Equipment
- 6.2.4. Metallurgy & Metalworking
- 6.2.5. Other End-user Industries
- 6.1. Market Analysis, Insights and Forecast - by Product Type
- 7. Asia Pacific Gear Oil Industry Analysis, Insights and Forecast, 2020-2032
- 7.1. Market Analysis, Insights and Forecast - by Product Type
- 7.1.1. Transportation
- 7.1.1.1. Manual Gearbox
- 7.1.1.2. Automatic Gearbox (CVT, DCT, etc.)
- 7.1.1.3. Axle Oils
- 7.1.2. Industrial
- 7.1.1. Transportation
- 7.2. Market Analysis, Insights and Forecast - by End-user Industry
- 7.2.1. Power Generation
- 7.2.2. Automotive & Other Transportation
- 7.2.3. Heavy Equipment
- 7.2.4. Metallurgy & Metalworking
- 7.2.5. Other End-user Industries
- 7.1. Market Analysis, Insights and Forecast - by Product Type
- 8. North America Gear Oil Industry Analysis, Insights and Forecast, 2020-2032
- 8.1. Market Analysis, Insights and Forecast - by Product Type
- 8.1.1. Transportation
- 8.1.1.1. Manual Gearbox
- 8.1.1.2. Automatic Gearbox (CVT, DCT, etc.)
- 8.1.1.3. Axle Oils
- 8.1.2. Industrial
- 8.1.1. Transportation
- 8.2. Market Analysis, Insights and Forecast - by End-user Industry
- 8.2.1. Power Generation
- 8.2.2. Automotive & Other Transportation
- 8.2.3. Heavy Equipment
- 8.2.4. Metallurgy & Metalworking
- 8.2.5. Other End-user Industries
- 8.1. Market Analysis, Insights and Forecast - by Product Type
- 9. Europe Gear Oil Industry Analysis, Insights and Forecast, 2020-2032
- 9.1. Market Analysis, Insights and Forecast - by Product Type
- 9.1.1. Transportation
- 9.1.1.1. Manual Gearbox
- 9.1.1.2. Automatic Gearbox (CVT, DCT, etc.)
- 9.1.1.3. Axle Oils
- 9.1.2. Industrial
- 9.1.1. Transportation
- 9.2. Market Analysis, Insights and Forecast - by End-user Industry
- 9.2.1. Power Generation
- 9.2.2. Automotive & Other Transportation
- 9.2.3. Heavy Equipment
- 9.2.4. Metallurgy & Metalworking
- 9.2.5. Other End-user Industries
- 9.1. Market Analysis, Insights and Forecast - by Product Type
- 10. South America Gear Oil Industry Analysis, Insights and Forecast, 2020-2032
- 10.1. Market Analysis, Insights and Forecast - by Product Type
- 10.1.1. Transportation
- 10.1.1.1. Manual Gearbox
- 10.1.1.2. Automatic Gearbox (CVT, DCT, etc.)
- 10.1.1.3. Axle Oils
- 10.1.2. Industrial
- 10.1.1. Transportation
- 10.2. Market Analysis, Insights and Forecast - by End-user Industry
- 10.2.1. Power Generation
- 10.2.2. Automotive & Other Transportation
- 10.2.3. Heavy Equipment
- 10.2.4. Metallurgy & Metalworking
- 10.2.5. Other End-user Industries
- 10.1. Market Analysis, Insights and Forecast - by Product Type
- 11. Middle East Gear Oil Industry Analysis, Insights and Forecast, 2020-2032
- 11.1. Market Analysis, Insights and Forecast - by Product Type
- 11.1.1. Transportation
- 11.1.1.1. Manual Gearbox
- 11.1.1.2. Automatic Gearbox (CVT, DCT, etc.)
- 11.1.1.3. Axle Oils
- 11.1.2. Industrial
- 11.1.1. Transportation
- 11.2. Market Analysis, Insights and Forecast - by End-user Industry
- 11.2.1. Power Generation
- 11.2.2. Automotive & Other Transportation
- 11.2.3. Heavy Equipment
- 11.2.4. Metallurgy & Metalworking
- 11.2.5. Other End-user Industries
- 11.1. Market Analysis, Insights and Forecast - by Product Type
- 12. Africa Gear Oil Industry Analysis, Insights and Forecast, 2020-2032
- 12.1. Market Analysis, Insights and Forecast - by Product Type
- 12.1.1. Transportation
- 12.1.1.1. Manual Gearbox
- 12.1.1.2. Automatic Gearbox (CVT, DCT, etc.)
- 12.1.1.3. Axle Oils
- 12.1.2. Industrial
- 12.1.1. Transportation
- 12.2. Market Analysis, Insights and Forecast - by End-user Industry
- 12.2.1. Power Generation
- 12.2.2. Automotive & Other Transportation
- 12.2.3. Heavy Equipment
- 12.2.4. Metallurgy & Metalworking
- 12.2.5. Other End-user Industries
- 12.1. Market Analysis, Insights and Forecast - by Product Type
- 13. Competitive Analysis
- 13.1. Company Profiles
- 13.1.1 BP PLC
- 13.1.1.1. Company Overview
- 13.1.1.2. Products
- 13.1.1.3. Company Financials
- 13.1.1.4. SWOT Analysis
- 13.1.2 China Petroleum & Chemical Corporation (Sinopec)
- 13.1.2.1. Company Overview
- 13.1.2.2. Products
- 13.1.2.3. Company Financials
- 13.1.2.4. SWOT Analysis
- 13.1.3 Chevron Corporation
- 13.1.3.1. Company Overview
- 13.1.3.2. Products
- 13.1.3.3. Company Financials
- 13.1.3.4. SWOT Analysis
- 13.1.4 ExxonMobil Corporation
- 13.1.4.1. Company Overview
- 13.1.4.2. Products
- 13.1.4.3. Company Financials
- 13.1.4.4. SWOT Analysis
- 13.1.5 FUCHS
- 13.1.5.1. Company Overview
- 13.1.5.2. Products
- 13.1.5.3. Company Financials
- 13.1.5.4. SWOT Analysis
- 13.1.6 Gazprom Neft PJSC
- 13.1.6.1. Company Overview
- 13.1.6.2. Products
- 13.1.6.3. Company Financials
- 13.1.6.4. SWOT Analysis
- 13.1.7 Gulf Oil Corporation Limited
- 13.1.7.1. Company Overview
- 13.1.7.2. Products
- 13.1.7.3. Company Financials
- 13.1.7.4. SWOT Analysis
- 13.1.8 Idemitsu Kosan Co Ltd
- 13.1.8.1. Company Overview
- 13.1.8.2. Products
- 13.1.8.3. Company Financials
- 13.1.8.4. SWOT Analysis
- 13.1.9 Indian Oil Corporation Ltd
- 13.1.9.1. Company Overview
- 13.1.9.2. Products
- 13.1.9.3. Company Financials
- 13.1.9.4. SWOT Analysis
- 13.1.10 JX Nippon Oil & Energy Corporation
- 13.1.10.1. Company Overview
- 13.1.10.2. Products
- 13.1.10.3. Company Financials
- 13.1.10.4. SWOT Analysis
- 13.1.11 Kemipex
- 13.1.11.1. Company Overview
- 13.1.11.2. Products
- 13.1.11.3. Company Financials
- 13.1.11.4. SWOT Analysis
- 13.1.12 Lukoil
- 13.1.12.1. Company Overview
- 13.1.12.2. Products
- 13.1.12.3. Company Financials
- 13.1.12.4. SWOT Analysis
- 13.1.13 Royal Dutch Shell PLC
- 13.1.13.1. Company Overview
- 13.1.13.2. Products
- 13.1.13.3. Company Financials
- 13.1.13.4. SWOT Analysis
- 13.1.14 Total SA*List Not Exhaustive
- 13.1.14.1. Company Overview
- 13.1.14.2. Products
- 13.1.14.3. Company Financials
- 13.1.14.4. SWOT Analysis
- 13.1.1 BP PLC
- 13.2. Market Entropy
- 13.2.1 Company's Key Areas Served
- 13.2.2 Recent Developments
- 13.3. Company Market Share Analysis 2025
- 13.3.1 Top 5 Companies Market Share Analysis
- 13.3.2 Top 3 Companies Market Share Analysis
- 13.4. List of Potential Customers
- 14. Research Methodology
List of Figures
- Figure 1: Global Gear Oil Industry Revenue Breakdown (billion, %) by Region 2025 & 2033
- Figure 2: Asia Pacific Gear Oil Industry Revenue (billion), by Product Type 2025 & 2033
- Figure 3: Asia Pacific Gear Oil Industry Revenue Share (%), by Product Type 2025 & 2033
- Figure 4: Asia Pacific Gear Oil Industry Revenue (billion), by End-user Industry 2025 & 2033
- Figure 5: Asia Pacific Gear Oil Industry Revenue Share (%), by End-user Industry 2025 & 2033
- Figure 6: Asia Pacific Gear Oil Industry Revenue (billion), by Country 2025 & 2033
- Figure 7: Asia Pacific Gear Oil Industry Revenue Share (%), by Country 2025 & 2033
- Figure 8: North America Gear Oil Industry Revenue (billion), by Product Type 2025 & 2033
- Figure 9: North America Gear Oil Industry Revenue Share (%), by Product Type 2025 & 2033
- Figure 10: North America Gear Oil Industry Revenue (billion), by End-user Industry 2025 & 2033
- Figure 11: North America Gear Oil Industry Revenue Share (%), by End-user Industry 2025 & 2033
- Figure 12: North America Gear Oil Industry Revenue (billion), by Country 2025 & 2033
- Figure 13: North America Gear Oil Industry Revenue Share (%), by Country 2025 & 2033
- Figure 14: Europe Gear Oil Industry Revenue (billion), by Product Type 2025 & 2033
- Figure 15: Europe Gear Oil Industry Revenue Share (%), by Product Type 2025 & 2033
- Figure 16: Europe Gear Oil Industry Revenue (billion), by End-user Industry 2025 & 2033
- Figure 17: Europe Gear Oil Industry Revenue Share (%), by End-user Industry 2025 & 2033
- Figure 18: Europe Gear Oil Industry Revenue (billion), by Country 2025 & 2033
- Figure 19: Europe Gear Oil Industry Revenue Share (%), by Country 2025 & 2033
- Figure 20: South America Gear Oil Industry Revenue (billion), by Product Type 2025 & 2033
- Figure 21: South America Gear Oil Industry Revenue Share (%), by Product Type 2025 & 2033
- Figure 22: South America Gear Oil Industry Revenue (billion), by End-user Industry 2025 & 2033
- Figure 23: South America Gear Oil Industry Revenue Share (%), by End-user Industry 2025 & 2033
- Figure 24: South America Gear Oil Industry Revenue (billion), by Country 2025 & 2033
- Figure 25: South America Gear Oil Industry Revenue Share (%), by Country 2025 & 2033
- Figure 26: Middle East Gear Oil Industry Revenue (billion), by Product Type 2025 & 2033
- Figure 27: Middle East Gear Oil Industry Revenue Share (%), by Product Type 2025 & 2033
- Figure 28: Middle East Gear Oil Industry Revenue (billion), by End-user Industry 2025 & 2033
- Figure 29: Middle East Gear Oil Industry Revenue Share (%), by End-user Industry 2025 & 2033
- Figure 30: Middle East Gear Oil Industry Revenue (billion), by Country 2025 & 2033
- Figure 31: Middle East Gear Oil Industry Revenue Share (%), by Country 2025 & 2033
- Figure 32: Africa Gear Oil Industry Revenue (billion), by Product Type 2025 & 2033
- Figure 33: Africa Gear Oil Industry Revenue Share (%), by Product Type 2025 & 2033
- Figure 34: Africa Gear Oil Industry Revenue (billion), by End-user Industry 2025 & 2033
- Figure 35: Africa Gear Oil Industry Revenue Share (%), by End-user Industry 2025 & 2033
- Figure 36: Africa Gear Oil Industry Revenue (billion), by Country 2025 & 2033
- Figure 37: Africa Gear Oil Industry Revenue Share (%), by Country 2025 & 2033
List of Tables
- Table 1: Global Gear Oil Industry Revenue billion Forecast, by Product Type 2020 & 2033
- Table 2: Global Gear Oil Industry Revenue billion Forecast, by End-user Industry 2020 & 2033
- Table 3: Global Gear Oil Industry Revenue billion Forecast, by Region 2020 & 2033
- Table 4: Global Gear Oil Industry Revenue billion Forecast, by Product Type 2020 & 2033
- Table 5: Global Gear Oil Industry Revenue billion Forecast, by End-user Industry 2020 & 2033
- Table 6: Global Gear Oil Industry Revenue billion Forecast, by Country 2020 & 2033
- Table 7: China Gear Oil Industry Revenue (billion) Forecast, by Application 2020 & 2033
- Table 8: India Gear Oil Industry Revenue (billion) Forecast, by Application 2020 & 2033
- Table 9: Japan Gear Oil Industry Revenue (billion) Forecast, by Application 2020 & 2033
- Table 10: South Korea Gear Oil Industry Revenue (billion) Forecast, by Application 2020 & 2033
- Table 11: ASEAN Countries Gear Oil Industry Revenue (billion) Forecast, by Application 2020 & 2033
- Table 12: Rest of Asia Pacific Gear Oil Industry Revenue (billion) Forecast, by Application 2020 & 2033
- Table 13: Global Gear Oil Industry Revenue billion Forecast, by Product Type 2020 & 2033
- Table 14: Global Gear Oil Industry Revenue billion Forecast, by End-user Industry 2020 & 2033
- Table 15: Global Gear Oil Industry Revenue billion Forecast, by Country 2020 & 2033
- Table 16: United States Gear Oil Industry Revenue (billion) Forecast, by Application 2020 & 2033
- Table 17: Mexico Gear Oil Industry Revenue (billion) Forecast, by Application 2020 & 2033
- Table 18: Canada Gear Oil Industry Revenue (billion) Forecast, by Application 2020 & 2033
- Table 19: Global Gear Oil Industry Revenue billion Forecast, by Product Type 2020 & 2033
- Table 20: Global Gear Oil Industry Revenue billion Forecast, by End-user Industry 2020 & 2033
- Table 21: Global Gear Oil Industry Revenue billion Forecast, by Country 2020 & 2033
- Table 22: Germany Gear Oil Industry Revenue (billion) Forecast, by Application 2020 & 2033
- Table 23: France Gear Oil Industry Revenue (billion) Forecast, by Application 2020 & 2033
- Table 24: United Kingdom Gear Oil Industry Revenue (billion) Forecast, by Application 2020 & 2033
- Table 25: Italy Gear Oil Industry Revenue (billion) Forecast, by Application 2020 & 2033
- Table 26: Russia Gear Oil Industry Revenue (billion) Forecast, by Application 2020 & 2033
- Table 27: Spain Gear Oil Industry Revenue (billion) Forecast, by Application 2020 & 2033
- Table 28: Turkey Gear Oil Industry Revenue (billion) Forecast, by Application 2020 & 2033
- Table 29: Rest of Europe Gear Oil Industry Revenue (billion) Forecast, by Application 2020 & 2033
- Table 30: Global Gear Oil Industry Revenue billion Forecast, by Product Type 2020 & 2033
- Table 31: Global Gear Oil Industry Revenue billion Forecast, by End-user Industry 2020 & 2033
- Table 32: Global Gear Oil Industry Revenue billion Forecast, by Country 2020 & 2033
- Table 33: Brazil Gear Oil Industry Revenue (billion) Forecast, by Application 2020 & 2033
- Table 34: Argentina Gear Oil Industry Revenue (billion) Forecast, by Application 2020 & 2033
- Table 35: Rest of South America Gear Oil Industry Revenue (billion) Forecast, by Application 2020 & 2033
- Table 36: Global Gear Oil Industry Revenue billion Forecast, by Product Type 2020 & 2033
- Table 37: Global Gear Oil Industry Revenue billion Forecast, by End-user Industry 2020 & 2033
- Table 38: Global Gear Oil Industry Revenue billion Forecast, by Country 2020 & 2033
- Table 39: Saudi Arabia Gear Oil Industry Revenue (billion) Forecast, by Application 2020 & 2033
- Table 40: United Arab Emirates Gear Oil Industry Revenue (billion) Forecast, by Application 2020 & 2033
- Table 41: Rest of the Middle East Gear Oil Industry Revenue (billion) Forecast, by Application 2020 & 2033
- Table 42: Global Gear Oil Industry Revenue billion Forecast, by Product Type 2020 & 2033
- Table 43: Global Gear Oil Industry Revenue billion Forecast, by End-user Industry 2020 & 2033
- Table 44: Global Gear Oil Industry Revenue billion Forecast, by Country 2020 & 2033
- Table 45: Egypt Gear Oil Industry Revenue (billion) Forecast, by Application 2020 & 2033
- Table 46: South Africa Gear Oil Industry Revenue (billion) Forecast, by Application 2020 & 2033
- Table 47: Rest of Africa Gear Oil Industry Revenue (billion) Forecast, by Application 2020 & 2033
Frequently Asked Questions
1. What is the projected Compound Annual Growth Rate (CAGR) of the Gear Oil Industry?
The projected CAGR is approximately 2.7%.
2. Which companies are prominent players in the Gear Oil Industry?
Key companies in the market include BP PLC, China Petroleum & Chemical Corporation (Sinopec), Chevron Corporation, ExxonMobil Corporation, FUCHS, Gazprom Neft PJSC, Gulf Oil Corporation Limited, Idemitsu Kosan Co Ltd, Indian Oil Corporation Ltd, JX Nippon Oil & Energy Corporation, Kemipex, Lukoil, Royal Dutch Shell PLC, Total SA*List Not Exhaustive.
3. What are the main segments of the Gear Oil Industry?
The market segments include Product Type, End-user Industry.
4. Can you provide details about the market size?
The market size is estimated to be USD 8.77 billion as of 2022.
5. What are some drivers contributing to market growth?
; Growing Demand from the Wind Energy Sector; Other Drivers.
6. What are the notable trends driving market growth?
Growing Demand from Wind Energy to Increase the Consumption.
7. Are there any restraints impacting market growth?
; Growing Demand from the Wind Energy Sector; Other Drivers.
8. Can you provide examples of recent developments in the market?
N/A
9. What pricing options are available for accessing the report?
Pricing options include single-user, multi-user, and enterprise licenses priced at USD 4750, USD 5250, and USD 8750 respectively.
10. Is the market size provided in terms of value or volume?
The market size is provided in terms of value, measured in billion.
11. Are there any specific market keywords associated with the report?
Yes, the market keyword associated with the report is "Gear Oil Industry," which aids in identifying and referencing the specific market segment covered.
12. How do I determine which pricing option suits my needs best?
The pricing options vary based on user requirements and access needs. Individual users may opt for single-user licenses, while businesses requiring broader access may choose multi-user or enterprise licenses for cost-effective access to the report.
13. Are there any additional resources or data provided in the Gear Oil Industry report?
While the report offers comprehensive insights, it's advisable to review the specific contents or supplementary materials provided to ascertain if additional resources or data are available.
14. How can I stay updated on further developments or reports in the Gear Oil Industry?
To stay informed about further developments, trends, and reports in the Gear Oil Industry, consider subscribing to industry newsletters, following relevant companies and organizations, or regularly checking reputable industry news sources and publications.
Methodology
Step 1 - Identification of Relevant Samples Size from Population Database


Step 2 - Approaches for Defining Global Market Size (Value, Volume* & Price*)

Note*: In applicable scenarios
Step 3 - Data Sources
Primary Research
- Web Analytics
- Survey Reports
- Research Institute
- Latest Research Reports
- Opinion Leaders
Secondary Research
- Annual Reports
- White Paper
- Latest Press Release
- Industry Association
- Paid Database
- Investor Presentations

Step 4 - Data Triangulation
Involves using different sources of information in order to increase the validity of a study
These sources are likely to be stakeholders in a program - participants, other researchers, program staff, other community members, and so on.
Then we put all data in single framework & apply various statistical tools to find out the dynamic on the market.
During the analysis stage, feedback from the stakeholder groups would be compared to determine areas of agreement as well as areas of divergence