Key Insights
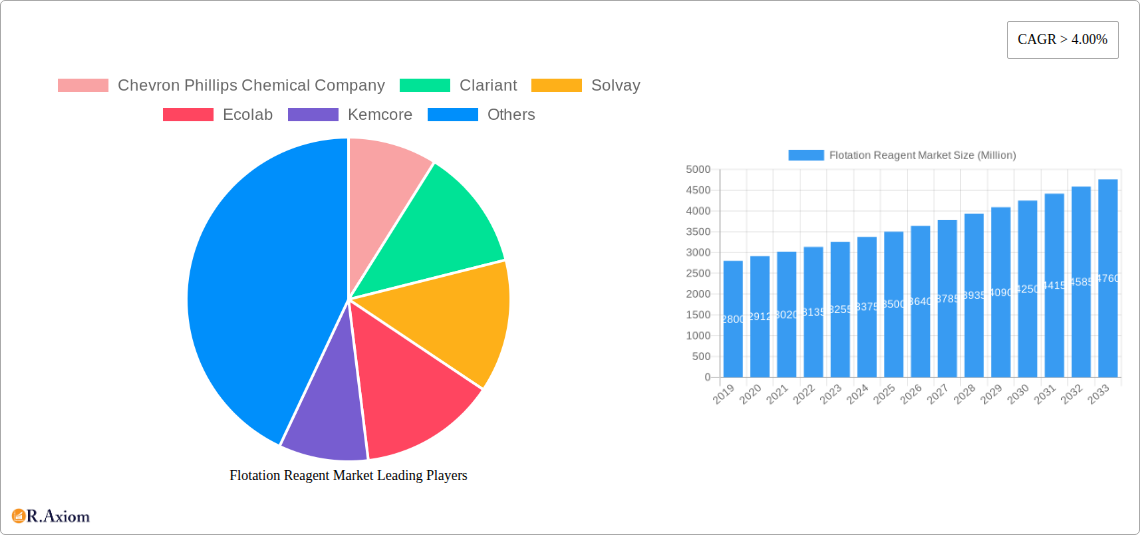
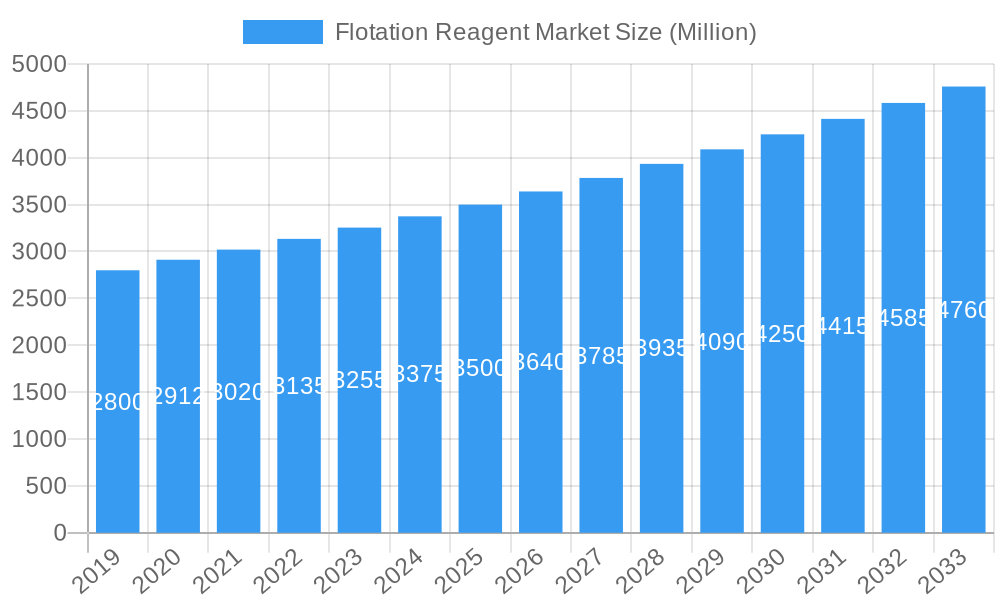
The global Flotation Reagent market is projected for significant expansion, anticipated to reach $6 billion by 2025, exhibiting a Compound Annual Growth Rate (CAGR) of 4.2% between the base year 2025 and 2033. This growth is fueled by escalating demand for minerals vital to renewable energy and infrastructure development, coupled with expanding mining activities and the imperative for efficient mineral extraction of copper, gold, and rare earth elements. The increasing adoption of advanced water and wastewater treatment solutions, where flotation reagents are key to impurity separation, further propels market growth. The "Others" segment, comprising specialized reagents for niche applications, is expected to see substantial advancement driven by evolving mining and processing technologies.
Flotation Reagent Market Market Size (In Billion)
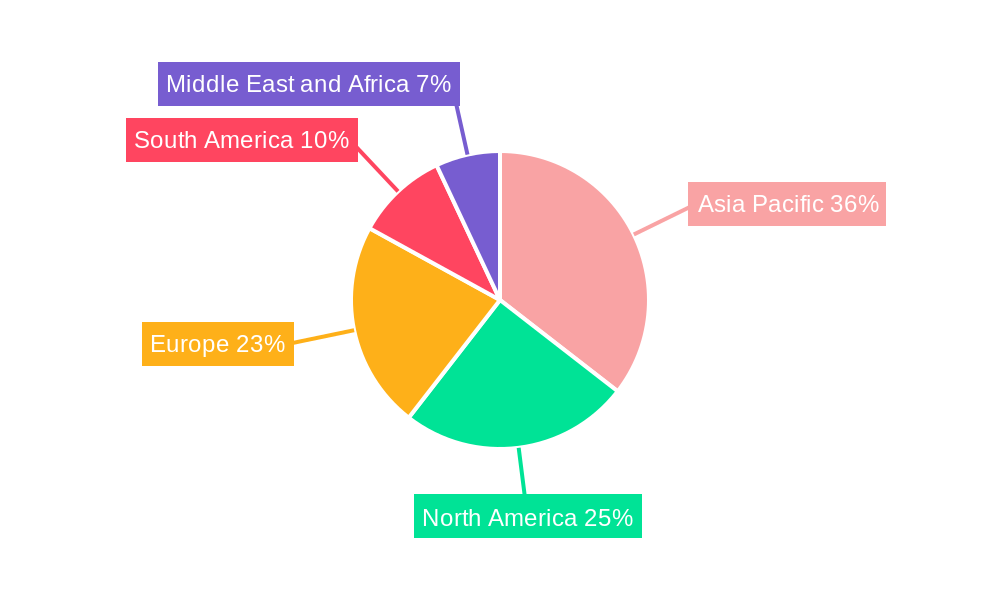
The competitive landscape features key players such as BASF SE, Solvay, Ecolab, and Chevron Phillips Chemical Company, actively investing in R&D for innovative, eco-friendly flotation reagents. Trends include the development of biodegradable and sustainable solutions and the integration of digital technologies for optimized reagent performance. Market challenges include stringent environmental regulations and raw material price volatility. The Asia Pacific region, led by China and India, is expected to lead market share due to extensive mining and industrialization, with North America and Europe also representing substantial markets.
Flotation Reagent Market Company Market Share
This comprehensive market research report analyzes the global Flotation Reagent Market from 2019 to 2024, with 2025 as the base year and a forecast extending to 2033. It provides actionable insights based on market segmentation by type (Collectors, Frothers, Dispersants, Flocculants, Others) and application (Explosives & Drilling, Mineral Processing, Water & Wastewater Treatment, Others). The report covers market concentration, innovation, industry trends, dominant markets, product developments, key drivers, challenges, emerging opportunities, leading players, and significant developments.
Flotation Reagent Market Market Concentration & Innovation
The Flotation Reagent Market exhibits a moderate to high degree of market concentration, with a few key global players holding significant market share. Leading companies such as Chevron Phillips Chemical Company, Clariant, Solvay, Ecolab, Kemcore, BASF SE, Kemira, ArrMaz, IXOM, and Evonik are actively engaged in research and development, driving innovation in reagent formulations. Key innovation drivers include the demand for more efficient and environmentally friendly flotation processes, the need to process increasingly complex ore bodies, and the development of reagents for niche applications. Regulatory frameworks, particularly concerning environmental impact and worker safety, are also shaping innovation strategies, pushing for the adoption of sustainable and biodegradable reagents. Product substitutes, while present in some applications, often lack the specificity and performance of dedicated flotation reagents. End-user trends are leaning towards tailored solutions for specific mineral types and processing conditions, alongside a growing preference for reagents that minimize water consumption and tailings management complexities. Merger and acquisition activities, though not always publicly disclosed with precise deal values, are strategic moves to expand product portfolios, geographical reach, and technological capabilities. For instance, recent M&A activities in the broader specialty chemicals sector indicate a trend towards consolidation aimed at achieving economies of scale and enhanced R&D prowess. The market size for flotation reagents is projected to reach over $20,000 million by 2033.
Flotation Reagent Market Industry Trends & Insights
The Flotation Reagent Market is experiencing robust growth, driven by a confluence of factors. The escalating global demand for essential minerals, fueled by burgeoning populations and industrialization, directly translates to increased mining activities and, consequently, a higher requirement for flotation reagents. The CAGR for the Flotation Reagent Market is estimated at 5.8% during the forecast period. Technological disruptions are playing a pivotal role, with advancements in reagent chemistry leading to the development of highly selective and effective collectors, frothers, and depressants. These innovations allow for the efficient recovery of valuable minerals from low-grade ores and complex mineral assemblages, thereby reducing the environmental footprint of mining operations. Consumer preferences within the end-user industries are increasingly shifting towards sustainable and eco-friendly solutions. This translates to a growing demand for biodegradable flotation reagents, those that minimize chemical toxicity in wastewater, and reagents that improve water recovery and recycling in processing plants. The competitive dynamics within the market are characterized by intense R&D investment, strategic partnerships, and a focus on providing customized solutions to mining operations. Companies are investing heavily in developing novel reagent formulations that offer superior performance, cost-effectiveness, and environmental compliance. Market penetration of advanced flotation reagents is expected to rise significantly as the industry prioritizes efficiency and sustainability. The global market for flotation reagents is projected to be approximately $13,500 million in 2025.
Dominant Markets & Segments in Flotation Reagent Market
The Mineral Processing application segment is unequivocally the dominant force within the Flotation Reagent Market. This dominance is underpinned by the sheer scale of global mining operations, particularly for base metals such as copper, gold, nickel, and platinum group metals, which rely heavily on froth flotation for mineral recovery. Economic policies worldwide, often geared towards resource extraction and export, continue to bolster the mining sector. Significant infrastructure development in emerging economies also facilitates greater access to mineral deposits, further amplifying the demand for flotation reagents.
Key drivers for the dominance of Mineral Processing include:
- Extensive Ore Body Exploitation: The continuous need to extract minerals from vast and often low-grade ore bodies necessitates efficient and cost-effective beneficiation techniques like flotation.
- Technological Advancements in Mining: Innovations in exploration, excavation, and comminution (size reduction) techniques lead to the liberation of more fine particles, which are then effectively recovered through flotation.
- Global Demand for Metals: The insatiable demand for metals in various industries, including automotive, electronics, renewable energy, and construction, drives sustained growth in mineral extraction.
- Environmental Regulations: While driving innovation for greener reagents, stringent environmental regulations also necessitate the use of optimized flotation processes to minimize waste and maximize resource utilization.
Within the Type segmentation, Collectors emerge as the leading segment. Collectors are crucial as they selectively attach to the surface of valuable mineral particles, rendering them hydrophobic and enabling them to attach to air bubbles. The effectiveness of collectors directly impacts the recovery rate and grade of the concentrate. Their widespread application across diverse mineral types, from sulfide ores to oxide minerals, solidifies their leading position. The development of specialized collectors for challenging ore types continues to fuel growth in this segment. The market size of collectors is estimated at over $5,000 million in 2025.
Frothers are another critical component, generating stable froth that carries the mineralized bubbles to the surface. Their widespread use and necessity in almost all flotation circuits contribute to their significant market share. The estimated market size for frothers is over $3,000 million in 2025.
Dispersants, while utilized in specific applications to prevent slime coatings and improve reagent efficiency, hold a smaller but important market share. The market size for dispersants is projected to be over $1,500 million in 2025.
Flocculants, primarily used in water and wastewater treatment and tailings management, also represent a substantial segment, with a projected market size of over $2,000 million in 2025. The increasing focus on water conservation and responsible tailings disposal in the mining industry is a significant growth driver for flocculants.
Geographically, Asia Pacific is anticipated to remain the dominant region due to its robust mining sector, particularly in countries like China, Australia, and Indonesia, which are major producers of various minerals.
Flotation Reagent Market Product Developments
Product developments in the Flotation Reagent Market are characterized by a strong emphasis on enhancing selectivity and environmental sustainability. Companies are actively innovating in collector chemistry, developing reagents that offer superior performance for complex or low-grade ores, thereby improving mineral recovery rates and reducing operational costs. The development of biodegradable frothers and collectors with reduced toxicity is a key trend, driven by stringent environmental regulations and the growing demand for greener mining practices. These advancements not only offer competitive advantages by improving operational efficiency but also align with the industry's commitment to responsible resource management. The market fit for these new products is expanding as mining operations increasingly seek tailored solutions that address specific mineralogical challenges and environmental concerns. The projected market size for "Others" reagents, encompassing specialized additives and performance enhancers, is over $1,000 million in 2025.
Report Scope & Segmentation Analysis
This report provides a comprehensive segmentation of the Flotation Reagent Market. The Type segmentation includes: Collectors, Frothers, Dispersants, Flocculants, and Others. Collectors, estimated at over $5,000 million in 2025, are vital for mineral attachment to air bubbles. Frothers, valued at over $3,000 million in 2025, create stable froth. Dispersants, with a market size over $1,500 million in 2025, prevent particle aggregation. Flocculants, projected at over $2,000 million in 2025, aid in solid-liquid separation. The "Others" category, estimated at over $1,000 million in 2025, encompasses specialized reagents. The Application segmentation includes: Explosives & Drilling, Mineral Processing, Water & Wastewater Treatment, and Others. Mineral Processing, the largest segment, is driven by global mineral demand, with a projected market size of over $10,000 million in 2025. Water & Wastewater Treatment, with a market size over $2,500 million in 2025, is influenced by water scarcity and environmental concerns. Explosives & Drilling, estimated at over $800 million in 2025, sees demand tied to exploration and extraction activities. The "Others" application segment is also analyzed.
Key Drivers of Flotation Reagent Market Growth
The Flotation Reagent Market is propelled by several key drivers. Primarily, the escalating global demand for minerals, driven by industrialization and infrastructure development, directly fuels mining operations and the need for flotation reagents. Technological advancements in reagent formulations, leading to improved selectivity and recovery rates, are crucial. Environmental regulations are a significant driver, pushing for the development and adoption of more sustainable and eco-friendly reagents that minimize toxicity and water consumption. Economic growth in developing nations, leading to increased investment in mining infrastructure and exploration, also contributes significantly to market expansion. Furthermore, the increasing complexity of ore bodies being mined necessitates more sophisticated and specialized flotation chemistries for efficient recovery.
Challenges in the Flotation Reagent Market Sector
Despite robust growth, the Flotation Reagent Market faces several challenges. Stringent and evolving environmental regulations worldwide can pose compliance hurdles and increase R&D costs for developing sustainable alternatives. Fluctuations in raw material prices and availability, particularly for petrochemical-derived reagents, can impact profitability and supply chain stability. The high cost of developing and testing new reagent formulations can be a barrier to entry for smaller players. Furthermore, the potential for reagent antagonism or interference in complex ore processing can necessitate extensive testing and customization, adding to operational complexities. Intense competition among established players and the emergence of new entrants can exert downward pressure on pricing.
Emerging Opportunities in Flotation Reagent Market
The Flotation Reagent Market presents several promising emerging opportunities. The growing focus on circular economy principles and tailings reprocessing offers significant potential for specialized reagents that can recover valuable minerals from waste streams. The development of reagents for extracting critical raw materials, such as rare earth elements and lithium, is a rapidly growing niche. Advancements in digitalization and artificial intelligence are enabling more precise control of flotation processes, creating opportunities for smart reagent delivery systems and optimized formulations. The increasing adoption of sustainable mining practices globally is driving demand for bio-based and biodegradable flotation reagents. Furthermore, the expansion of mining operations in previously underexplored regions presents new market opportunities for reagent suppliers.
Leading Players in the Flotation Reagent Market Market
- Chevron Phillips Chemical Company
- Clariant
- Solvay
- Ecolab
- Kemcore
- BASF SE
- Kemira
- ArrMaz
- IXOM
- Evonik
Key Developments in Flotation Reagent Market Industry
- 2023/06: BASF SE launched a new range of eco-friendly collectors designed to enhance selectivity in copper flotation, addressing growing environmental concerns.
- 2023/04: Kemira announced a strategic partnership with an Australian mining company to optimize their gold flotation circuits using advanced reagent technologies.
- 2022/11: ArrMaz introduced a novel frother formulation that significantly improves froth stability and mineral recovery in challenging processing conditions.
- 2022/09: Clariant expanded its sulfidizing agent portfolio to cater to the increasing demand for processing oxide and mixed sulfide ores.
- 2021/07: IXOM acquired a specialist chemical distributor to strengthen its presence in the South American mining market.
Strategic Outlook for Flotation Reagent Market Market
The strategic outlook for the Flotation Reagent Market remains highly positive, characterized by continued growth driven by fundamental global demand for minerals and ongoing technological innovation. The increasing emphasis on sustainability and environmental responsibility will be a key differentiator, rewarding companies that invest in greener chemistries and processes. Strategic partnerships and collaborations will be crucial for market players to access new technologies, expand their geographical reach, and offer comprehensive solutions to mining operations. The market will likely see further consolidation as companies seek to achieve economies of scale and broaden their product portfolios. The development of reagents for niche and emerging mineral commodities, alongside advancements in digital integration for process optimization, will shape the future landscape of the Flotation Reagent Market. The estimated total market value is projected to exceed $20,000 million by 2033.
Flotation Reagent Market Segmentation
-
1. Type
- 1.1. Collectors
- 1.2. Frothers
- 1.3. Dispersants
- 1.4. Flocculants
- 1.5. Others
-
2. Application
- 2.1. Explosives & Drilling
- 2.2. Mineral Processing
- 2.3. Water & Wastewater Treatment
- 2.4. Others
Flotation Reagent Market Segmentation By Geography
-
1. Asia Pacific
- 1.1. China
- 1.2. India
- 1.3. Japan
- 1.4. South Korea
- 1.5. Rest of Asia Pacific
-
2. North America
- 2.1. United States
- 2.2. Canada
- 2.3. Mexico
-
3. Europe
- 3.1. Germany
- 3.2. United Kingdom
- 3.3. France
- 3.4. Italy
- 3.5. Rest of Europe
-
4. South America
- 4.1. Brazil
- 4.2. Argentina
- 4.3. Rest of South America
-
5. Middle East and Africa
- 5.1. Saudi Arabia
- 5.2. South Africa
- 5.3. Rest of Middle East and Africa
Flotation Reagent Market Regional Market Share
Geographic Coverage of Flotation Reagent Market
Flotation Reagent Market REPORT HIGHLIGHTS
| Aspects | Details |
|---|---|
| Study Period | 2020-2034 |
| Base Year | 2025 |
| Estimated Year | 2026 |
| Forecast Period | 2026-2034 |
| Historical Period | 2020-2025 |
| Growth Rate | CAGR of 4.2% from 2020-2034 |
| Segmentation |
|
Table of Contents
- 1. Introduction
- 1.1. Research Scope
- 1.2. Market Segmentation
- 1.3. Research Objective
- 1.4. Definitions and Assumptions
- 2. Executive Summary
- 2.1. Market Snapshot
- 3. Market Dynamics
- 3.1. Market Drivers
- 3.2. Market Restrains
- 3.3. Market Trends
- 3.4. Market Opportunities
- 4. Market Factor Analysis
- 4.1. Porters Five Forces
- 4.1.1. Bargaining Power of Suppliers
- 4.1.2. Bargaining Power of Buyers
- 4.1.3. Threat of New Entrants
- 4.1.4. Threat of Substitutes
- 4.1.5. Competitive Rivalry
- 4.2. PESTEL analysis
- 4.3. BCG Analysis
- 4.3.1. Stars (High Growth, High Market Share)
- 4.3.2. Cash Cows (Low Growth, High Market Share)
- 4.3.3. Question Mark (High Growth, Low Market Share)
- 4.3.4. Dogs (Low Growth, Low Market Share)
- 4.4. Ansoff Matrix Analysis
- 4.5. Supply Chain Analysis
- 4.6. Regulatory Landscape
- 4.7. Current Market Potential and Opportunity Assessment (TAM–SAM–SOM Framework)
- 4.8. RAX Analyst Note
- 4.1. Porters Five Forces
- 5. Market Analysis, Insights and Forecast 2021-2033
- 5.1. Market Analysis, Insights and Forecast - by Type
- 5.1.1. Collectors
- 5.1.2. Frothers
- 5.1.3. Dispersants
- 5.1.4. Flocculants
- 5.1.5. Others
- 5.2. Market Analysis, Insights and Forecast - by Application
- 5.2.1. Explosives & Drilling
- 5.2.2. Mineral Processing
- 5.2.3. Water & Wastewater Treatment
- 5.2.4. Others
- 5.3. Market Analysis, Insights and Forecast - by Region
- 5.3.1. Asia Pacific
- 5.3.2. North America
- 5.3.3. Europe
- 5.3.4. South America
- 5.3.5. Middle East and Africa
- 5.1. Market Analysis, Insights and Forecast - by Type
- 6. Global Flotation Reagent Market Analysis, Insights and Forecast, 2021-2033
- 6.1. Market Analysis, Insights and Forecast - by Type
- 6.1.1. Collectors
- 6.1.2. Frothers
- 6.1.3. Dispersants
- 6.1.4. Flocculants
- 6.1.5. Others
- 6.2. Market Analysis, Insights and Forecast - by Application
- 6.2.1. Explosives & Drilling
- 6.2.2. Mineral Processing
- 6.2.3. Water & Wastewater Treatment
- 6.2.4. Others
- 6.1. Market Analysis, Insights and Forecast - by Type
- 7. Asia Pacific Flotation Reagent Market Analysis, Insights and Forecast, 2020-2032
- 7.1. Market Analysis, Insights and Forecast - by Type
- 7.1.1. Collectors
- 7.1.2. Frothers
- 7.1.3. Dispersants
- 7.1.4. Flocculants
- 7.1.5. Others
- 7.2. Market Analysis, Insights and Forecast - by Application
- 7.2.1. Explosives & Drilling
- 7.2.2. Mineral Processing
- 7.2.3. Water & Wastewater Treatment
- 7.2.4. Others
- 7.1. Market Analysis, Insights and Forecast - by Type
- 8. North America Flotation Reagent Market Analysis, Insights and Forecast, 2020-2032
- 8.1. Market Analysis, Insights and Forecast - by Type
- 8.1.1. Collectors
- 8.1.2. Frothers
- 8.1.3. Dispersants
- 8.1.4. Flocculants
- 8.1.5. Others
- 8.2. Market Analysis, Insights and Forecast - by Application
- 8.2.1. Explosives & Drilling
- 8.2.2. Mineral Processing
- 8.2.3. Water & Wastewater Treatment
- 8.2.4. Others
- 8.1. Market Analysis, Insights and Forecast - by Type
- 9. Europe Flotation Reagent Market Analysis, Insights and Forecast, 2020-2032
- 9.1. Market Analysis, Insights and Forecast - by Type
- 9.1.1. Collectors
- 9.1.2. Frothers
- 9.1.3. Dispersants
- 9.1.4. Flocculants
- 9.1.5. Others
- 9.2. Market Analysis, Insights and Forecast - by Application
- 9.2.1. Explosives & Drilling
- 9.2.2. Mineral Processing
- 9.2.3. Water & Wastewater Treatment
- 9.2.4. Others
- 9.1. Market Analysis, Insights and Forecast - by Type
- 10. South America Flotation Reagent Market Analysis, Insights and Forecast, 2020-2032
- 10.1. Market Analysis, Insights and Forecast - by Type
- 10.1.1. Collectors
- 10.1.2. Frothers
- 10.1.3. Dispersants
- 10.1.4. Flocculants
- 10.1.5. Others
- 10.2. Market Analysis, Insights and Forecast - by Application
- 10.2.1. Explosives & Drilling
- 10.2.2. Mineral Processing
- 10.2.3. Water & Wastewater Treatment
- 10.2.4. Others
- 10.1. Market Analysis, Insights and Forecast - by Type
- 11. Middle East and Africa Flotation Reagent Market Analysis, Insights and Forecast, 2020-2032
- 11.1. Market Analysis, Insights and Forecast - by Type
- 11.1.1. Collectors
- 11.1.2. Frothers
- 11.1.3. Dispersants
- 11.1.4. Flocculants
- 11.1.5. Others
- 11.2. Market Analysis, Insights and Forecast - by Application
- 11.2.1. Explosives & Drilling
- 11.2.2. Mineral Processing
- 11.2.3. Water & Wastewater Treatment
- 11.2.4. Others
- 11.1. Market Analysis, Insights and Forecast - by Type
- 12. Competitive Analysis
- 12.1. Company Profiles
- 12.1.1 Chevron Phillips Chemical Company
- 12.1.1.1. Company Overview
- 12.1.1.2. Products
- 12.1.1.3. Company Financials
- 12.1.1.4. SWOT Analysis
- 12.1.2 Clariant
- 12.1.2.1. Company Overview
- 12.1.2.2. Products
- 12.1.2.3. Company Financials
- 12.1.2.4. SWOT Analysis
- 12.1.3 Solvay
- 12.1.3.1. Company Overview
- 12.1.3.2. Products
- 12.1.3.3. Company Financials
- 12.1.3.4. SWOT Analysis
- 12.1.4 Ecolab
- 12.1.4.1. Company Overview
- 12.1.4.2. Products
- 12.1.4.3. Company Financials
- 12.1.4.4. SWOT Analysis
- 12.1.5 Kemcore
- 12.1.5.1. Company Overview
- 12.1.5.2. Products
- 12.1.5.3. Company Financials
- 12.1.5.4. SWOT Analysis
- 12.1.6 BASF SE
- 12.1.6.1. Company Overview
- 12.1.6.2. Products
- 12.1.6.3. Company Financials
- 12.1.6.4. SWOT Analysis
- 12.1.7 Kemira
- 12.1.7.1. Company Overview
- 12.1.7.2. Products
- 12.1.7.3. Company Financials
- 12.1.7.4. SWOT Analysis
- 12.1.8 ArrMaz
- 12.1.8.1. Company Overview
- 12.1.8.2. Products
- 12.1.8.3. Company Financials
- 12.1.8.4. SWOT Analysis
- 12.1.9 IXOM
- 12.1.9.1. Company Overview
- 12.1.9.2. Products
- 12.1.9.3. Company Financials
- 12.1.9.4. SWOT Analysis
- 12.1.10 Evonik
- 12.1.10.1. Company Overview
- 12.1.10.2. Products
- 12.1.10.3. Company Financials
- 12.1.10.4. SWOT Analysis
- 12.1.1 Chevron Phillips Chemical Company
- 12.2. Market Entropy
- 12.2.1 Company's Key Areas Served
- 12.2.2 Recent Developments
- 12.3. Company Market Share Analysis 2025
- 12.3.1 Top 5 Companies Market Share Analysis
- 12.3.2 Top 3 Companies Market Share Analysis
- 12.4. List of Potential Customers
- 13. Research Methodology
List of Figures
- Figure 1: Global Flotation Reagent Market Revenue Breakdown (billion, %) by Region 2025 & 2033
- Figure 2: Global Flotation Reagent Market Volume Breakdown (K Tons, %) by Region 2025 & 2033
- Figure 3: Asia Pacific Flotation Reagent Market Revenue (billion), by Type 2025 & 2033
- Figure 4: Asia Pacific Flotation Reagent Market Volume (K Tons), by Type 2025 & 2033
- Figure 5: Asia Pacific Flotation Reagent Market Revenue Share (%), by Type 2025 & 2033
- Figure 6: Asia Pacific Flotation Reagent Market Volume Share (%), by Type 2025 & 2033
- Figure 7: Asia Pacific Flotation Reagent Market Revenue (billion), by Application 2025 & 2033
- Figure 8: Asia Pacific Flotation Reagent Market Volume (K Tons), by Application 2025 & 2033
- Figure 9: Asia Pacific Flotation Reagent Market Revenue Share (%), by Application 2025 & 2033
- Figure 10: Asia Pacific Flotation Reagent Market Volume Share (%), by Application 2025 & 2033
- Figure 11: Asia Pacific Flotation Reagent Market Revenue (billion), by Country 2025 & 2033
- Figure 12: Asia Pacific Flotation Reagent Market Volume (K Tons), by Country 2025 & 2033
- Figure 13: Asia Pacific Flotation Reagent Market Revenue Share (%), by Country 2025 & 2033
- Figure 14: Asia Pacific Flotation Reagent Market Volume Share (%), by Country 2025 & 2033
- Figure 15: North America Flotation Reagent Market Revenue (billion), by Type 2025 & 2033
- Figure 16: North America Flotation Reagent Market Volume (K Tons), by Type 2025 & 2033
- Figure 17: North America Flotation Reagent Market Revenue Share (%), by Type 2025 & 2033
- Figure 18: North America Flotation Reagent Market Volume Share (%), by Type 2025 & 2033
- Figure 19: North America Flotation Reagent Market Revenue (billion), by Application 2025 & 2033
- Figure 20: North America Flotation Reagent Market Volume (K Tons), by Application 2025 & 2033
- Figure 21: North America Flotation Reagent Market Revenue Share (%), by Application 2025 & 2033
- Figure 22: North America Flotation Reagent Market Volume Share (%), by Application 2025 & 2033
- Figure 23: North America Flotation Reagent Market Revenue (billion), by Country 2025 & 2033
- Figure 24: North America Flotation Reagent Market Volume (K Tons), by Country 2025 & 2033
- Figure 25: North America Flotation Reagent Market Revenue Share (%), by Country 2025 & 2033
- Figure 26: North America Flotation Reagent Market Volume Share (%), by Country 2025 & 2033
- Figure 27: Europe Flotation Reagent Market Revenue (billion), by Type 2025 & 2033
- Figure 28: Europe Flotation Reagent Market Volume (K Tons), by Type 2025 & 2033
- Figure 29: Europe Flotation Reagent Market Revenue Share (%), by Type 2025 & 2033
- Figure 30: Europe Flotation Reagent Market Volume Share (%), by Type 2025 & 2033
- Figure 31: Europe Flotation Reagent Market Revenue (billion), by Application 2025 & 2033
- Figure 32: Europe Flotation Reagent Market Volume (K Tons), by Application 2025 & 2033
- Figure 33: Europe Flotation Reagent Market Revenue Share (%), by Application 2025 & 2033
- Figure 34: Europe Flotation Reagent Market Volume Share (%), by Application 2025 & 2033
- Figure 35: Europe Flotation Reagent Market Revenue (billion), by Country 2025 & 2033
- Figure 36: Europe Flotation Reagent Market Volume (K Tons), by Country 2025 & 2033
- Figure 37: Europe Flotation Reagent Market Revenue Share (%), by Country 2025 & 2033
- Figure 38: Europe Flotation Reagent Market Volume Share (%), by Country 2025 & 2033
- Figure 39: South America Flotation Reagent Market Revenue (billion), by Type 2025 & 2033
- Figure 40: South America Flotation Reagent Market Volume (K Tons), by Type 2025 & 2033
- Figure 41: South America Flotation Reagent Market Revenue Share (%), by Type 2025 & 2033
- Figure 42: South America Flotation Reagent Market Volume Share (%), by Type 2025 & 2033
- Figure 43: South America Flotation Reagent Market Revenue (billion), by Application 2025 & 2033
- Figure 44: South America Flotation Reagent Market Volume (K Tons), by Application 2025 & 2033
- Figure 45: South America Flotation Reagent Market Revenue Share (%), by Application 2025 & 2033
- Figure 46: South America Flotation Reagent Market Volume Share (%), by Application 2025 & 2033
- Figure 47: South America Flotation Reagent Market Revenue (billion), by Country 2025 & 2033
- Figure 48: South America Flotation Reagent Market Volume (K Tons), by Country 2025 & 2033
- Figure 49: South America Flotation Reagent Market Revenue Share (%), by Country 2025 & 2033
- Figure 50: South America Flotation Reagent Market Volume Share (%), by Country 2025 & 2033
- Figure 51: Middle East and Africa Flotation Reagent Market Revenue (billion), by Type 2025 & 2033
- Figure 52: Middle East and Africa Flotation Reagent Market Volume (K Tons), by Type 2025 & 2033
- Figure 53: Middle East and Africa Flotation Reagent Market Revenue Share (%), by Type 2025 & 2033
- Figure 54: Middle East and Africa Flotation Reagent Market Volume Share (%), by Type 2025 & 2033
- Figure 55: Middle East and Africa Flotation Reagent Market Revenue (billion), by Application 2025 & 2033
- Figure 56: Middle East and Africa Flotation Reagent Market Volume (K Tons), by Application 2025 & 2033
- Figure 57: Middle East and Africa Flotation Reagent Market Revenue Share (%), by Application 2025 & 2033
- Figure 58: Middle East and Africa Flotation Reagent Market Volume Share (%), by Application 2025 & 2033
- Figure 59: Middle East and Africa Flotation Reagent Market Revenue (billion), by Country 2025 & 2033
- Figure 60: Middle East and Africa Flotation Reagent Market Volume (K Tons), by Country 2025 & 2033
- Figure 61: Middle East and Africa Flotation Reagent Market Revenue Share (%), by Country 2025 & 2033
- Figure 62: Middle East and Africa Flotation Reagent Market Volume Share (%), by Country 2025 & 2033
List of Tables
- Table 1: Global Flotation Reagent Market Revenue billion Forecast, by Type 2020 & 2033
- Table 2: Global Flotation Reagent Market Volume K Tons Forecast, by Type 2020 & 2033
- Table 3: Global Flotation Reagent Market Revenue billion Forecast, by Application 2020 & 2033
- Table 4: Global Flotation Reagent Market Volume K Tons Forecast, by Application 2020 & 2033
- Table 5: Global Flotation Reagent Market Revenue billion Forecast, by Region 2020 & 2033
- Table 6: Global Flotation Reagent Market Volume K Tons Forecast, by Region 2020 & 2033
- Table 7: Global Flotation Reagent Market Revenue billion Forecast, by Type 2020 & 2033
- Table 8: Global Flotation Reagent Market Volume K Tons Forecast, by Type 2020 & 2033
- Table 9: Global Flotation Reagent Market Revenue billion Forecast, by Application 2020 & 2033
- Table 10: Global Flotation Reagent Market Volume K Tons Forecast, by Application 2020 & 2033
- Table 11: Global Flotation Reagent Market Revenue billion Forecast, by Country 2020 & 2033
- Table 12: Global Flotation Reagent Market Volume K Tons Forecast, by Country 2020 & 2033
- Table 13: China Flotation Reagent Market Revenue (billion) Forecast, by Application 2020 & 2033
- Table 14: China Flotation Reagent Market Volume (K Tons) Forecast, by Application 2020 & 2033
- Table 15: India Flotation Reagent Market Revenue (billion) Forecast, by Application 2020 & 2033
- Table 16: India Flotation Reagent Market Volume (K Tons) Forecast, by Application 2020 & 2033
- Table 17: Japan Flotation Reagent Market Revenue (billion) Forecast, by Application 2020 & 2033
- Table 18: Japan Flotation Reagent Market Volume (K Tons) Forecast, by Application 2020 & 2033
- Table 19: South Korea Flotation Reagent Market Revenue (billion) Forecast, by Application 2020 & 2033
- Table 20: South Korea Flotation Reagent Market Volume (K Tons) Forecast, by Application 2020 & 2033
- Table 21: Rest of Asia Pacific Flotation Reagent Market Revenue (billion) Forecast, by Application 2020 & 2033
- Table 22: Rest of Asia Pacific Flotation Reagent Market Volume (K Tons) Forecast, by Application 2020 & 2033
- Table 23: Global Flotation Reagent Market Revenue billion Forecast, by Type 2020 & 2033
- Table 24: Global Flotation Reagent Market Volume K Tons Forecast, by Type 2020 & 2033
- Table 25: Global Flotation Reagent Market Revenue billion Forecast, by Application 2020 & 2033
- Table 26: Global Flotation Reagent Market Volume K Tons Forecast, by Application 2020 & 2033
- Table 27: Global Flotation Reagent Market Revenue billion Forecast, by Country 2020 & 2033
- Table 28: Global Flotation Reagent Market Volume K Tons Forecast, by Country 2020 & 2033
- Table 29: United States Flotation Reagent Market Revenue (billion) Forecast, by Application 2020 & 2033
- Table 30: United States Flotation Reagent Market Volume (K Tons) Forecast, by Application 2020 & 2033
- Table 31: Canada Flotation Reagent Market Revenue (billion) Forecast, by Application 2020 & 2033
- Table 32: Canada Flotation Reagent Market Volume (K Tons) Forecast, by Application 2020 & 2033
- Table 33: Mexico Flotation Reagent Market Revenue (billion) Forecast, by Application 2020 & 2033
- Table 34: Mexico Flotation Reagent Market Volume (K Tons) Forecast, by Application 2020 & 2033
- Table 35: Global Flotation Reagent Market Revenue billion Forecast, by Type 2020 & 2033
- Table 36: Global Flotation Reagent Market Volume K Tons Forecast, by Type 2020 & 2033
- Table 37: Global Flotation Reagent Market Revenue billion Forecast, by Application 2020 & 2033
- Table 38: Global Flotation Reagent Market Volume K Tons Forecast, by Application 2020 & 2033
- Table 39: Global Flotation Reagent Market Revenue billion Forecast, by Country 2020 & 2033
- Table 40: Global Flotation Reagent Market Volume K Tons Forecast, by Country 2020 & 2033
- Table 41: Germany Flotation Reagent Market Revenue (billion) Forecast, by Application 2020 & 2033
- Table 42: Germany Flotation Reagent Market Volume (K Tons) Forecast, by Application 2020 & 2033
- Table 43: United Kingdom Flotation Reagent Market Revenue (billion) Forecast, by Application 2020 & 2033
- Table 44: United Kingdom Flotation Reagent Market Volume (K Tons) Forecast, by Application 2020 & 2033
- Table 45: France Flotation Reagent Market Revenue (billion) Forecast, by Application 2020 & 2033
- Table 46: France Flotation Reagent Market Volume (K Tons) Forecast, by Application 2020 & 2033
- Table 47: Italy Flotation Reagent Market Revenue (billion) Forecast, by Application 2020 & 2033
- Table 48: Italy Flotation Reagent Market Volume (K Tons) Forecast, by Application 2020 & 2033
- Table 49: Rest of Europe Flotation Reagent Market Revenue (billion) Forecast, by Application 2020 & 2033
- Table 50: Rest of Europe Flotation Reagent Market Volume (K Tons) Forecast, by Application 2020 & 2033
- Table 51: Global Flotation Reagent Market Revenue billion Forecast, by Type 2020 & 2033
- Table 52: Global Flotation Reagent Market Volume K Tons Forecast, by Type 2020 & 2033
- Table 53: Global Flotation Reagent Market Revenue billion Forecast, by Application 2020 & 2033
- Table 54: Global Flotation Reagent Market Volume K Tons Forecast, by Application 2020 & 2033
- Table 55: Global Flotation Reagent Market Revenue billion Forecast, by Country 2020 & 2033
- Table 56: Global Flotation Reagent Market Volume K Tons Forecast, by Country 2020 & 2033
- Table 57: Brazil Flotation Reagent Market Revenue (billion) Forecast, by Application 2020 & 2033
- Table 58: Brazil Flotation Reagent Market Volume (K Tons) Forecast, by Application 2020 & 2033
- Table 59: Argentina Flotation Reagent Market Revenue (billion) Forecast, by Application 2020 & 2033
- Table 60: Argentina Flotation Reagent Market Volume (K Tons) Forecast, by Application 2020 & 2033
- Table 61: Rest of South America Flotation Reagent Market Revenue (billion) Forecast, by Application 2020 & 2033
- Table 62: Rest of South America Flotation Reagent Market Volume (K Tons) Forecast, by Application 2020 & 2033
- Table 63: Global Flotation Reagent Market Revenue billion Forecast, by Type 2020 & 2033
- Table 64: Global Flotation Reagent Market Volume K Tons Forecast, by Type 2020 & 2033
- Table 65: Global Flotation Reagent Market Revenue billion Forecast, by Application 2020 & 2033
- Table 66: Global Flotation Reagent Market Volume K Tons Forecast, by Application 2020 & 2033
- Table 67: Global Flotation Reagent Market Revenue billion Forecast, by Country 2020 & 2033
- Table 68: Global Flotation Reagent Market Volume K Tons Forecast, by Country 2020 & 2033
- Table 69: Saudi Arabia Flotation Reagent Market Revenue (billion) Forecast, by Application 2020 & 2033
- Table 70: Saudi Arabia Flotation Reagent Market Volume (K Tons) Forecast, by Application 2020 & 2033
- Table 71: South Africa Flotation Reagent Market Revenue (billion) Forecast, by Application 2020 & 2033
- Table 72: South Africa Flotation Reagent Market Volume (K Tons) Forecast, by Application 2020 & 2033
- Table 73: Rest of Middle East and Africa Flotation Reagent Market Revenue (billion) Forecast, by Application 2020 & 2033
- Table 74: Rest of Middle East and Africa Flotation Reagent Market Volume (K Tons) Forecast, by Application 2020 & 2033
Frequently Asked Questions
1. What is the projected Compound Annual Growth Rate (CAGR) of the Flotation Reagent Market?
The projected CAGR is approximately 4.2%.
2. Which companies are prominent players in the Flotation Reagent Market?
Key companies in the market include Chevron Phillips Chemical Company, Clariant, Solvay, Ecolab, Kemcore, BASF SE, Kemira, ArrMaz, IXOM, Evonik.
3. What are the main segments of the Flotation Reagent Market?
The market segments include Type, Application.
4. Can you provide details about the market size?
The market size is estimated to be USD 6 billion as of 2022.
5. What are some drivers contributing to market growth?
; Growing Demand from Water & Wastewater Treatment Industry 4.1.2 increasing applications in Mining Industry.
6. What are the notable trends driving market growth?
Water & Wastewater Treatment Segment to Uplift Flotation Reagent Market.
7. Are there any restraints impacting market growth?
; Unfavourable Conditions due to COVID-19 Outbreak; Other Restraints.
8. Can you provide examples of recent developments in the market?
N/A
9. What pricing options are available for accessing the report?
Pricing options include single-user, multi-user, and enterprise licenses priced at USD 4750, USD 5250, and USD 8750 respectively.
10. Is the market size provided in terms of value or volume?
The market size is provided in terms of value, measured in billion and volume, measured in K Tons.
11. Are there any specific market keywords associated with the report?
Yes, the market keyword associated with the report is "Flotation Reagent Market," which aids in identifying and referencing the specific market segment covered.
12. How do I determine which pricing option suits my needs best?
The pricing options vary based on user requirements and access needs. Individual users may opt for single-user licenses, while businesses requiring broader access may choose multi-user or enterprise licenses for cost-effective access to the report.
13. Are there any additional resources or data provided in the Flotation Reagent Market report?
While the report offers comprehensive insights, it's advisable to review the specific contents or supplementary materials provided to ascertain if additional resources or data are available.
14. How can I stay updated on further developments or reports in the Flotation Reagent Market?
To stay informed about further developments, trends, and reports in the Flotation Reagent Market, consider subscribing to industry newsletters, following relevant companies and organizations, or regularly checking reputable industry news sources and publications.
Methodology
Step 1 - Identification of Relevant Samples Size from Population Database


Step 2 - Approaches for Defining Global Market Size (Value, Volume* & Price*)

Note*: In applicable scenarios
Step 3 - Data Sources
Primary Research
- Web Analytics
- Survey Reports
- Research Institute
- Latest Research Reports
- Opinion Leaders
Secondary Research
- Annual Reports
- White Paper
- Latest Press Release
- Industry Association
- Paid Database
- Investor Presentations

Step 4 - Data Triangulation
Involves using different sources of information in order to increase the validity of a study
These sources are likely to be stakeholders in a program - participants, other researchers, program staff, other community members, and so on.
Then we put all data in single framework & apply various statistical tools to find out the dynamic on the market.
During the analysis stage, feedback from the stakeholder groups would be compared to determine areas of agreement as well as areas of divergence

