
Key Insights
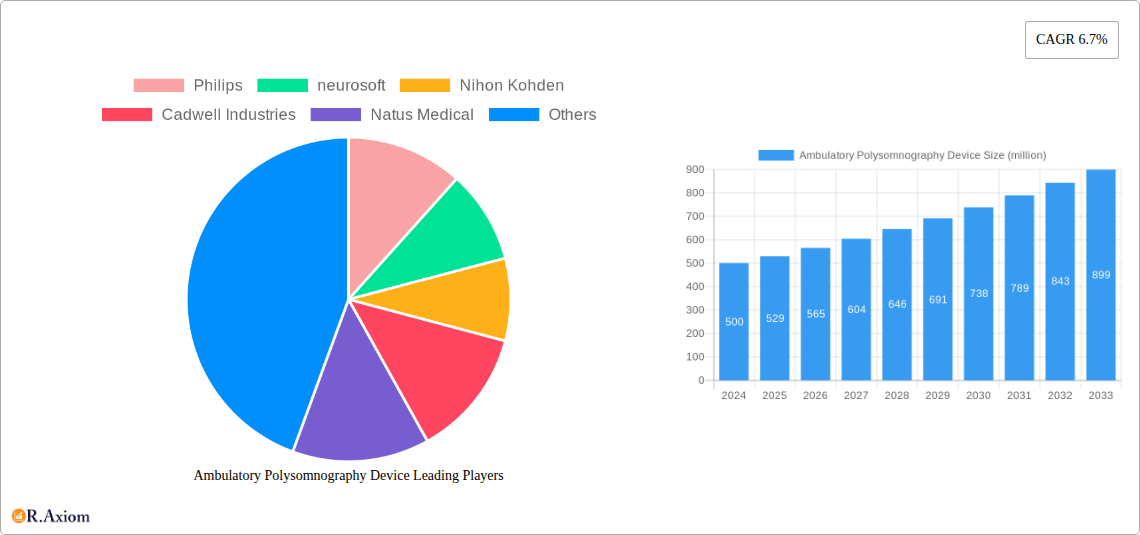
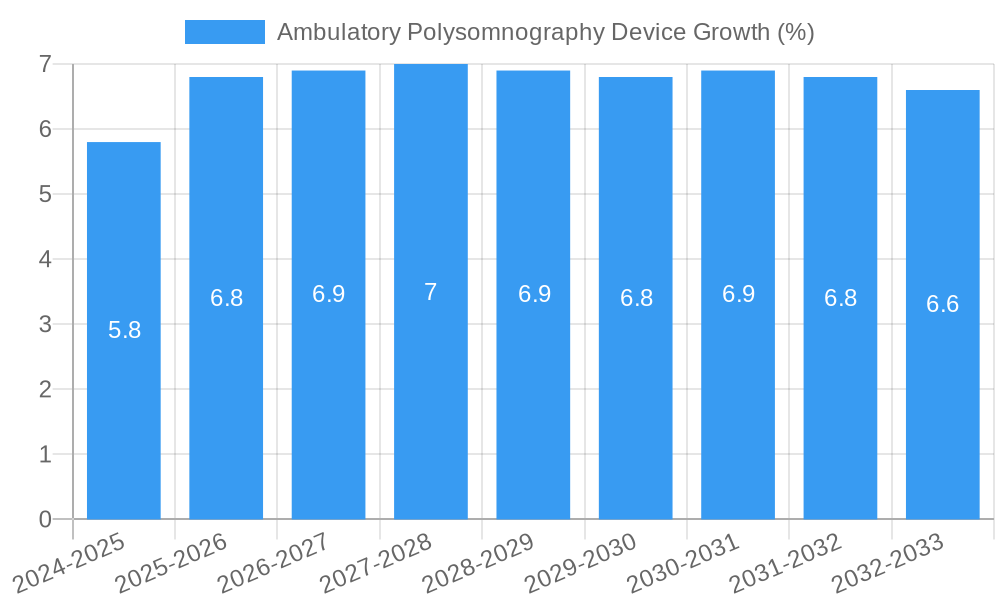
The global Ambulatory Polysomnography Device market is poised for substantial growth, projected to reach $529 million in 2025 with a Compound Annual Growth Rate (CAGR) of 6.7% through 2033. This robust expansion is primarily driven by the increasing prevalence of sleep disorders, such as sleep apnea, insomnia, and restless legs syndrome, which are significantly impacting public health worldwide. Growing awareness among both patients and healthcare professionals regarding the importance of early diagnosis and effective management of these conditions fuels the demand for advanced, home-based monitoring solutions. The shift towards patient-centric healthcare and the convenience offered by portable polysomnography devices, which allow for sleep studies to be conducted in the comfort of a patient's home, further accelerate market penetration. Technological advancements, including the development of smaller, lighter, and more user-friendly devices with enhanced data accuracy and wireless connectivity, are also key contributors to this positive market trajectory.
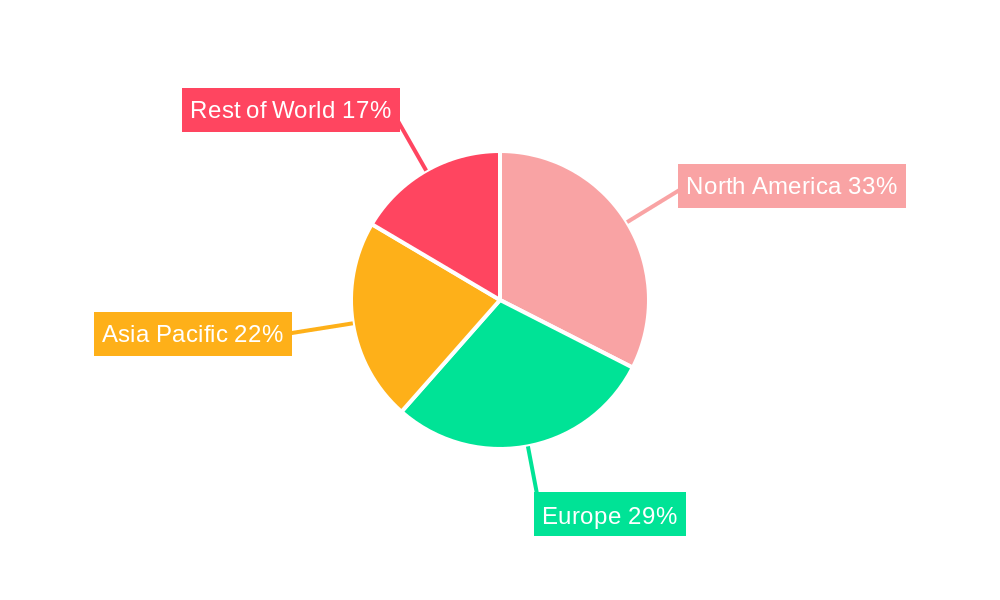
The market is segmented by application into Hospitals, Sleep Laboratories, and Other, with Hospitals and Sleep Laboratories expected to hold the dominant share due to established diagnostic infrastructure and physician preference. The "Type" segmentation includes Fixed and Portable devices, with a clear trend favoring portable solutions owing to their cost-effectiveness and patient compliance. Key players like Philips, Neurosoft, and Nihon Kohden are investing heavily in research and development to innovate and expand their product portfolios, catering to diverse market needs. Geographically, North America and Europe are expected to lead the market due to high healthcare expenditure, advanced technological adoption, and a well-established reimbursement framework for sleep studies. However, the Asia Pacific region is anticipated to witness the fastest growth, driven by increasing disposable incomes, rising healthcare awareness, and a large, underserved patient population actively seeking diagnosis and treatment for sleep disorders.
This in-depth market research report provides an exhaustive analysis of the global Ambulatory Polysomnography Device market, offering critical insights for industry stakeholders. Spanning the Study Period of 2019–2033, with a Base Year of 2025 and an Estimated Year also of 2025, the report meticulously forecasts market trajectory throughout the Forecast Period of 2025–2033, building upon the Historical Period of 2019–2024. We delve into market dynamics, technological advancements, competitive landscapes, and emerging opportunities within this vital segment of sleep disorder diagnosis.
Ambulatory Polysomnography Device Market Concentration & Innovation
The Ambulatory Polysomnography Device market exhibits a moderate level of concentration, with key players like Philips, Neurosoft, Nihon Kohden, Cadwell Industries, Natus Medical, Compumedics Limited, Compumedics, SOMNOmedics, Nox Medical, and Löwenstein Medical Technology holding significant market share. Innovation is a primary driver, fueled by the increasing prevalence of sleep disorders and the demand for more accurate, portable, and user-friendly diagnostic solutions. Regulatory frameworks, such as those established by the FDA and EMA, play a crucial role in shaping product development and market access. While direct product substitutes are limited, alternative diagnostic methods for sleep disorders represent an indirect competitive threat. End-user trends are shifting towards home-based monitoring, driving the demand for portable devices. Mergers and acquisitions (M&A) have been strategic for consolidation and expansion, with estimated deal values in the hundreds of millions annually during the historical period, contributing to market reshaping. The market share distribution among the top five players is approximately 65 million.
Ambulatory Polysomnography Device Industry Trends & Insights
The Ambulatory Polysomnography Device market is poised for significant expansion, driven by a confluence of factors. The escalating global prevalence of sleep disorders, including sleep apnea, insomnia, and restless legs syndrome, coupled with a growing awareness among patients and healthcare providers, is a primary growth catalyst. Technological advancements are revolutionizing the field, with a strong emphasis on developing wireless, miniaturized, and AI-integrated devices that offer enhanced patient comfort and data accuracy. The increasing adoption of remote patient monitoring and telehealth services further accelerates the demand for ambulatory polysomnography solutions, enabling diagnosis outside traditional hospital settings. Consumer preferences are increasingly leaning towards home sleep testing (HST) due to convenience, cost-effectiveness, and reduced patient anxiety. This shift necessitates devices that are intuitive for patient use and provide high-quality, actionable data for remote interpretation. Competitive dynamics are characterized by a blend of established giants and agile innovators, all striving to capture market share through product differentiation, strategic partnerships, and global market penetration. The Compound Annual Growth Rate (CAGR) is projected to be approximately 12.5% during the forecast period. Market penetration is currently around 30 million units sold annually, with an expected rise to over 70 million units by the end of the forecast period.
Dominant Markets & Segments in Ambulatory Polysomnography Device
The global Ambulatory Polysomnography Device market is dominated by North America, particularly the United States, driven by high healthcare expenditure, widespread adoption of advanced medical technologies, and a high prevalence of sleep disorders. Economic policies in the region favor technological innovation and reimbursement for sleep disorder diagnostics, further bolstering market growth. The Asia Pacific region is emerging as a significant growth pocket, propelled by a burgeoning middle class, increasing healthcare awareness, and government initiatives to improve healthcare infrastructure.
Application Dominance: Sleep Laboratories currently represent the largest application segment, accounting for approximately 55% of the market share, due to their specialized infrastructure and expertise in sleep disorder diagnosis. However, Hospitals are rapidly gaining traction, with an estimated 35% market share, as they increasingly integrate sleep studies into their comprehensive patient care offerings. The "Other" segment, encompassing home healthcare providers and research institutions, holds the remaining 10% but is expected to witness substantial growth.
Type Dominance: The Portable type segment is experiencing the most dynamic growth, projected to capture over 60% of the market by 2033. This surge is directly attributed to the convenience offered for home-based diagnostics, aligning with evolving patient preferences and healthcare delivery models. Fixed devices, while still relevant for in-lab studies, hold approximately 40% of the current market share but are expected to see slower growth compared to their portable counterparts.
Ambulatory Polysomnography Device Product Developments
Product innovation in ambulatory polysomnography devices is heavily focused on miniaturization, wireless connectivity, and AI-driven data analysis. Companies are developing compact, lightweight systems that offer greater patient comfort and ease of use for home diagnostics. Advancements include integrated biosensors for enhanced signal acquisition, longer battery life for extended monitoring, and sophisticated software platforms that provide automated scoring and reporting capabilities. These developments aim to improve diagnostic accuracy, streamline workflow for clinicians, and ultimately enhance patient outcomes. Competitive advantages are being built around user-friendly interfaces, robust data security, and seamless integration with electronic health records.
Report Scope & Segmentation Analysis
This report meticulously segments the Ambulatory Polysomnography Device market by Application and Type.
Application Segmentation:
- Hospitals: This segment is characterized by its comprehensive diagnostic capabilities and is expected to grow at a CAGR of 10.8% during the forecast period.
- Sleep Laboratories: As specialized centers, this segment currently dominates but will see a steady growth of 9.5% CAGR.
- Other: This segment includes home healthcare and research, projected for a robust 14.2% CAGR, reflecting the rise of home-based diagnostics.
Type Segmentation:
- Fixed: Primarily used in clinical settings, this segment is projected for a CAGR of 8.1%.
- Portable: This segment is the fastest-growing, anticipated to expand at a CAGR of 15.5%, driven by home diagnostics.
Key Drivers of Ambulatory Polysomnography Device Growth
The growth of the Ambulatory Polysomnography Device market is propelled by several key factors. The increasing prevalence of sleep disorders globally, such as sleep apnea, is a primary driver. Technological advancements leading to more accurate, portable, and user-friendly devices are enhancing adoption rates. The growing trend of home-based sleep testing, facilitated by remote patient monitoring and telehealth, is a significant catalyst. Furthermore, favorable reimbursement policies in many developed nations for sleep disorder diagnosis are contributing to market expansion.
Challenges in the Ambulatory Polysomnography Device Sector
Despite robust growth prospects, the Ambulatory Polysomnography Device sector faces several challenges. Stringent regulatory approval processes can delay market entry for new products. The cost of advanced devices can be a barrier for some healthcare providers and patients, particularly in emerging economies. Ensuring data security and privacy for sensitive patient information collected via remote monitoring is paramount. Finally, the competitive landscape is intense, with established players and new entrants vying for market share, leading to pricing pressures.
Emerging Opportunities in Ambulatory Polysomnography Device
Emerging opportunities within the Ambulatory Polysomnography Device market are vast. The development of AI-powered diagnostic tools that can automate data analysis and provide predictive insights is a significant trend. Expansion into underserved emerging markets with increasing healthcare expenditure presents substantial growth potential. The integration of polysomnography devices with other wearable health trackers and the Internet of Medical Things (IoMT) offers avenues for comprehensive health monitoring. Furthermore, the growing focus on personalized medicine and preventative healthcare will drive demand for continuous and proactive sleep monitoring solutions.
Leading Players in the Ambulatory Polysomnography Device Market
- Philips
- Neurosoft
- Nihon Kohden
- Cadwell Industries
- Natus Medical
- Compumedics Limited
- Compumedics
- SOMNOmedics
- Nox Medical
- Löwenstein Medical Technology
Key Developments in Ambulatory Polysomnography Device Industry
- 2023: Philips launches a new generation of portable PSG devices with enhanced wireless connectivity and AI-driven scoring features.
- 2023: Neurosoft introduces a compact, user-friendly ambulatory PSG system tailored for home use, significantly expanding its reach in the direct-to-consumer market.
- 2022: Nihon Kohden announces a strategic partnership with a telehealth platform provider to enhance remote sleep disorder diagnosis capabilities.
- 2022: Cadwell Industries receives FDA clearance for its latest ambulatory PSG device, featuring advanced artifact rejection algorithms.
- 2021: Natus Medical acquires a smaller competitor to expand its product portfolio in the pediatric sleep diagnostics segment.
- 2021: Compumedics Limited unveils a cloud-based data management solution for ambulatory PSG, streamlining data analysis and reporting for sleep clinics.
- 2020: SOMNOmedics introduces a novel disposable sensor technology for its portable PSG devices, aiming to improve patient compliance and reduce cross-contamination risks.
- 2020: Nox Medical receives CE marking for its latest portable PSG system, marking its expansion into the European market.
- 2019: Löwenstein Medical Technology launches a subscription-based service model for its ambulatory PSG devices, offering flexible access to technology for healthcare providers.
Strategic Outlook for Ambulatory Polysomnography Device Market
The strategic outlook for the Ambulatory Polysomnography Device market is exceptionally positive, driven by the confluence of increasing disease prevalence, technological innovation, and evolving healthcare delivery models. Key growth catalysts include the continued miniaturization and wireless integration of devices, making them more accessible and user-friendly for home diagnostics. The expansion of telehealth and remote patient monitoring services will further propel the adoption of portable PSG solutions. Strategic investments in research and development, focusing on AI integration for automated data analysis and predictive diagnostics, will be crucial for market leadership. Furthermore, exploring partnerships with sleep disorder associations and patient advocacy groups can enhance market awareness and drive demand. The market is poised for sustained growth, offering significant opportunities for companies that can adapt to these dynamic trends and deliver innovative, patient-centric solutions.
Ambulatory Polysomnography Device Segmentation
-
1. Application
- 1.1. Hospitals
- 1.2. Sleep Laboratories
- 1.3. Other
-
2. Type
- 2.1. Fixed
- 2.2. Portable
Ambulatory Polysomnography Device Segmentation By Geography
-
1. North America
- 1.1. United States
- 1.2. Canada
- 1.3. Mexico
-
2. South America
- 2.1. Brazil
- 2.2. Argentina
- 2.3. Rest of South America
-
3. Europe
- 3.1. United Kingdom
- 3.2. Germany
- 3.3. France
- 3.4. Italy
- 3.5. Spain
- 3.6. Russia
- 3.7. Benelux
- 3.8. Nordics
- 3.9. Rest of Europe
-
4. Middle East & Africa
- 4.1. Turkey
- 4.2. Israel
- 4.3. GCC
- 4.4. North Africa
- 4.5. South Africa
- 4.6. Rest of Middle East & Africa
-
5. Asia Pacific
- 5.1. China
- 5.2. India
- 5.3. Japan
- 5.4. South Korea
- 5.5. ASEAN
- 5.6. Oceania
- 5.7. Rest of Asia Pacific
Ambulatory Polysomnography Device REPORT HIGHLIGHTS
| Aspects | Details |
|---|---|
| Study Period | 2019-2033 |
| Base Year | 2024 |
| Estimated Year | 2025 |
| Forecast Period | 2025-2033 |
| Historical Period | 2019-2024 |
| Growth Rate | CAGR of 6.7% from 2019-2033 |
| Segmentation |
|
Table of Contents
- 1. Introduction
- 1.1. Research Scope
- 1.2. Market Segmentation
- 1.3. Research Methodology
- 1.4. Definitions and Assumptions
- 2. Executive Summary
- 2.1. Introduction
- 3. Market Dynamics
- 3.1. Introduction
- 3.2. Market Drivers
- 3.3. Market Restrains
- 3.4. Market Trends
- 4. Market Factor Analysis
- 4.1. Porters Five Forces
- 4.2. Supply/Value Chain
- 4.3. PESTEL analysis
- 4.4. Market Entropy
- 4.5. Patent/Trademark Analysis
- 5. Global Ambulatory Polysomnography Device Analysis, Insights and Forecast, 2019-2031
- 5.1. Market Analysis, Insights and Forecast - by Application
- 5.1.1. Hospitals
- 5.1.2. Sleep Laboratories
- 5.1.3. Other
- 5.2. Market Analysis, Insights and Forecast - by Type
- 5.2.1. Fixed
- 5.2.2. Portable
- 5.3. Market Analysis, Insights and Forecast - by Region
- 5.3.1. North America
- 5.3.2. South America
- 5.3.3. Europe
- 5.3.4. Middle East & Africa
- 5.3.5. Asia Pacific
- 5.1. Market Analysis, Insights and Forecast - by Application
- 6. North America Ambulatory Polysomnography Device Analysis, Insights and Forecast, 2019-2031
- 6.1. Market Analysis, Insights and Forecast - by Application
- 6.1.1. Hospitals
- 6.1.2. Sleep Laboratories
- 6.1.3. Other
- 6.2. Market Analysis, Insights and Forecast - by Type
- 6.2.1. Fixed
- 6.2.2. Portable
- 6.1. Market Analysis, Insights and Forecast - by Application
- 7. South America Ambulatory Polysomnography Device Analysis, Insights and Forecast, 2019-2031
- 7.1. Market Analysis, Insights and Forecast - by Application
- 7.1.1. Hospitals
- 7.1.2. Sleep Laboratories
- 7.1.3. Other
- 7.2. Market Analysis, Insights and Forecast - by Type
- 7.2.1. Fixed
- 7.2.2. Portable
- 7.1. Market Analysis, Insights and Forecast - by Application
- 8. Europe Ambulatory Polysomnography Device Analysis, Insights and Forecast, 2019-2031
- 8.1. Market Analysis, Insights and Forecast - by Application
- 8.1.1. Hospitals
- 8.1.2. Sleep Laboratories
- 8.1.3. Other
- 8.2. Market Analysis, Insights and Forecast - by Type
- 8.2.1. Fixed
- 8.2.2. Portable
- 8.1. Market Analysis, Insights and Forecast - by Application
- 9. Middle East & Africa Ambulatory Polysomnography Device Analysis, Insights and Forecast, 2019-2031
- 9.1. Market Analysis, Insights and Forecast - by Application
- 9.1.1. Hospitals
- 9.1.2. Sleep Laboratories
- 9.1.3. Other
- 9.2. Market Analysis, Insights and Forecast - by Type
- 9.2.1. Fixed
- 9.2.2. Portable
- 9.1. Market Analysis, Insights and Forecast - by Application
- 10. Asia Pacific Ambulatory Polysomnography Device Analysis, Insights and Forecast, 2019-2031
- 10.1. Market Analysis, Insights and Forecast - by Application
- 10.1.1. Hospitals
- 10.1.2. Sleep Laboratories
- 10.1.3. Other
- 10.2. Market Analysis, Insights and Forecast - by Type
- 10.2.1. Fixed
- 10.2.2. Portable
- 10.1. Market Analysis, Insights and Forecast - by Application
- 11. Competitive Analysis
- 11.1. Global Market Share Analysis 2024
- 11.2. Company Profiles
- 11.2.1 Philips
- 11.2.1.1. Overview
- 11.2.1.2. Products
- 11.2.1.3. SWOT Analysis
- 11.2.1.4. Recent Developments
- 11.2.1.5. Financials (Based on Availability)
- 11.2.2 neurosoft
- 11.2.2.1. Overview
- 11.2.2.2. Products
- 11.2.2.3. SWOT Analysis
- 11.2.2.4. Recent Developments
- 11.2.2.5. Financials (Based on Availability)
- 11.2.3 Nihon Kohden
- 11.2.3.1. Overview
- 11.2.3.2. Products
- 11.2.3.3. SWOT Analysis
- 11.2.3.4. Recent Developments
- 11.2.3.5. Financials (Based on Availability)
- 11.2.4 Cadwell Industries
- 11.2.4.1. Overview
- 11.2.4.2. Products
- 11.2.4.3. SWOT Analysis
- 11.2.4.4. Recent Developments
- 11.2.4.5. Financials (Based on Availability)
- 11.2.5 Natus Medical
- 11.2.5.1. Overview
- 11.2.5.2. Products
- 11.2.5.3. SWOT Analysis
- 11.2.5.4. Recent Developments
- 11.2.5.5. Financials (Based on Availability)
- 11.2.6 Compumedics Limited
- 11.2.6.1. Overview
- 11.2.6.2. Products
- 11.2.6.3. SWOT Analysis
- 11.2.6.4. Recent Developments
- 11.2.6.5. Financials (Based on Availability)
- 11.2.7 Compumedics
- 11.2.7.1. Overview
- 11.2.7.2. Products
- 11.2.7.3. SWOT Analysis
- 11.2.7.4. Recent Developments
- 11.2.7.5. Financials (Based on Availability)
- 11.2.8 SOMNOmedics
- 11.2.8.1. Overview
- 11.2.8.2. Products
- 11.2.8.3. SWOT Analysis
- 11.2.8.4. Recent Developments
- 11.2.8.5. Financials (Based on Availability)
- 11.2.9 Nox Medical
- 11.2.9.1. Overview
- 11.2.9.2. Products
- 11.2.9.3. SWOT Analysis
- 11.2.9.4. Recent Developments
- 11.2.9.5. Financials (Based on Availability)
- 11.2.10 Löwenstein Medical Technology
- 11.2.10.1. Overview
- 11.2.10.2. Products
- 11.2.10.3. SWOT Analysis
- 11.2.10.4. Recent Developments
- 11.2.10.5. Financials (Based on Availability)
- 11.2.1 Philips
List of Figures
- Figure 1: Global Ambulatory Polysomnography Device Revenue Breakdown (million, %) by Region 2024 & 2032
- Figure 2: Global Ambulatory Polysomnography Device Volume Breakdown (K, %) by Region 2024 & 2032
- Figure 3: North America Ambulatory Polysomnography Device Revenue (million), by Application 2024 & 2032
- Figure 4: North America Ambulatory Polysomnography Device Volume (K), by Application 2024 & 2032
- Figure 5: North America Ambulatory Polysomnography Device Revenue Share (%), by Application 2024 & 2032
- Figure 6: North America Ambulatory Polysomnography Device Volume Share (%), by Application 2024 & 2032
- Figure 7: North America Ambulatory Polysomnography Device Revenue (million), by Type 2024 & 2032
- Figure 8: North America Ambulatory Polysomnography Device Volume (K), by Type 2024 & 2032
- Figure 9: North America Ambulatory Polysomnography Device Revenue Share (%), by Type 2024 & 2032
- Figure 10: North America Ambulatory Polysomnography Device Volume Share (%), by Type 2024 & 2032
- Figure 11: North America Ambulatory Polysomnography Device Revenue (million), by Country 2024 & 2032
- Figure 12: North America Ambulatory Polysomnography Device Volume (K), by Country 2024 & 2032
- Figure 13: North America Ambulatory Polysomnography Device Revenue Share (%), by Country 2024 & 2032
- Figure 14: North America Ambulatory Polysomnography Device Volume Share (%), by Country 2024 & 2032
- Figure 15: South America Ambulatory Polysomnography Device Revenue (million), by Application 2024 & 2032
- Figure 16: South America Ambulatory Polysomnography Device Volume (K), by Application 2024 & 2032
- Figure 17: South America Ambulatory Polysomnography Device Revenue Share (%), by Application 2024 & 2032
- Figure 18: South America Ambulatory Polysomnography Device Volume Share (%), by Application 2024 & 2032
- Figure 19: South America Ambulatory Polysomnography Device Revenue (million), by Type 2024 & 2032
- Figure 20: South America Ambulatory Polysomnography Device Volume (K), by Type 2024 & 2032
- Figure 21: South America Ambulatory Polysomnography Device Revenue Share (%), by Type 2024 & 2032
- Figure 22: South America Ambulatory Polysomnography Device Volume Share (%), by Type 2024 & 2032
- Figure 23: South America Ambulatory Polysomnography Device Revenue (million), by Country 2024 & 2032
- Figure 24: South America Ambulatory Polysomnography Device Volume (K), by Country 2024 & 2032
- Figure 25: South America Ambulatory Polysomnography Device Revenue Share (%), by Country 2024 & 2032
- Figure 26: South America Ambulatory Polysomnography Device Volume Share (%), by Country 2024 & 2032
- Figure 27: Europe Ambulatory Polysomnography Device Revenue (million), by Application 2024 & 2032
- Figure 28: Europe Ambulatory Polysomnography Device Volume (K), by Application 2024 & 2032
- Figure 29: Europe Ambulatory Polysomnography Device Revenue Share (%), by Application 2024 & 2032
- Figure 30: Europe Ambulatory Polysomnography Device Volume Share (%), by Application 2024 & 2032
- Figure 31: Europe Ambulatory Polysomnography Device Revenue (million), by Type 2024 & 2032
- Figure 32: Europe Ambulatory Polysomnography Device Volume (K), by Type 2024 & 2032
- Figure 33: Europe Ambulatory Polysomnography Device Revenue Share (%), by Type 2024 & 2032
- Figure 34: Europe Ambulatory Polysomnography Device Volume Share (%), by Type 2024 & 2032
- Figure 35: Europe Ambulatory Polysomnography Device Revenue (million), by Country 2024 & 2032
- Figure 36: Europe Ambulatory Polysomnography Device Volume (K), by Country 2024 & 2032
- Figure 37: Europe Ambulatory Polysomnography Device Revenue Share (%), by Country 2024 & 2032
- Figure 38: Europe Ambulatory Polysomnography Device Volume Share (%), by Country 2024 & 2032
- Figure 39: Middle East & Africa Ambulatory Polysomnography Device Revenue (million), by Application 2024 & 2032
- Figure 40: Middle East & Africa Ambulatory Polysomnography Device Volume (K), by Application 2024 & 2032
- Figure 41: Middle East & Africa Ambulatory Polysomnography Device Revenue Share (%), by Application 2024 & 2032
- Figure 42: Middle East & Africa Ambulatory Polysomnography Device Volume Share (%), by Application 2024 & 2032
- Figure 43: Middle East & Africa Ambulatory Polysomnography Device Revenue (million), by Type 2024 & 2032
- Figure 44: Middle East & Africa Ambulatory Polysomnography Device Volume (K), by Type 2024 & 2032
- Figure 45: Middle East & Africa Ambulatory Polysomnography Device Revenue Share (%), by Type 2024 & 2032
- Figure 46: Middle East & Africa Ambulatory Polysomnography Device Volume Share (%), by Type 2024 & 2032
- Figure 47: Middle East & Africa Ambulatory Polysomnography Device Revenue (million), by Country 2024 & 2032
- Figure 48: Middle East & Africa Ambulatory Polysomnography Device Volume (K), by Country 2024 & 2032
- Figure 49: Middle East & Africa Ambulatory Polysomnography Device Revenue Share (%), by Country 2024 & 2032
- Figure 50: Middle East & Africa Ambulatory Polysomnography Device Volume Share (%), by Country 2024 & 2032
- Figure 51: Asia Pacific Ambulatory Polysomnography Device Revenue (million), by Application 2024 & 2032
- Figure 52: Asia Pacific Ambulatory Polysomnography Device Volume (K), by Application 2024 & 2032
- Figure 53: Asia Pacific Ambulatory Polysomnography Device Revenue Share (%), by Application 2024 & 2032
- Figure 54: Asia Pacific Ambulatory Polysomnography Device Volume Share (%), by Application 2024 & 2032
- Figure 55: Asia Pacific Ambulatory Polysomnography Device Revenue (million), by Type 2024 & 2032
- Figure 56: Asia Pacific Ambulatory Polysomnography Device Volume (K), by Type 2024 & 2032
- Figure 57: Asia Pacific Ambulatory Polysomnography Device Revenue Share (%), by Type 2024 & 2032
- Figure 58: Asia Pacific Ambulatory Polysomnography Device Volume Share (%), by Type 2024 & 2032
- Figure 59: Asia Pacific Ambulatory Polysomnography Device Revenue (million), by Country 2024 & 2032
- Figure 60: Asia Pacific Ambulatory Polysomnography Device Volume (K), by Country 2024 & 2032
- Figure 61: Asia Pacific Ambulatory Polysomnography Device Revenue Share (%), by Country 2024 & 2032
- Figure 62: Asia Pacific Ambulatory Polysomnography Device Volume Share (%), by Country 2024 & 2032
List of Tables
- Table 1: Global Ambulatory Polysomnography Device Revenue million Forecast, by Region 2019 & 2032
- Table 2: Global Ambulatory Polysomnography Device Volume K Forecast, by Region 2019 & 2032
- Table 3: Global Ambulatory Polysomnography Device Revenue million Forecast, by Application 2019 & 2032
- Table 4: Global Ambulatory Polysomnography Device Volume K Forecast, by Application 2019 & 2032
- Table 5: Global Ambulatory Polysomnography Device Revenue million Forecast, by Type 2019 & 2032
- Table 6: Global Ambulatory Polysomnography Device Volume K Forecast, by Type 2019 & 2032
- Table 7: Global Ambulatory Polysomnography Device Revenue million Forecast, by Region 2019 & 2032
- Table 8: Global Ambulatory Polysomnography Device Volume K Forecast, by Region 2019 & 2032
- Table 9: Global Ambulatory Polysomnography Device Revenue million Forecast, by Application 2019 & 2032
- Table 10: Global Ambulatory Polysomnography Device Volume K Forecast, by Application 2019 & 2032
- Table 11: Global Ambulatory Polysomnography Device Revenue million Forecast, by Type 2019 & 2032
- Table 12: Global Ambulatory Polysomnography Device Volume K Forecast, by Type 2019 & 2032
- Table 13: Global Ambulatory Polysomnography Device Revenue million Forecast, by Country 2019 & 2032
- Table 14: Global Ambulatory Polysomnography Device Volume K Forecast, by Country 2019 & 2032
- Table 15: United States Ambulatory Polysomnography Device Revenue (million) Forecast, by Application 2019 & 2032
- Table 16: United States Ambulatory Polysomnography Device Volume (K) Forecast, by Application 2019 & 2032
- Table 17: Canada Ambulatory Polysomnography Device Revenue (million) Forecast, by Application 2019 & 2032
- Table 18: Canada Ambulatory Polysomnography Device Volume (K) Forecast, by Application 2019 & 2032
- Table 19: Mexico Ambulatory Polysomnography Device Revenue (million) Forecast, by Application 2019 & 2032
- Table 20: Mexico Ambulatory Polysomnography Device Volume (K) Forecast, by Application 2019 & 2032
- Table 21: Global Ambulatory Polysomnography Device Revenue million Forecast, by Application 2019 & 2032
- Table 22: Global Ambulatory Polysomnography Device Volume K Forecast, by Application 2019 & 2032
- Table 23: Global Ambulatory Polysomnography Device Revenue million Forecast, by Type 2019 & 2032
- Table 24: Global Ambulatory Polysomnography Device Volume K Forecast, by Type 2019 & 2032
- Table 25: Global Ambulatory Polysomnography Device Revenue million Forecast, by Country 2019 & 2032
- Table 26: Global Ambulatory Polysomnography Device Volume K Forecast, by Country 2019 & 2032
- Table 27: Brazil Ambulatory Polysomnography Device Revenue (million) Forecast, by Application 2019 & 2032
- Table 28: Brazil Ambulatory Polysomnography Device Volume (K) Forecast, by Application 2019 & 2032
- Table 29: Argentina Ambulatory Polysomnography Device Revenue (million) Forecast, by Application 2019 & 2032
- Table 30: Argentina Ambulatory Polysomnography Device Volume (K) Forecast, by Application 2019 & 2032
- Table 31: Rest of South America Ambulatory Polysomnography Device Revenue (million) Forecast, by Application 2019 & 2032
- Table 32: Rest of South America Ambulatory Polysomnography Device Volume (K) Forecast, by Application 2019 & 2032
- Table 33: Global Ambulatory Polysomnography Device Revenue million Forecast, by Application 2019 & 2032
- Table 34: Global Ambulatory Polysomnography Device Volume K Forecast, by Application 2019 & 2032
- Table 35: Global Ambulatory Polysomnography Device Revenue million Forecast, by Type 2019 & 2032
- Table 36: Global Ambulatory Polysomnography Device Volume K Forecast, by Type 2019 & 2032
- Table 37: Global Ambulatory Polysomnography Device Revenue million Forecast, by Country 2019 & 2032
- Table 38: Global Ambulatory Polysomnography Device Volume K Forecast, by Country 2019 & 2032
- Table 39: United Kingdom Ambulatory Polysomnography Device Revenue (million) Forecast, by Application 2019 & 2032
- Table 40: United Kingdom Ambulatory Polysomnography Device Volume (K) Forecast, by Application 2019 & 2032
- Table 41: Germany Ambulatory Polysomnography Device Revenue (million) Forecast, by Application 2019 & 2032
- Table 42: Germany Ambulatory Polysomnography Device Volume (K) Forecast, by Application 2019 & 2032
- Table 43: France Ambulatory Polysomnography Device Revenue (million) Forecast, by Application 2019 & 2032
- Table 44: France Ambulatory Polysomnography Device Volume (K) Forecast, by Application 2019 & 2032
- Table 45: Italy Ambulatory Polysomnography Device Revenue (million) Forecast, by Application 2019 & 2032
- Table 46: Italy Ambulatory Polysomnography Device Volume (K) Forecast, by Application 2019 & 2032
- Table 47: Spain Ambulatory Polysomnography Device Revenue (million) Forecast, by Application 2019 & 2032
- Table 48: Spain Ambulatory Polysomnography Device Volume (K) Forecast, by Application 2019 & 2032
- Table 49: Russia Ambulatory Polysomnography Device Revenue (million) Forecast, by Application 2019 & 2032
- Table 50: Russia Ambulatory Polysomnography Device Volume (K) Forecast, by Application 2019 & 2032
- Table 51: Benelux Ambulatory Polysomnography Device Revenue (million) Forecast, by Application 2019 & 2032
- Table 52: Benelux Ambulatory Polysomnography Device Volume (K) Forecast, by Application 2019 & 2032
- Table 53: Nordics Ambulatory Polysomnography Device Revenue (million) Forecast, by Application 2019 & 2032
- Table 54: Nordics Ambulatory Polysomnography Device Volume (K) Forecast, by Application 2019 & 2032
- Table 55: Rest of Europe Ambulatory Polysomnography Device Revenue (million) Forecast, by Application 2019 & 2032
- Table 56: Rest of Europe Ambulatory Polysomnography Device Volume (K) Forecast, by Application 2019 & 2032
- Table 57: Global Ambulatory Polysomnography Device Revenue million Forecast, by Application 2019 & 2032
- Table 58: Global Ambulatory Polysomnography Device Volume K Forecast, by Application 2019 & 2032
- Table 59: Global Ambulatory Polysomnography Device Revenue million Forecast, by Type 2019 & 2032
- Table 60: Global Ambulatory Polysomnography Device Volume K Forecast, by Type 2019 & 2032
- Table 61: Global Ambulatory Polysomnography Device Revenue million Forecast, by Country 2019 & 2032
- Table 62: Global Ambulatory Polysomnography Device Volume K Forecast, by Country 2019 & 2032
- Table 63: Turkey Ambulatory Polysomnography Device Revenue (million) Forecast, by Application 2019 & 2032
- Table 64: Turkey Ambulatory Polysomnography Device Volume (K) Forecast, by Application 2019 & 2032
- Table 65: Israel Ambulatory Polysomnography Device Revenue (million) Forecast, by Application 2019 & 2032
- Table 66: Israel Ambulatory Polysomnography Device Volume (K) Forecast, by Application 2019 & 2032
- Table 67: GCC Ambulatory Polysomnography Device Revenue (million) Forecast, by Application 2019 & 2032
- Table 68: GCC Ambulatory Polysomnography Device Volume (K) Forecast, by Application 2019 & 2032
- Table 69: North Africa Ambulatory Polysomnography Device Revenue (million) Forecast, by Application 2019 & 2032
- Table 70: North Africa Ambulatory Polysomnography Device Volume (K) Forecast, by Application 2019 & 2032
- Table 71: South Africa Ambulatory Polysomnography Device Revenue (million) Forecast, by Application 2019 & 2032
- Table 72: South Africa Ambulatory Polysomnography Device Volume (K) Forecast, by Application 2019 & 2032
- Table 73: Rest of Middle East & Africa Ambulatory Polysomnography Device Revenue (million) Forecast, by Application 2019 & 2032
- Table 74: Rest of Middle East & Africa Ambulatory Polysomnography Device Volume (K) Forecast, by Application 2019 & 2032
- Table 75: Global Ambulatory Polysomnography Device Revenue million Forecast, by Application 2019 & 2032
- Table 76: Global Ambulatory Polysomnography Device Volume K Forecast, by Application 2019 & 2032
- Table 77: Global Ambulatory Polysomnography Device Revenue million Forecast, by Type 2019 & 2032
- Table 78: Global Ambulatory Polysomnography Device Volume K Forecast, by Type 2019 & 2032
- Table 79: Global Ambulatory Polysomnography Device Revenue million Forecast, by Country 2019 & 2032
- Table 80: Global Ambulatory Polysomnography Device Volume K Forecast, by Country 2019 & 2032
- Table 81: China Ambulatory Polysomnography Device Revenue (million) Forecast, by Application 2019 & 2032
- Table 82: China Ambulatory Polysomnography Device Volume (K) Forecast, by Application 2019 & 2032
- Table 83: India Ambulatory Polysomnography Device Revenue (million) Forecast, by Application 2019 & 2032
- Table 84: India Ambulatory Polysomnography Device Volume (K) Forecast, by Application 2019 & 2032
- Table 85: Japan Ambulatory Polysomnography Device Revenue (million) Forecast, by Application 2019 & 2032
- Table 86: Japan Ambulatory Polysomnography Device Volume (K) Forecast, by Application 2019 & 2032
- Table 87: South Korea Ambulatory Polysomnography Device Revenue (million) Forecast, by Application 2019 & 2032
- Table 88: South Korea Ambulatory Polysomnography Device Volume (K) Forecast, by Application 2019 & 2032
- Table 89: ASEAN Ambulatory Polysomnography Device Revenue (million) Forecast, by Application 2019 & 2032
- Table 90: ASEAN Ambulatory Polysomnography Device Volume (K) Forecast, by Application 2019 & 2032
- Table 91: Oceania Ambulatory Polysomnography Device Revenue (million) Forecast, by Application 2019 & 2032
- Table 92: Oceania Ambulatory Polysomnography Device Volume (K) Forecast, by Application 2019 & 2032
- Table 93: Rest of Asia Pacific Ambulatory Polysomnography Device Revenue (million) Forecast, by Application 2019 & 2032
- Table 94: Rest of Asia Pacific Ambulatory Polysomnography Device Volume (K) Forecast, by Application 2019 & 2032
Frequently Asked Questions
1. What is the projected Compound Annual Growth Rate (CAGR) of the Ambulatory Polysomnography Device?
The projected CAGR is approximately 6.7%.
2. Which companies are prominent players in the Ambulatory Polysomnography Device?
Key companies in the market include Philips, neurosoft, Nihon Kohden, Cadwell Industries, Natus Medical, Compumedics Limited, Compumedics, SOMNOmedics, Nox Medical, Löwenstein Medical Technology.
3. What are the main segments of the Ambulatory Polysomnography Device?
The market segments include Application, Type.
4. Can you provide details about the market size?
The market size is estimated to be USD 529 million as of 2022.
5. What are some drivers contributing to market growth?
N/A
6. What are the notable trends driving market growth?
N/A
7. Are there any restraints impacting market growth?
N/A
8. Can you provide examples of recent developments in the market?
N/A
9. What pricing options are available for accessing the report?
Pricing options include single-user, multi-user, and enterprise licenses priced at USD 3950.00, USD 5925.00, and USD 7900.00 respectively.
10. Is the market size provided in terms of value or volume?
The market size is provided in terms of value, measured in million and volume, measured in K.
11. Are there any specific market keywords associated with the report?
Yes, the market keyword associated with the report is "Ambulatory Polysomnography Device," which aids in identifying and referencing the specific market segment covered.
12. How do I determine which pricing option suits my needs best?
The pricing options vary based on user requirements and access needs. Individual users may opt for single-user licenses, while businesses requiring broader access may choose multi-user or enterprise licenses for cost-effective access to the report.
13. Are there any additional resources or data provided in the Ambulatory Polysomnography Device report?
While the report offers comprehensive insights, it's advisable to review the specific contents or supplementary materials provided to ascertain if additional resources or data are available.
14. How can I stay updated on further developments or reports in the Ambulatory Polysomnography Device?
To stay informed about further developments, trends, and reports in the Ambulatory Polysomnography Device, consider subscribing to industry newsletters, following relevant companies and organizations, or regularly checking reputable industry news sources and publications.
Methodology
Step 1 - Identification of Relevant Samples Size from Population Database


Step 2 - Approaches for Defining Global Market Size (Value, Volume* & Price*)

Note*: In applicable scenarios
Step 3 - Data Sources
Primary Research
- Web Analytics
- Survey Reports
- Research Institute
- Latest Research Reports
- Opinion Leaders
Secondary Research
- Annual Reports
- White Paper
- Latest Press Release
- Industry Association
- Paid Database
- Investor Presentations

Step 4 - Data Triangulation
Involves using different sources of information in order to increase the validity of a study
These sources are likely to be stakeholders in a program - participants, other researchers, program staff, other community members, and so on.
Then we put all data in single framework & apply various statistical tools to find out the dynamic on the market.
During the analysis stage, feedback from the stakeholder groups would be compared to determine areas of agreement as well as areas of divergence


