
Key Insights
The Asia-Pacific (APAC) MRI systems market is experiencing robust growth, driven by factors such as rising prevalence of chronic diseases (like cancer and cardiovascular ailments), increasing healthcare expenditure, and expanding healthcare infrastructure across the region. Technological advancements, including the development of high-field and ultra-high-field MRI systems offering improved image quality and diagnostic capabilities, further stimulate market expansion. China, Japan, India, and South Korea are major contributors to this growth, fueled by a burgeoning middle class with increased disposable income and a growing demand for advanced medical diagnostics. However, high costs associated with MRI systems and their maintenance, along with a shortage of trained radiologists in certain areas, pose significant challenges. The market is segmented by architecture (closed vs. open), field strength (low, high, very high, ultra-high), and application (oncology, neurology, cardiology, etc.). While the closed MRI systems currently dominate, the open MRI systems segment is expected to witness significant growth due to patient comfort and accessibility benefits. The high-field and ultra-high-field MRI systems segments are expected to experience substantial growth due to their superior imaging capabilities, although the initial investment costs remain high.
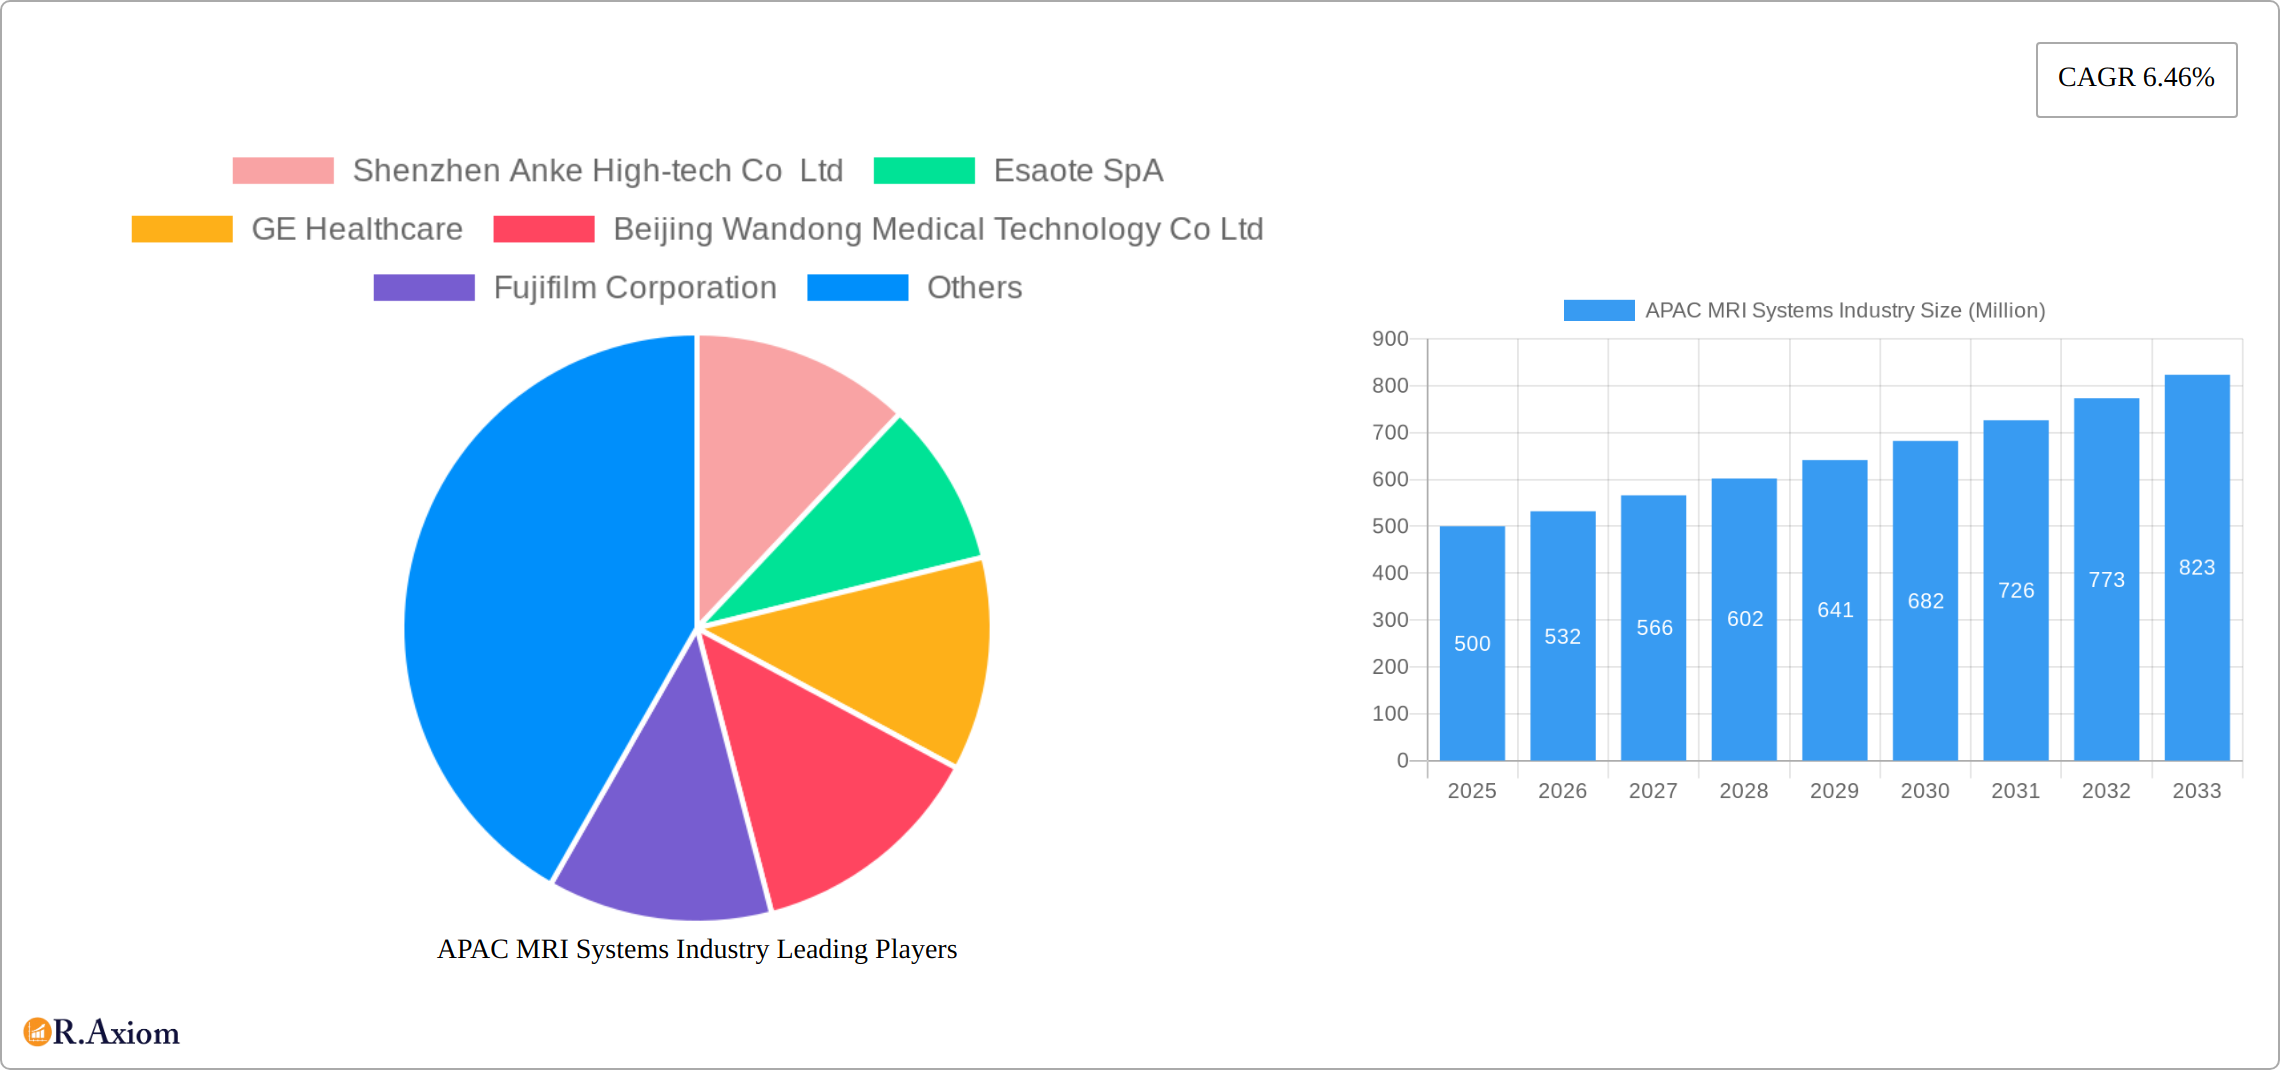
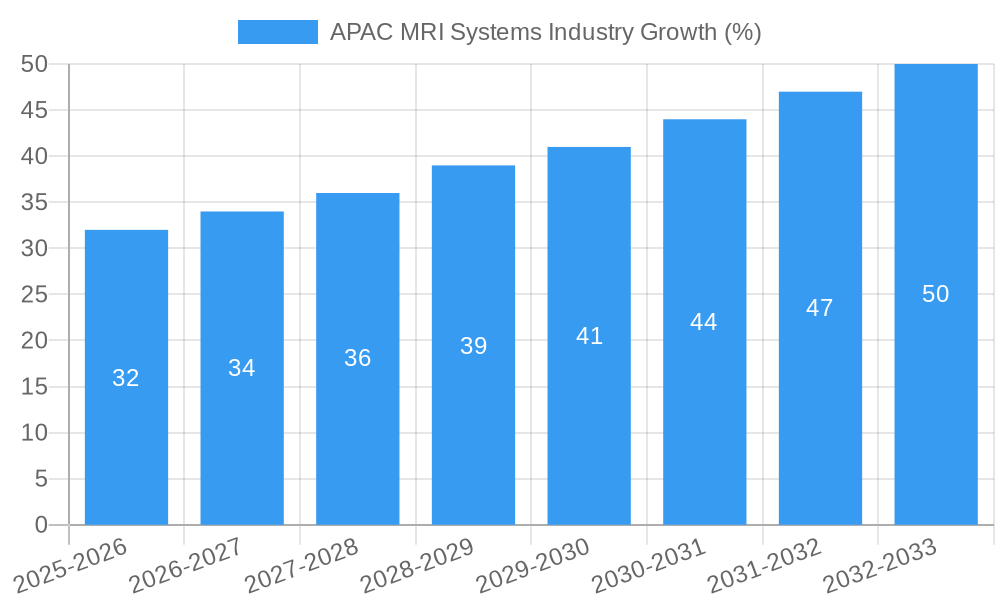
The market's considerable growth potential in APAC is further enhanced by government initiatives promoting healthcare infrastructure development and encouraging adoption of advanced medical technologies. Increasing collaborations between multinational and local companies are also contributing to market expansion. However, regulatory hurdles and varying healthcare reimbursement policies across different APAC countries can impact market penetration. The forecast period (2025-2033) suggests a continued upward trajectory, with a projected CAGR of 6.46%. This growth is expected to be primarily driven by increasing demand from developing economies within APAC, coupled with ongoing technological advancements that enhance the diagnostic capabilities and clinical utility of MRI systems. The competitive landscape is marked by a mix of multinational giants and regional players, leading to increased innovation and competitive pricing.
This comprehensive report provides an in-depth analysis of the Asia-Pacific (APAC) MRI systems market, covering market size, growth drivers, challenges, key players, and future outlook. The study period spans from 2019 to 2033, with 2025 serving as the base and estimated year. The forecast period extends from 2025 to 2033, while the historical period encompasses 2019-2024. This report is an essential resource for industry stakeholders, investors, and researchers seeking to understand the dynamics of this rapidly evolving market.
APAC MRI Systems Industry Market Concentration & Innovation
The APAC MRI systems market exhibits a moderately concentrated landscape, with several major multinational corporations and prominent domestic players holding significant market share. While exact market share figures for each company vary and are dynamic, companies like Siemens Healthineers, GE Healthcare, Philips, and Canon Medical Systems consistently rank among the leading players, commanding a substantial portion of the overall revenue. Smaller, specialized companies such as Shenzhen Anke High-tech Co Ltd, Esaote SpA, Beijing Wandong Medical Technology Co Ltd, Fujifilm Corporation, Shenzhen Basda Medical Apparatus Co Ltd, and Neusoft Medical Systems Co Ltd compete fiercely within specific segments.
Innovation in the APAC MRI systems market is driven by several factors, including:
- Technological advancements: Development of higher field strength MRI systems (ultra-high field MRI), improved image quality and resolution, and integration of advanced AI-powered image analysis tools.
- Regulatory landscape: Government initiatives promoting healthcare infrastructure development and increasing healthcare expenditure significantly influence market growth.Stringent regulatory approvals and safety standards impact market entry and innovation pace.
- Product substitution: The presence of alternative diagnostic imaging techniques such as CT scans and ultrasound creates competitive pressure, prompting continuous innovation to enhance MRI's clinical value proposition.
- End-user trends: Rising prevalence of chronic diseases, increasing demand for minimally invasive diagnostic procedures, and a growing preference for advanced imaging techniques drive market growth.
- M&A activities: Consolidation within the industry through mergers and acquisitions (M&A) leads to increased market concentration, impacting competition, and reshaping the competitive landscape. While precise M&A deal values for the APAC region are not publicly available for all transactions, the total value of deals involving MRI technology companies is estimated to have exceeded XX Million in the past five years.
APAC MRI Systems Industry Industry Trends & Insights
The APAC MRI systems market is experiencing robust growth, driven by several key factors. The Compound Annual Growth Rate (CAGR) for the forecast period (2025-2033) is projected at xx%. This growth is fueled by several factors, including:
- Rising healthcare expenditure: Increased government spending on healthcare infrastructure and medical equipment procurement across several APAC nations. China, India, and other rapidly developing economies are significantly contributing to market expansion.
- Growing prevalence of chronic diseases: The surge in chronic illnesses such as cancer, cardiovascular diseases, and neurological disorders is driving the demand for advanced diagnostic tools like MRI systems.
- Technological advancements: The introduction of innovative MRI technologies like high-field strength MRI and AI-powered image analysis enhances diagnostic capabilities, fueling market expansion.
- Increasing awareness about the benefits of MRI: Greater awareness among both healthcare professionals and patients regarding the advantages of MRI compared to alternative imaging modalities, stimulating demand.
- Expanding healthcare infrastructure: Ongoing development of healthcare facilities and hospitals across the region, resulting in increased MRI system installations.
- Market penetration: The market penetration rate of MRI systems is still relatively low compared to other regions, presenting ample scope for future growth.
Competitive dynamics are intense, with established global players vying for market share alongside local manufacturers aiming to expand their reach and market penetration within the region.
Dominant Markets & Segments in APAC MRI Systems Industry
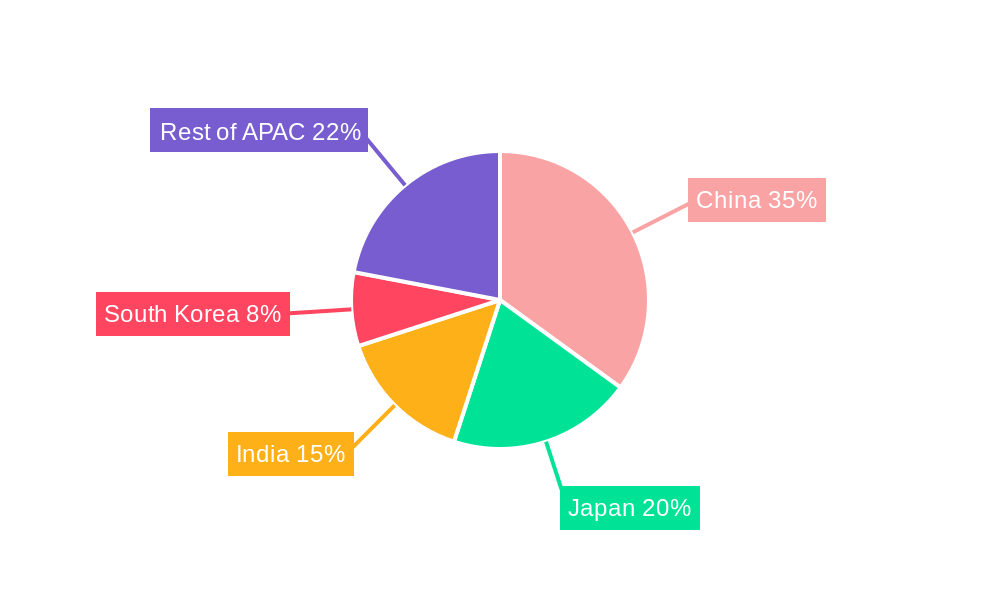
China currently holds the largest share of the APAC MRI systems market, primarily due to its vast population, expanding healthcare infrastructure, and substantial increase in healthcare expenditure. Other significant markets include India, Japan, South Korea, and Australia.
By Architecture: Closed MRI systems currently dominate the market due to their superior image quality and versatility. However, open MRI systems are gaining traction, particularly in applications where patient claustrophobia is a major concern.
By Field Strength: High-field MRI systems (1.5T and 3.0T) currently dominate the market, offering superior image quality and clinical versatility. However, the adoption of ultra-high field MRI systems (7.0T and above) is steadily increasing due to their advanced capabilities, offering better diagnostic precision. Low field MRI systems cater to niche applications and budget-conscious healthcare providers.
By Application: Oncology, neurology, and cardiology are the leading application segments, driven by the high prevalence of related diseases in the region. Musculoskeletal imaging is also a significant application area, particularly in developed economies within APAC. Other applications contribute to a sizable portion of the overall market.
- Key Drivers for Dominant Segments:
- China: Favorable government policies supporting healthcare infrastructure development, rising disposable incomes, and increasing awareness of advanced medical technologies.
- High-field MRI systems: Superior image quality, enhanced diagnostic capabilities, and growing adoption in advanced medical centers.
- Oncology & Neurology applications: High prevalence of cancer and neurological disorders in the region, necessitating advanced diagnostic tools.
APAP MRI Systems Industry Product Developments
Recent product innovations focus on improving image quality, reducing scan times, enhancing patient comfort, and incorporating AI-powered image analysis tools. Manufacturers are developing systems with higher field strengths, advanced coils, and improved software for faster and more accurate diagnoses. These advancements address the increasing demand for efficient and precise diagnostic imaging solutions, improving the overall clinical workflow and patient experience. The market fit of these innovations is excellent, particularly within specialized centers and private clinics.
Report Scope & Segmentation Analysis
This report provides a comprehensive segmentation analysis of the APAC MRI systems market.
By Architecture: The market is segmented into Closed MRI Systems and Open MRI Systems, analyzing growth projections and competitive dynamics for each. Closed systems are expected to maintain a larger market share.
By Field Strength: The market is divided into Low Field, High Field, Very High Field, and Ultra-high Field MRI Systems, with growth projections and competitive landscapes provided for each segment. High and Ultra-high field systems are expected to witness faster growth.
By Application: Market segmentation by application includes Oncology, Neurology, Cardiology, Gastroenterology, Musculoskeletal, and Other Applications. Each segment's growth projections, market size, and competitive dynamics are explored in detail. Oncology and Neurology are projected to maintain their leadership positions.
Key Drivers of APAC MRI Systems Industry Growth
The Asia-Pacific (APAC) MRI systems market is experiencing robust growth fueled by a confluence of factors. This expansion is driven by significant technological advancements, notably in high-field strength MRI systems offering superior image quality and resolution, and the integration of artificial intelligence (AI) for automated image analysis and faster, more accurate diagnoses. The increasing prevalence of chronic diseases across the region, coupled with a rising elderly population, significantly boosts demand for advanced diagnostic imaging. Furthermore, substantial increases in healthcare expenditure, particularly in developing APAC economies, are creating a more favorable environment for MRI system adoption. Government initiatives focused on strengthening healthcare infrastructure and expanding access to quality medical care are further accelerating market growth. Finally, a growing awareness among patients and healthcare professionals regarding the benefits of advanced medical imaging techniques, such as MRI, is driving demand for these systems.
Challenges in the APAC MRI Systems Industry Sector
Despite the significant growth potential, the APAC MRI systems market faces several challenges. The high capital expenditure required for acquiring and installing MRI systems presents a considerable barrier to entry, particularly for smaller healthcare providers in less developed regions. Stringent regulatory approvals and compliance requirements, varying across different APAC countries, can hinder market entry and the timely introduction of innovative technologies. The market is also characterized by intense competition, with established global players vying for market share alongside emerging local manufacturers. Supply chain disruptions and component shortages, exacerbated by global events, pose ongoing risks to market stability. Finally, the uneven distribution of healthcare resources across the vast and diverse APAC region limits market penetration in certain areas. These factors collectively represent significant headwinds to market expansion.
Emerging Opportunities in APAC MRI Systems Industry
Despite these challenges, significant opportunities exist for growth and innovation within the APAC MRI systems market. Untapped market potential remains considerable, especially in rural and underserved communities where access to advanced diagnostic imaging is limited. The development and adoption of more cost-effective MRI technologies, including lower-field strength systems and innovative financing models, can improve accessibility. The increasing demand for AI-powered image analysis and diagnostic support tools presents a significant opportunity for technology providers to enhance diagnostic accuracy and efficiency. The growing adoption of telehealth and remote diagnostic capabilities, leveraging the power of MRI data transmission and analysis, provides exciting possibilities for expanding healthcare reach. Finally, strategic collaborations and partnerships between healthcare providers, technology companies, and government agencies are crucial for fostering market growth and ensuring equitable access to advanced diagnostic technologies across the region.
Leading Players in the APAC MRI Systems Industry Market
- Shenzhen Anke High-tech Co Ltd
- Esaote SpA
- GE Healthcare
- Beijing Wandong Medical Technology Co Ltd
- Fujifilm Corporation
- Shenzhen Basda Medical Apparatus Co Ltd
- Neusoft Medical Systems Co Ltd
- Koninklijke Philips NV
- Canon Medical Systems Corporation
- Siemens Healthineers *List Not Exhaustive
Key Developments in APAC MRI Systems Industry Industry
- March 2022: Siemens Healthineers installed its advanced MRI scanner at the North Eastern Community Hospital's Benson Radiology department in South Australia, showcasing the ongoing demand for high-quality MRI technology in the region and the continued investment by key players in expanding access.
- March 2022: Siemens Healthineers launched its innovative MAGNETOM FreeStar MRI system at the 74th National Conference, IRIA 2022, in Bengaluru, India. This highlights the commitment to technological advancement and the market's receptiveness to cutting-edge MRI solutions.
- [Add more recent developments here with dates and brief descriptions. Include company names and specific product mentions where possible.]
Strategic Outlook for APAC MRI Systems Industry Market
The APAC MRI systems market is poised for continued growth, driven by technological advancements, increasing healthcare expenditure, and the rising prevalence of chronic diseases. The market will witness intensified competition among established players and the emergence of new entrants. Focus on innovation, strategic partnerships, and effective market penetration strategies will be crucial for success in this dynamic market. The continued expansion of healthcare infrastructure and the growing demand for advanced diagnostic imaging solutions will drive substantial market growth in the years to come.
APAC MRI Systems Industry Segmentation
-
1. Architecture
- 1.1. Closed MRI Systems
- 1.2. Open MRI Systems
-
2. Field Strength
- 2.1. Low Field MRI Systems
- 2.2. High Field MRI Systems
- 2.3. Very Hig
-
3. Application
- 3.1. Oncology
- 3.2. Neurology
- 3.3. Cardiology
- 3.4. Gastroenterology
- 3.5. Musculoskeletal
- 3.6. Other Applications
-
4. Geography
- 4.1. China
- 4.2. Japan
- 4.3. India
- 4.4. Australia
- 4.5. South Korea
- 4.6. Rest of Asia-Pacific
APAC MRI Systems Industry Segmentation By Geography
- 1. China
- 2. Japan
- 3. India
- 4. Australia
- 5. South Korea
- 6. Rest of Asia Pacific
APAC MRI Systems Industry REPORT HIGHLIGHTS
| Aspects | Details |
|---|---|
| Study Period | 2019-2033 |
| Base Year | 2024 |
| Estimated Year | 2025 |
| Forecast Period | 2025-2033 |
| Historical Period | 2019-2024 |
| Growth Rate | CAGR of 6.46% from 2019-2033 |
| Segmentation |
|
Table of Contents
- 1. Introduction
- 1.1. Research Scope
- 1.2. Market Segmentation
- 1.3. Research Methodology
- 1.4. Definitions and Assumptions
- 2. Executive Summary
- 2.1. Introduction
- 3. Market Dynamics
- 3.1. Introduction
- 3.2. Market Drivers
- 3.2.1. Increasing Burden of Chronic Diseases; Availability of Universal Health Coverage in Several Asian Countries; Introduction of Hybrid MRI Systems & Increasing Adoption in Emerging Asian Markets
- 3.3. Market Restrains
- 3.3.1. High Cost of MRI Systems; Declining Helium Availability
- 3.4. Market Trends
- 3.4.1. Neurology Segment is Expected to Hold Major Market Share and is Believed to Continue the Same Over the Forecast period
- 4. Market Factor Analysis
- 4.1. Porters Five Forces
- 4.2. Supply/Value Chain
- 4.3. PESTEL analysis
- 4.4. Market Entropy
- 4.5. Patent/Trademark Analysis
- 5. Global APAC MRI Systems Industry Analysis, Insights and Forecast, 2019-2031
- 5.1. Market Analysis, Insights and Forecast - by Architecture
- 5.1.1. Closed MRI Systems
- 5.1.2. Open MRI Systems
- 5.2. Market Analysis, Insights and Forecast - by Field Strength
- 5.2.1. Low Field MRI Systems
- 5.2.2. High Field MRI Systems
- 5.2.3. Very Hig
- 5.3. Market Analysis, Insights and Forecast - by Application
- 5.3.1. Oncology
- 5.3.2. Neurology
- 5.3.3. Cardiology
- 5.3.4. Gastroenterology
- 5.3.5. Musculoskeletal
- 5.3.6. Other Applications
- 5.4. Market Analysis, Insights and Forecast - by Geography
- 5.4.1. China
- 5.4.2. Japan
- 5.4.3. India
- 5.4.4. Australia
- 5.4.5. South Korea
- 5.4.6. Rest of Asia-Pacific
- 5.5. Market Analysis, Insights and Forecast - by Region
- 5.5.1. China
- 5.5.2. Japan
- 5.5.3. India
- 5.5.4. Australia
- 5.5.5. South Korea
- 5.5.6. Rest of Asia Pacific
- 5.1. Market Analysis, Insights and Forecast - by Architecture
- 6. China APAC MRI Systems Industry Analysis, Insights and Forecast, 2019-2031
- 6.1. Market Analysis, Insights and Forecast - by Architecture
- 6.1.1. Closed MRI Systems
- 6.1.2. Open MRI Systems
- 6.2. Market Analysis, Insights and Forecast - by Field Strength
- 6.2.1. Low Field MRI Systems
- 6.2.2. High Field MRI Systems
- 6.2.3. Very Hig
- 6.3. Market Analysis, Insights and Forecast - by Application
- 6.3.1. Oncology
- 6.3.2. Neurology
- 6.3.3. Cardiology
- 6.3.4. Gastroenterology
- 6.3.5. Musculoskeletal
- 6.3.6. Other Applications
- 6.4. Market Analysis, Insights and Forecast - by Geography
- 6.4.1. China
- 6.4.2. Japan
- 6.4.3. India
- 6.4.4. Australia
- 6.4.5. South Korea
- 6.4.6. Rest of Asia-Pacific
- 6.1. Market Analysis, Insights and Forecast - by Architecture
- 7. Japan APAC MRI Systems Industry Analysis, Insights and Forecast, 2019-2031
- 7.1. Market Analysis, Insights and Forecast - by Architecture
- 7.1.1. Closed MRI Systems
- 7.1.2. Open MRI Systems
- 7.2. Market Analysis, Insights and Forecast - by Field Strength
- 7.2.1. Low Field MRI Systems
- 7.2.2. High Field MRI Systems
- 7.2.3. Very Hig
- 7.3. Market Analysis, Insights and Forecast - by Application
- 7.3.1. Oncology
- 7.3.2. Neurology
- 7.3.3. Cardiology
- 7.3.4. Gastroenterology
- 7.3.5. Musculoskeletal
- 7.3.6. Other Applications
- 7.4. Market Analysis, Insights and Forecast - by Geography
- 7.4.1. China
- 7.4.2. Japan
- 7.4.3. India
- 7.4.4. Australia
- 7.4.5. South Korea
- 7.4.6. Rest of Asia-Pacific
- 7.1. Market Analysis, Insights and Forecast - by Architecture
- 8. India APAC MRI Systems Industry Analysis, Insights and Forecast, 2019-2031
- 8.1. Market Analysis, Insights and Forecast - by Architecture
- 8.1.1. Closed MRI Systems
- 8.1.2. Open MRI Systems
- 8.2. Market Analysis, Insights and Forecast - by Field Strength
- 8.2.1. Low Field MRI Systems
- 8.2.2. High Field MRI Systems
- 8.2.3. Very Hig
- 8.3. Market Analysis, Insights and Forecast - by Application
- 8.3.1. Oncology
- 8.3.2. Neurology
- 8.3.3. Cardiology
- 8.3.4. Gastroenterology
- 8.3.5. Musculoskeletal
- 8.3.6. Other Applications
- 8.4. Market Analysis, Insights and Forecast - by Geography
- 8.4.1. China
- 8.4.2. Japan
- 8.4.3. India
- 8.4.4. Australia
- 8.4.5. South Korea
- 8.4.6. Rest of Asia-Pacific
- 8.1. Market Analysis, Insights and Forecast - by Architecture
- 9. Australia APAC MRI Systems Industry Analysis, Insights and Forecast, 2019-2031
- 9.1. Market Analysis, Insights and Forecast - by Architecture
- 9.1.1. Closed MRI Systems
- 9.1.2. Open MRI Systems
- 9.2. Market Analysis, Insights and Forecast - by Field Strength
- 9.2.1. Low Field MRI Systems
- 9.2.2. High Field MRI Systems
- 9.2.3. Very Hig
- 9.3. Market Analysis, Insights and Forecast - by Application
- 9.3.1. Oncology
- 9.3.2. Neurology
- 9.3.3. Cardiology
- 9.3.4. Gastroenterology
- 9.3.5. Musculoskeletal
- 9.3.6. Other Applications
- 9.4. Market Analysis, Insights and Forecast - by Geography
- 9.4.1. China
- 9.4.2. Japan
- 9.4.3. India
- 9.4.4. Australia
- 9.4.5. South Korea
- 9.4.6. Rest of Asia-Pacific
- 9.1. Market Analysis, Insights and Forecast - by Architecture
- 10. South Korea APAC MRI Systems Industry Analysis, Insights and Forecast, 2019-2031
- 10.1. Market Analysis, Insights and Forecast - by Architecture
- 10.1.1. Closed MRI Systems
- 10.1.2. Open MRI Systems
- 10.2. Market Analysis, Insights and Forecast - by Field Strength
- 10.2.1. Low Field MRI Systems
- 10.2.2. High Field MRI Systems
- 10.2.3. Very Hig
- 10.3. Market Analysis, Insights and Forecast - by Application
- 10.3.1. Oncology
- 10.3.2. Neurology
- 10.3.3. Cardiology
- 10.3.4. Gastroenterology
- 10.3.5. Musculoskeletal
- 10.3.6. Other Applications
- 10.4. Market Analysis, Insights and Forecast - by Geography
- 10.4.1. China
- 10.4.2. Japan
- 10.4.3. India
- 10.4.4. Australia
- 10.4.5. South Korea
- 10.4.6. Rest of Asia-Pacific
- 10.1. Market Analysis, Insights and Forecast - by Architecture
- 11. Rest of Asia Pacific APAC MRI Systems Industry Analysis, Insights and Forecast, 2019-2031
- 11.1. Market Analysis, Insights and Forecast - by Architecture
- 11.1.1. Closed MRI Systems
- 11.1.2. Open MRI Systems
- 11.2. Market Analysis, Insights and Forecast - by Field Strength
- 11.2.1. Low Field MRI Systems
- 11.2.2. High Field MRI Systems
- 11.2.3. Very Hig
- 11.3. Market Analysis, Insights and Forecast - by Application
- 11.3.1. Oncology
- 11.3.2. Neurology
- 11.3.3. Cardiology
- 11.3.4. Gastroenterology
- 11.3.5. Musculoskeletal
- 11.3.6. Other Applications
- 11.4. Market Analysis, Insights and Forecast - by Geography
- 11.4.1. China
- 11.4.2. Japan
- 11.4.3. India
- 11.4.4. Australia
- 11.4.5. South Korea
- 11.4.6. Rest of Asia-Pacific
- 11.1. Market Analysis, Insights and Forecast - by Architecture
- 12. North America APAC MRI Systems Industry Analysis, Insights and Forecast, 2019-2031
- 12.1. Market Analysis, Insights and Forecast - By Country/Sub-region
- 12.1.1 United States
- 12.1.2 Canada
- 12.1.3 Mexico
- 13. Europe APAC MRI Systems Industry Analysis, Insights and Forecast, 2019-2031
- 13.1. Market Analysis, Insights and Forecast - By Country/Sub-region
- 13.1.1 Germany
- 13.1.2 United Kingdom
- 13.1.3 France
- 13.1.4 Spain
- 13.1.5 Italy
- 13.1.6 Spain
- 13.1.7 Belgium
- 13.1.8 Netherland
- 13.1.9 Nordics
- 13.1.10 Rest of Europe
- 14. Asia Pacific APAC MRI Systems Industry Analysis, Insights and Forecast, 2019-2031
- 14.1. Market Analysis, Insights and Forecast - By Country/Sub-region
- 14.1.1 China
- 14.1.2 Japan
- 14.1.3 India
- 14.1.4 South Korea
- 14.1.5 Southeast Asia
- 14.1.6 Australia
- 14.1.7 Indonesia
- 14.1.8 Phillipes
- 14.1.9 Singapore
- 14.1.10 Thailandc
- 14.1.11 Rest of Asia Pacific
- 15. South America APAC MRI Systems Industry Analysis, Insights and Forecast, 2019-2031
- 15.1. Market Analysis, Insights and Forecast - By Country/Sub-region
- 15.1.1 Brazil
- 15.1.2 Argentina
- 15.1.3 Peru
- 15.1.4 Chile
- 15.1.5 Colombia
- 15.1.6 Ecuador
- 15.1.7 Venezuela
- 15.1.8 Rest of South America
- 16. North America APAC MRI Systems Industry Analysis, Insights and Forecast, 2019-2031
- 16.1. Market Analysis, Insights and Forecast - By Country/Sub-region
- 16.1.1 United States
- 16.1.2 Canada
- 16.1.3 Mexico
- 17. MEA APAC MRI Systems Industry Analysis, Insights and Forecast, 2019-2031
- 17.1. Market Analysis, Insights and Forecast - By Country/Sub-region
- 17.1.1 United Arab Emirates
- 17.1.2 Saudi Arabia
- 17.1.3 South Africa
- 17.1.4 Rest of Middle East and Africa
- 18. Competitive Analysis
- 18.1. Global Market Share Analysis 2024
- 18.2. Company Profiles
- 18.2.1 Shenzhen Anke High-tech Co Ltd
- 18.2.1.1. Overview
- 18.2.1.2. Products
- 18.2.1.3. SWOT Analysis
- 18.2.1.4. Recent Developments
- 18.2.1.5. Financials (Based on Availability)
- 18.2.2 Esaote SpA
- 18.2.2.1. Overview
- 18.2.2.2. Products
- 18.2.2.3. SWOT Analysis
- 18.2.2.4. Recent Developments
- 18.2.2.5. Financials (Based on Availability)
- 18.2.3 GE Healthcare
- 18.2.3.1. Overview
- 18.2.3.2. Products
- 18.2.3.3. SWOT Analysis
- 18.2.3.4. Recent Developments
- 18.2.3.5. Financials (Based on Availability)
- 18.2.4 Beijing Wandong Medical Technology Co Ltd
- 18.2.4.1. Overview
- 18.2.4.2. Products
- 18.2.4.3. SWOT Analysis
- 18.2.4.4. Recent Developments
- 18.2.4.5. Financials (Based on Availability)
- 18.2.5 Fujifilm Corporation
- 18.2.5.1. Overview
- 18.2.5.2. Products
- 18.2.5.3. SWOT Analysis
- 18.2.5.4. Recent Developments
- 18.2.5.5. Financials (Based on Availability)
- 18.2.6 Shenzhen Basda Medical Apparatus Co Ltd
- 18.2.6.1. Overview
- 18.2.6.2. Products
- 18.2.6.3. SWOT Analysis
- 18.2.6.4. Recent Developments
- 18.2.6.5. Financials (Based on Availability)
- 18.2.7 Neusoft Medical Systems Co Ltd
- 18.2.7.1. Overview
- 18.2.7.2. Products
- 18.2.7.3. SWOT Analysis
- 18.2.7.4. Recent Developments
- 18.2.7.5. Financials (Based on Availability)
- 18.2.8 Koninklijke Philips NV
- 18.2.8.1. Overview
- 18.2.8.2. Products
- 18.2.8.3. SWOT Analysis
- 18.2.8.4. Recent Developments
- 18.2.8.5. Financials (Based on Availability)
- 18.2.9 Canon Medical Systems Corporation
- 18.2.9.1. Overview
- 18.2.9.2. Products
- 18.2.9.3. SWOT Analysis
- 18.2.9.4. Recent Developments
- 18.2.9.5. Financials (Based on Availability)
- 18.2.10 Siemens Healthineers*List Not Exhaustive
- 18.2.10.1. Overview
- 18.2.10.2. Products
- 18.2.10.3. SWOT Analysis
- 18.2.10.4. Recent Developments
- 18.2.10.5. Financials (Based on Availability)
- 18.2.1 Shenzhen Anke High-tech Co Ltd
List of Figures
- Figure 1: Global APAC MRI Systems Industry Revenue Breakdown (Million, %) by Region 2024 & 2032
- Figure 2: North America APAC MRI Systems Industry Revenue (Million), by Country 2024 & 2032
- Figure 3: North America APAC MRI Systems Industry Revenue Share (%), by Country 2024 & 2032
- Figure 4: Europe APAC MRI Systems Industry Revenue (Million), by Country 2024 & 2032
- Figure 5: Europe APAC MRI Systems Industry Revenue Share (%), by Country 2024 & 2032
- Figure 6: Asia Pacific APAC MRI Systems Industry Revenue (Million), by Country 2024 & 2032
- Figure 7: Asia Pacific APAC MRI Systems Industry Revenue Share (%), by Country 2024 & 2032
- Figure 8: South America APAC MRI Systems Industry Revenue (Million), by Country 2024 & 2032
- Figure 9: South America APAC MRI Systems Industry Revenue Share (%), by Country 2024 & 2032
- Figure 10: North America APAC MRI Systems Industry Revenue (Million), by Country 2024 & 2032
- Figure 11: North America APAC MRI Systems Industry Revenue Share (%), by Country 2024 & 2032
- Figure 12: MEA APAC MRI Systems Industry Revenue (Million), by Country 2024 & 2032
- Figure 13: MEA APAC MRI Systems Industry Revenue Share (%), by Country 2024 & 2032
- Figure 14: China APAC MRI Systems Industry Revenue (Million), by Architecture 2024 & 2032
- Figure 15: China APAC MRI Systems Industry Revenue Share (%), by Architecture 2024 & 2032
- Figure 16: China APAC MRI Systems Industry Revenue (Million), by Field Strength 2024 & 2032
- Figure 17: China APAC MRI Systems Industry Revenue Share (%), by Field Strength 2024 & 2032
- Figure 18: China APAC MRI Systems Industry Revenue (Million), by Application 2024 & 2032
- Figure 19: China APAC MRI Systems Industry Revenue Share (%), by Application 2024 & 2032
- Figure 20: China APAC MRI Systems Industry Revenue (Million), by Geography 2024 & 2032
- Figure 21: China APAC MRI Systems Industry Revenue Share (%), by Geography 2024 & 2032
- Figure 22: China APAC MRI Systems Industry Revenue (Million), by Country 2024 & 2032
- Figure 23: China APAC MRI Systems Industry Revenue Share (%), by Country 2024 & 2032
- Figure 24: Japan APAC MRI Systems Industry Revenue (Million), by Architecture 2024 & 2032
- Figure 25: Japan APAC MRI Systems Industry Revenue Share (%), by Architecture 2024 & 2032
- Figure 26: Japan APAC MRI Systems Industry Revenue (Million), by Field Strength 2024 & 2032
- Figure 27: Japan APAC MRI Systems Industry Revenue Share (%), by Field Strength 2024 & 2032
- Figure 28: Japan APAC MRI Systems Industry Revenue (Million), by Application 2024 & 2032
- Figure 29: Japan APAC MRI Systems Industry Revenue Share (%), by Application 2024 & 2032
- Figure 30: Japan APAC MRI Systems Industry Revenue (Million), by Geography 2024 & 2032
- Figure 31: Japan APAC MRI Systems Industry Revenue Share (%), by Geography 2024 & 2032
- Figure 32: Japan APAC MRI Systems Industry Revenue (Million), by Country 2024 & 2032
- Figure 33: Japan APAC MRI Systems Industry Revenue Share (%), by Country 2024 & 2032
- Figure 34: India APAC MRI Systems Industry Revenue (Million), by Architecture 2024 & 2032
- Figure 35: India APAC MRI Systems Industry Revenue Share (%), by Architecture 2024 & 2032
- Figure 36: India APAC MRI Systems Industry Revenue (Million), by Field Strength 2024 & 2032
- Figure 37: India APAC MRI Systems Industry Revenue Share (%), by Field Strength 2024 & 2032
- Figure 38: India APAC MRI Systems Industry Revenue (Million), by Application 2024 & 2032
- Figure 39: India APAC MRI Systems Industry Revenue Share (%), by Application 2024 & 2032
- Figure 40: India APAC MRI Systems Industry Revenue (Million), by Geography 2024 & 2032
- Figure 41: India APAC MRI Systems Industry Revenue Share (%), by Geography 2024 & 2032
- Figure 42: India APAC MRI Systems Industry Revenue (Million), by Country 2024 & 2032
- Figure 43: India APAC MRI Systems Industry Revenue Share (%), by Country 2024 & 2032
- Figure 44: Australia APAC MRI Systems Industry Revenue (Million), by Architecture 2024 & 2032
- Figure 45: Australia APAC MRI Systems Industry Revenue Share (%), by Architecture 2024 & 2032
- Figure 46: Australia APAC MRI Systems Industry Revenue (Million), by Field Strength 2024 & 2032
- Figure 47: Australia APAC MRI Systems Industry Revenue Share (%), by Field Strength 2024 & 2032
- Figure 48: Australia APAC MRI Systems Industry Revenue (Million), by Application 2024 & 2032
- Figure 49: Australia APAC MRI Systems Industry Revenue Share (%), by Application 2024 & 2032
- Figure 50: Australia APAC MRI Systems Industry Revenue (Million), by Geography 2024 & 2032
- Figure 51: Australia APAC MRI Systems Industry Revenue Share (%), by Geography 2024 & 2032
- Figure 52: Australia APAC MRI Systems Industry Revenue (Million), by Country 2024 & 2032
- Figure 53: Australia APAC MRI Systems Industry Revenue Share (%), by Country 2024 & 2032
- Figure 54: South Korea APAC MRI Systems Industry Revenue (Million), by Architecture 2024 & 2032
- Figure 55: South Korea APAC MRI Systems Industry Revenue Share (%), by Architecture 2024 & 2032
- Figure 56: South Korea APAC MRI Systems Industry Revenue (Million), by Field Strength 2024 & 2032
- Figure 57: South Korea APAC MRI Systems Industry Revenue Share (%), by Field Strength 2024 & 2032
- Figure 58: South Korea APAC MRI Systems Industry Revenue (Million), by Application 2024 & 2032
- Figure 59: South Korea APAC MRI Systems Industry Revenue Share (%), by Application 2024 & 2032
- Figure 60: South Korea APAC MRI Systems Industry Revenue (Million), by Geography 2024 & 2032
- Figure 61: South Korea APAC MRI Systems Industry Revenue Share (%), by Geography 2024 & 2032
- Figure 62: South Korea APAC MRI Systems Industry Revenue (Million), by Country 2024 & 2032
- Figure 63: South Korea APAC MRI Systems Industry Revenue Share (%), by Country 2024 & 2032
- Figure 64: Rest of Asia Pacific APAC MRI Systems Industry Revenue (Million), by Architecture 2024 & 2032
- Figure 65: Rest of Asia Pacific APAC MRI Systems Industry Revenue Share (%), by Architecture 2024 & 2032
- Figure 66: Rest of Asia Pacific APAC MRI Systems Industry Revenue (Million), by Field Strength 2024 & 2032
- Figure 67: Rest of Asia Pacific APAC MRI Systems Industry Revenue Share (%), by Field Strength 2024 & 2032
- Figure 68: Rest of Asia Pacific APAC MRI Systems Industry Revenue (Million), by Application 2024 & 2032
- Figure 69: Rest of Asia Pacific APAC MRI Systems Industry Revenue Share (%), by Application 2024 & 2032
- Figure 70: Rest of Asia Pacific APAC MRI Systems Industry Revenue (Million), by Geography 2024 & 2032
- Figure 71: Rest of Asia Pacific APAC MRI Systems Industry Revenue Share (%), by Geography 2024 & 2032
- Figure 72: Rest of Asia Pacific APAC MRI Systems Industry Revenue (Million), by Country 2024 & 2032
- Figure 73: Rest of Asia Pacific APAC MRI Systems Industry Revenue Share (%), by Country 2024 & 2032
List of Tables
- Table 1: Global APAC MRI Systems Industry Revenue Million Forecast, by Region 2019 & 2032
- Table 2: Global APAC MRI Systems Industry Revenue Million Forecast, by Architecture 2019 & 2032
- Table 3: Global APAC MRI Systems Industry Revenue Million Forecast, by Field Strength 2019 & 2032
- Table 4: Global APAC MRI Systems Industry Revenue Million Forecast, by Application 2019 & 2032
- Table 5: Global APAC MRI Systems Industry Revenue Million Forecast, by Geography 2019 & 2032
- Table 6: Global APAC MRI Systems Industry Revenue Million Forecast, by Region 2019 & 2032
- Table 7: Global APAC MRI Systems Industry Revenue Million Forecast, by Country 2019 & 2032
- Table 8: United States APAC MRI Systems Industry Revenue (Million) Forecast, by Application 2019 & 2032
- Table 9: Canada APAC MRI Systems Industry Revenue (Million) Forecast, by Application 2019 & 2032
- Table 10: Mexico APAC MRI Systems Industry Revenue (Million) Forecast, by Application 2019 & 2032
- Table 11: Global APAC MRI Systems Industry Revenue Million Forecast, by Country 2019 & 2032
- Table 12: Germany APAC MRI Systems Industry Revenue (Million) Forecast, by Application 2019 & 2032
- Table 13: United Kingdom APAC MRI Systems Industry Revenue (Million) Forecast, by Application 2019 & 2032
- Table 14: France APAC MRI Systems Industry Revenue (Million) Forecast, by Application 2019 & 2032
- Table 15: Spain APAC MRI Systems Industry Revenue (Million) Forecast, by Application 2019 & 2032
- Table 16: Italy APAC MRI Systems Industry Revenue (Million) Forecast, by Application 2019 & 2032
- Table 17: Spain APAC MRI Systems Industry Revenue (Million) Forecast, by Application 2019 & 2032
- Table 18: Belgium APAC MRI Systems Industry Revenue (Million) Forecast, by Application 2019 & 2032
- Table 19: Netherland APAC MRI Systems Industry Revenue (Million) Forecast, by Application 2019 & 2032
- Table 20: Nordics APAC MRI Systems Industry Revenue (Million) Forecast, by Application 2019 & 2032
- Table 21: Rest of Europe APAC MRI Systems Industry Revenue (Million) Forecast, by Application 2019 & 2032
- Table 22: Global APAC MRI Systems Industry Revenue Million Forecast, by Country 2019 & 2032
- Table 23: China APAC MRI Systems Industry Revenue (Million) Forecast, by Application 2019 & 2032
- Table 24: Japan APAC MRI Systems Industry Revenue (Million) Forecast, by Application 2019 & 2032
- Table 25: India APAC MRI Systems Industry Revenue (Million) Forecast, by Application 2019 & 2032
- Table 26: South Korea APAC MRI Systems Industry Revenue (Million) Forecast, by Application 2019 & 2032
- Table 27: Southeast Asia APAC MRI Systems Industry Revenue (Million) Forecast, by Application 2019 & 2032
- Table 28: Australia APAC MRI Systems Industry Revenue (Million) Forecast, by Application 2019 & 2032
- Table 29: Indonesia APAC MRI Systems Industry Revenue (Million) Forecast, by Application 2019 & 2032
- Table 30: Phillipes APAC MRI Systems Industry Revenue (Million) Forecast, by Application 2019 & 2032
- Table 31: Singapore APAC MRI Systems Industry Revenue (Million) Forecast, by Application 2019 & 2032
- Table 32: Thailandc APAC MRI Systems Industry Revenue (Million) Forecast, by Application 2019 & 2032
- Table 33: Rest of Asia Pacific APAC MRI Systems Industry Revenue (Million) Forecast, by Application 2019 & 2032
- Table 34: Global APAC MRI Systems Industry Revenue Million Forecast, by Country 2019 & 2032
- Table 35: Brazil APAC MRI Systems Industry Revenue (Million) Forecast, by Application 2019 & 2032
- Table 36: Argentina APAC MRI Systems Industry Revenue (Million) Forecast, by Application 2019 & 2032
- Table 37: Peru APAC MRI Systems Industry Revenue (Million) Forecast, by Application 2019 & 2032
- Table 38: Chile APAC MRI Systems Industry Revenue (Million) Forecast, by Application 2019 & 2032
- Table 39: Colombia APAC MRI Systems Industry Revenue (Million) Forecast, by Application 2019 & 2032
- Table 40: Ecuador APAC MRI Systems Industry Revenue (Million) Forecast, by Application 2019 & 2032
- Table 41: Venezuela APAC MRI Systems Industry Revenue (Million) Forecast, by Application 2019 & 2032
- Table 42: Rest of South America APAC MRI Systems Industry Revenue (Million) Forecast, by Application 2019 & 2032
- Table 43: Global APAC MRI Systems Industry Revenue Million Forecast, by Country 2019 & 2032
- Table 44: United States APAC MRI Systems Industry Revenue (Million) Forecast, by Application 2019 & 2032
- Table 45: Canada APAC MRI Systems Industry Revenue (Million) Forecast, by Application 2019 & 2032
- Table 46: Mexico APAC MRI Systems Industry Revenue (Million) Forecast, by Application 2019 & 2032
- Table 47: Global APAC MRI Systems Industry Revenue Million Forecast, by Country 2019 & 2032
- Table 48: United Arab Emirates APAC MRI Systems Industry Revenue (Million) Forecast, by Application 2019 & 2032
- Table 49: Saudi Arabia APAC MRI Systems Industry Revenue (Million) Forecast, by Application 2019 & 2032
- Table 50: South Africa APAC MRI Systems Industry Revenue (Million) Forecast, by Application 2019 & 2032
- Table 51: Rest of Middle East and Africa APAC MRI Systems Industry Revenue (Million) Forecast, by Application 2019 & 2032
- Table 52: Global APAC MRI Systems Industry Revenue Million Forecast, by Architecture 2019 & 2032
- Table 53: Global APAC MRI Systems Industry Revenue Million Forecast, by Field Strength 2019 & 2032
- Table 54: Global APAC MRI Systems Industry Revenue Million Forecast, by Application 2019 & 2032
- Table 55: Global APAC MRI Systems Industry Revenue Million Forecast, by Geography 2019 & 2032
- Table 56: Global APAC MRI Systems Industry Revenue Million Forecast, by Country 2019 & 2032
- Table 57: Global APAC MRI Systems Industry Revenue Million Forecast, by Architecture 2019 & 2032
- Table 58: Global APAC MRI Systems Industry Revenue Million Forecast, by Field Strength 2019 & 2032
- Table 59: Global APAC MRI Systems Industry Revenue Million Forecast, by Application 2019 & 2032
- Table 60: Global APAC MRI Systems Industry Revenue Million Forecast, by Geography 2019 & 2032
- Table 61: Global APAC MRI Systems Industry Revenue Million Forecast, by Country 2019 & 2032
- Table 62: Global APAC MRI Systems Industry Revenue Million Forecast, by Architecture 2019 & 2032
- Table 63: Global APAC MRI Systems Industry Revenue Million Forecast, by Field Strength 2019 & 2032
- Table 64: Global APAC MRI Systems Industry Revenue Million Forecast, by Application 2019 & 2032
- Table 65: Global APAC MRI Systems Industry Revenue Million Forecast, by Geography 2019 & 2032
- Table 66: Global APAC MRI Systems Industry Revenue Million Forecast, by Country 2019 & 2032
- Table 67: Global APAC MRI Systems Industry Revenue Million Forecast, by Architecture 2019 & 2032
- Table 68: Global APAC MRI Systems Industry Revenue Million Forecast, by Field Strength 2019 & 2032
- Table 69: Global APAC MRI Systems Industry Revenue Million Forecast, by Application 2019 & 2032
- Table 70: Global APAC MRI Systems Industry Revenue Million Forecast, by Geography 2019 & 2032
- Table 71: Global APAC MRI Systems Industry Revenue Million Forecast, by Country 2019 & 2032
- Table 72: Global APAC MRI Systems Industry Revenue Million Forecast, by Architecture 2019 & 2032
- Table 73: Global APAC MRI Systems Industry Revenue Million Forecast, by Field Strength 2019 & 2032
- Table 74: Global APAC MRI Systems Industry Revenue Million Forecast, by Application 2019 & 2032
- Table 75: Global APAC MRI Systems Industry Revenue Million Forecast, by Geography 2019 & 2032
- Table 76: Global APAC MRI Systems Industry Revenue Million Forecast, by Country 2019 & 2032
- Table 77: Global APAC MRI Systems Industry Revenue Million Forecast, by Architecture 2019 & 2032
- Table 78: Global APAC MRI Systems Industry Revenue Million Forecast, by Field Strength 2019 & 2032
- Table 79: Global APAC MRI Systems Industry Revenue Million Forecast, by Application 2019 & 2032
- Table 80: Global APAC MRI Systems Industry Revenue Million Forecast, by Geography 2019 & 2032
- Table 81: Global APAC MRI Systems Industry Revenue Million Forecast, by Country 2019 & 2032
Frequently Asked Questions
1. What is the projected Compound Annual Growth Rate (CAGR) of the APAC MRI Systems Industry?
The projected CAGR is approximately 6.46%.
2. Which companies are prominent players in the APAC MRI Systems Industry?
Key companies in the market include Shenzhen Anke High-tech Co Ltd, Esaote SpA, GE Healthcare, Beijing Wandong Medical Technology Co Ltd, Fujifilm Corporation, Shenzhen Basda Medical Apparatus Co Ltd, Neusoft Medical Systems Co Ltd, Koninklijke Philips NV, Canon Medical Systems Corporation, Siemens Healthineers*List Not Exhaustive.
3. What are the main segments of the APAC MRI Systems Industry?
The market segments include Architecture, Field Strength, Application, Geography.
4. Can you provide details about the market size?
The market size is estimated to be USD 2.15 Million as of 2022.
5. What are some drivers contributing to market growth?
Increasing Burden of Chronic Diseases; Availability of Universal Health Coverage in Several Asian Countries; Introduction of Hybrid MRI Systems & Increasing Adoption in Emerging Asian Markets.
6. What are the notable trends driving market growth?
Neurology Segment is Expected to Hold Major Market Share and is Believed to Continue the Same Over the Forecast period.
7. Are there any restraints impacting market growth?
High Cost of MRI Systems; Declining Helium Availability.
8. Can you provide examples of recent developments in the market?
March 2022: Siemens installed its MRI Scanner at North Eastern Community Hospital in the Benson Radiology department in South Australia.
9. What pricing options are available for accessing the report?
Pricing options include single-user, multi-user, and enterprise licenses priced at USD 4750, USD 5250, and USD 8750 respectively.
10. Is the market size provided in terms of value or volume?
The market size is provided in terms of value, measured in Million.
11. Are there any specific market keywords associated with the report?
Yes, the market keyword associated with the report is "APAC MRI Systems Industry," which aids in identifying and referencing the specific market segment covered.
12. How do I determine which pricing option suits my needs best?
The pricing options vary based on user requirements and access needs. Individual users may opt for single-user licenses, while businesses requiring broader access may choose multi-user or enterprise licenses for cost-effective access to the report.
13. Are there any additional resources or data provided in the APAC MRI Systems Industry report?
While the report offers comprehensive insights, it's advisable to review the specific contents or supplementary materials provided to ascertain if additional resources or data are available.
14. How can I stay updated on further developments or reports in the APAC MRI Systems Industry?
To stay informed about further developments, trends, and reports in the APAC MRI Systems Industry, consider subscribing to industry newsletters, following relevant companies and organizations, or regularly checking reputable industry news sources and publications.
Methodology
Step 1 - Identification of Relevant Samples Size from Population Database


Step 2 - Approaches for Defining Global Market Size (Value, Volume* & Price*)

Note*: In applicable scenarios
Step 3 - Data Sources
Primary Research
- Web Analytics
- Survey Reports
- Research Institute
- Latest Research Reports
- Opinion Leaders
Secondary Research
- Annual Reports
- White Paper
- Latest Press Release
- Industry Association
- Paid Database
- Investor Presentations

Step 4 - Data Triangulation
Involves using different sources of information in order to increase the validity of a study
These sources are likely to be stakeholders in a program - participants, other researchers, program staff, other community members, and so on.
Then we put all data in single framework & apply various statistical tools to find out the dynamic on the market.
During the analysis stage, feedback from the stakeholder groups would be compared to determine areas of agreement as well as areas of divergence


