
Key Insights
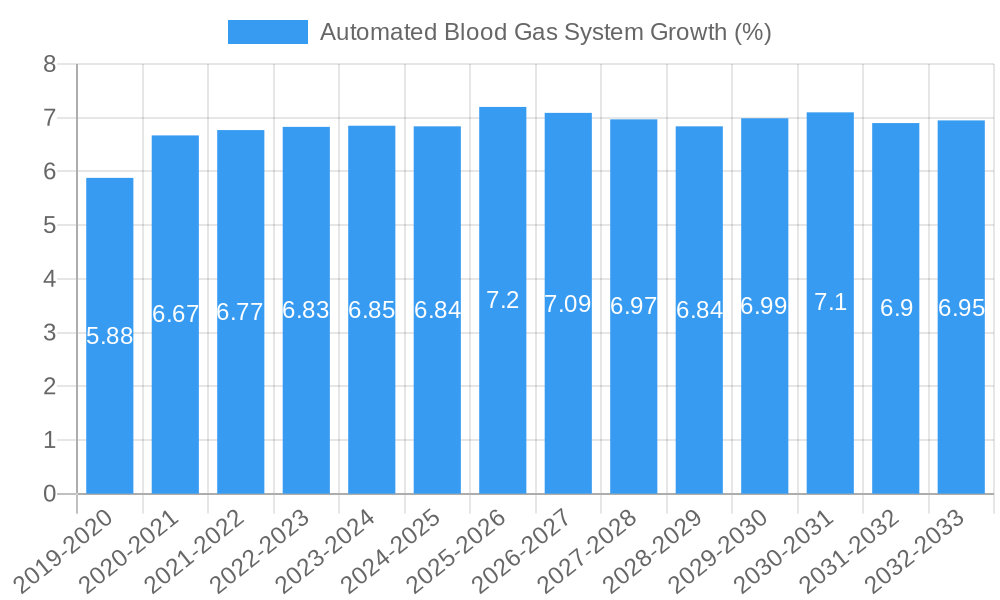
The global Automated Blood Gas System market is projected to reach approximately USD 2.5 billion by 2025, exhibiting a robust Compound Annual Growth Rate (CAGR) of around 7.5% throughout the forecast period of 2025-2033. This significant expansion is primarily fueled by the increasing prevalence of chronic respiratory diseases, cardiovascular conditions, and sepsis, all of which necessitate frequent and accurate blood gas analysis. The growing demand for point-of-care testing solutions, driven by the need for rapid diagnostic results in emergency settings and critical care units, further propels market growth. Furthermore, advancements in technology, leading to more sophisticated, automated, and user-friendly blood gas analyzers with integrated features like artificial intelligence for data interpretation, are enhancing adoption rates across healthcare facilities. The expanding healthcare infrastructure in emerging economies and the rising healthcare expenditure are also key contributors to the market's positive trajectory.
The market is segmented into Dry Blood Gas Systems and Wet Blood Gas Systems, with Dry Blood Gas Systems anticipated to witness higher growth due to their ease of use, reduced maintenance, and improved accuracy in various clinical environments. Hospitals and Clinics represent the largest application segment, followed by Ambulatory Surgical Centers (ASCs), as these settings are at the forefront of critical patient care and routine diagnostics. Key market players like Siemens Healthineers, Werfen, Abbott, and Roche are continuously investing in research and development to introduce innovative products and expand their market reach through strategic collaborations and acquisitions. However, the market faces certain restraints, including the high initial cost of advanced automated systems and the stringent regulatory approvals required for medical devices. Despite these challenges, the persistent need for timely and precise blood gas monitoring in managing patient outcomes ensures sustained market growth and innovation.
Automated Blood Gas System Market Concentration & Innovation
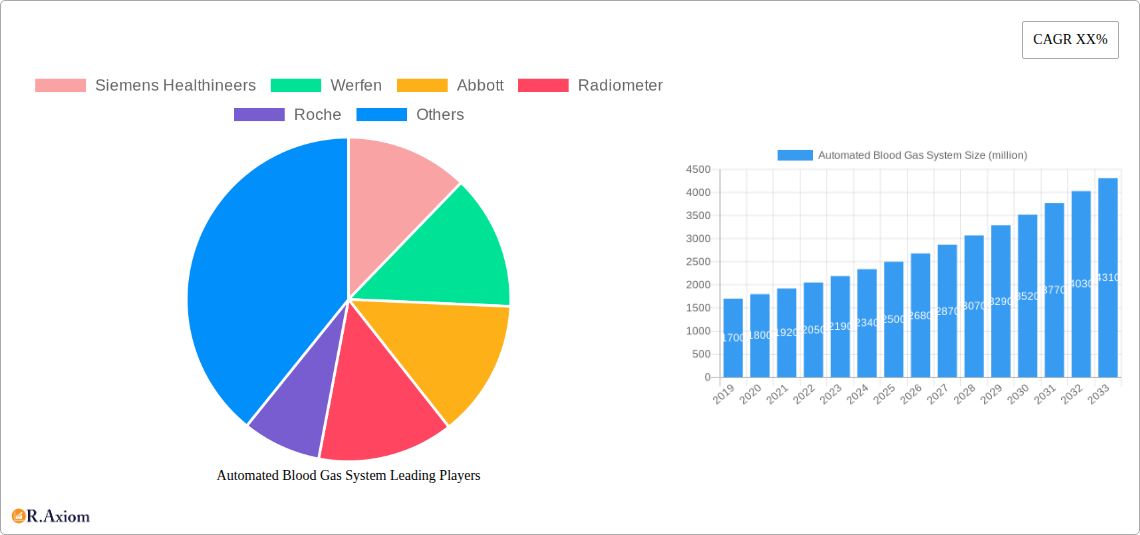
The global Automated Blood Gas System market exhibits a moderate to high concentration, with key players like Siemens Healthineers, Werfen, Abbott, Radiometer, and Roche dominating a substantial market share, estimated to be over 80 million. Innovation is primarily driven by the pursuit of enhanced accuracy, faster turnaround times, and point-of-care (POC) applications. Regulatory frameworks, particularly those from the FDA and EMA, play a crucial role in market entry and product development, ensuring patient safety and device efficacy. Product substitutes, while present in manual blood gas analysis, are increasingly being sidelined by the efficiency and automation offered by these systems. End-user trends show a strong preference for integrated solutions that offer comprehensive diagnostic capabilities beyond just blood gas parameters, including electrolytes and metabolites. Mergers and acquisitions (M&A) activities are strategic for market expansion and technology acquisition, with recent deals valued in the hundreds of millions. For instance, a recent acquisition in the POC diagnostics space by a leading player was estimated at 500 million.
- Market Share Leaders: Siemens Healthineers, Werfen, Abbott, Radiometer, Roche
- Innovation Drivers: POC integration, multi-parameter testing, AI-driven diagnostics, miniaturization
- Regulatory Bodies: FDA, EMA, regional health authorities
- End-User Preferences: Speed, accuracy, ease of use, cost-effectiveness, connectivity
- M&A Trends: Focus on POC technologies, expanding test menus, geographic reach.
Automated Blood Gas System Industry Trends & Insights
The Automated Blood Gas System market is poised for significant expansion, driven by a confluence of factors that underscore the growing importance of rapid and accurate diagnostic testing. The global market is projected to witness a Compound Annual Growth Rate (CAGR) of approximately 7.5% over the forecast period of 2025–2033. This robust growth is fueled by an increasing prevalence of chronic respiratory diseases, cardiovascular conditions, and critical care needs, all of which necessitate frequent blood gas analysis. Technological advancements are at the forefront of this evolution. The development of smaller, more portable, and user-friendly analyzers is facilitating wider adoption in point-of-care settings, including emergency departments, intensive care units (ICUs), and even ambulances, thereby improving patient outcomes through immediate diagnostic insights.
Furthermore, the integration of sophisticated software and connectivity features is revolutionizing workflow efficiency. Automated Blood Gas Systems are increasingly equipped with capabilities for data management, seamless integration with Electronic Health Records (EHRs), and remote monitoring, which are critical for healthcare providers managing large patient volumes. Consumer preferences are shifting towards systems that offer a comprehensive menu of tests beyond just blood gases, including electrolytes, metabolites, and co-oximetry. This trend encourages manufacturers to develop multi-parameter analyzers that can provide a more holistic view of a patient's physiological status from a single sample, reducing the need for multiple tests and sample draws. The competitive landscape is characterized by intense innovation and strategic partnerships. Leading companies are investing heavily in research and development to introduce next-generation analyzers that offer improved precision, reduced reagent consumption, and lower operational costs. The market penetration of these advanced systems is expected to rise significantly as healthcare institutions prioritize efficiency and evidence-based medicine. The growing demand in emerging economies, driven by improving healthcare infrastructure and increasing medical tourism, is also a key growth driver.
Dominant Markets & Segments in Automated Blood Gas System
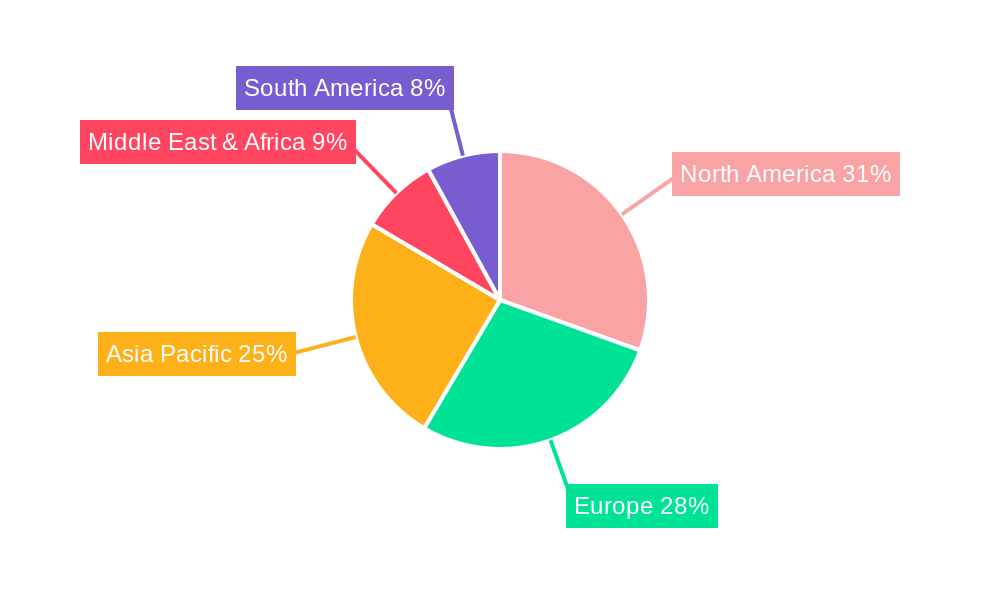
The global Automated Blood Gas System market showcases a distinct dominance in certain regions and segments, driven by a combination of healthcare infrastructure, disease burden, and economic factors. North America, particularly the United States, currently holds the largest market share, estimated at over 3.5 billion in the base year of 2025. This dominance is attributed to a well-established healthcare system, high per capita healthcare spending, a significant aging population susceptible to respiratory and cardiovascular diseases, and early adoption of advanced medical technologies. The presence of major market players and robust research and development activities further solidify its leading position.
Application Segment Dominance:
- Hospitals and Clinics: This segment is the largest and most influential, accounting for an estimated 75% of the market revenue in 2025, projected to reach 9.5 billion by 2033.
- Key Drivers: High patient volumes, critical care settings (ICUs, ERs), demand for continuous monitoring, availability of advanced infrastructure, and reimbursement policies favouring diagnostic testing. The increasing number of hospital beds, estimated at over 15 million globally, directly correlates with the demand for automated blood gas analysis within these institutions.
- Ambulatory Surgical Centers (ASCs): While a smaller segment, ASCs represent a rapidly growing area, with an estimated market size of 700 million in 2025, projected to reach 1.5 billion by 2033.
- Key Drivers: Increasing shift of surgical procedures from hospitals to outpatient settings, demand for rapid diagnostic results to facilitate patient discharge, and cost-effectiveness initiatives driving adoption of point-of-care solutions. The number of ASCs is growing by approximately 5% annually.
- Others (including Homecare and Diagnostic Labs): This segment, estimated at 500 million in 2025, is expected to witness moderate growth.
- Key Drivers: Growing interest in home monitoring for patients with chronic conditions, expansion of reference laboratories, and increasing research applications.
Type Segment Dominance:
- Wet Blood Gas System: Currently the dominant type, accounting for an estimated 65% of the market share, valued at 4.2 billion in 2025.
- Key Drivers: Established technology, comprehensive test menus, high accuracy, and proven reliability in hospital settings. The installed base of wet blood gas systems represents a significant portion of the current market.
- Dry Blood Gas System: This segment is experiencing faster growth and is projected to capture a larger market share in the coming years, estimated at 2.3 billion in 2025, with a projected CAGR of 8.5%.
- Key Drivers: Advancements in dry reagent technology, improved portability, reduced maintenance, and suitability for point-of-care applications and decentralized testing. The simplicity of use and waste reduction associated with dry systems are increasingly attractive.
Automated Blood Gas System Product Developments
The Automated Blood Gas System market is characterized by continuous innovation aimed at enhancing diagnostic capabilities and operational efficiency. Recent product developments focus on miniaturization for point-of-care (POC) testing, enabling faster turnaround times and improved patient management in diverse clinical settings. Many new systems offer multi-parameter testing, integrating electrolytes, metabolites, and co-oximetry alongside blood gases on a single platform. This comprehensive approach provides clinicians with a more complete physiological picture from a single blood sample, reducing the need for repeat draws and streamlining diagnostic workflows. Furthermore, advancements in connectivity and data management are enabling seamless integration with electronic health records (EHRs) and hospital information systems (HIS), facilitating better data analysis, quality control, and remote monitoring. These innovations enhance accuracy, reduce user error, and ultimately contribute to improved patient outcomes and cost-effectiveness in healthcare delivery.
Report Scope & Segmentation Analysis
This comprehensive market research report delves into the global Automated Blood Gas System market, providing an in-depth analysis of its current state and future trajectory. The report segments the market based on crucial parameters to offer detailed insights into regional performance, application-specific demand, and technological preferences. The study encompasses the historical period from 2019 to 2024, with 2025 serving as the base and estimated year, and forecasts market dynamics through 2033.
Application Segmentation: The market is segmented into Hospitals and Clinics, Ambulatory Surgical Centers (ASCs), and Others. Hospitals and clinics represent the largest segment due to high patient volumes and critical care needs. ASCs are a rapidly growing segment, driven by the shift towards outpatient procedures. The "Others" segment includes diagnostic laboratories and emerging homecare applications, each with distinct growth drivers and competitive dynamics.
Type Segmentation: The report further categorizes the market into Dry Blood Gas Systems and Wet Blood Gas Systems. While Wet Blood Gas Systems currently hold a dominant share due to their established technology and comprehensive features, Dry Blood Gas Systems are experiencing accelerated growth due to their portability, ease of use, and suitability for point-of-care settings.
Key Drivers of Automated Blood Gas System Growth
The Automated Blood Gas System market is propelled by several significant growth drivers. The increasing prevalence of chronic respiratory diseases, cardiovascular disorders, and sepsis worldwide necessitates continuous and accurate monitoring of blood gas parameters, directly fueling demand. Technological advancements, particularly in point-of-care (POC) testing, are a major catalyst. Miniaturized, portable analyzers are enabling faster diagnoses in emergency rooms, ICUs, and even remote settings, improving patient outcomes. The growing emphasis on efficient healthcare delivery and cost containment encourages the adoption of automated systems that reduce labor costs and improve workflow efficiency. Furthermore, the aging global population, a demographic segment more prone to critical illnesses requiring blood gas analysis, is a persistent driver of market growth. Supportive government initiatives and increasing healthcare expenditure in emerging economies are also contributing to market expansion.
Challenges in the Automated Blood Gas System Sector
Despite its promising growth, the Automated Blood Gas System sector faces several challenges. The high initial cost of advanced automated analyzers can be a significant barrier, particularly for smaller healthcare facilities or those in resource-limited regions. Stringent regulatory approval processes for new devices, though essential for patient safety, can prolong time-to-market and increase development costs. The need for skilled personnel to operate and maintain sophisticated equipment, as well as ensure proper calibration and quality control, presents another challenge, especially in areas with a shortage of trained laboratory professionals. Furthermore, the market is subject to intense competition, driving down profit margins for some product segments. Supply chain disruptions, as experienced globally in recent years, can impact the availability of essential reagents and components, potentially affecting manufacturing and distribution timelines.
Emerging Opportunities in Automated Blood Gas System
Several emerging opportunities are set to shape the future of the Automated Blood Gas System market. The rapid expansion of point-of-care (POC) testing beyond traditional hospital settings presents a significant growth avenue, including its use in ambulance services, physician offices, and even remote patient monitoring. The integration of artificial intelligence (AI) and machine learning (ML) in these systems offers potential for predictive diagnostics, enhanced data analysis, and personalized treatment recommendations. The development of novel, more cost-effective dry reagent technologies is expected to drive further adoption of dry blood gas systems, especially in decentralized testing environments. Growing demand for comprehensive, multi-parameter testing platforms that include electrolytes, metabolites, and co-oximetry on a single analyzer presents an opportunity for manufacturers to expand their product offerings and cater to evolving clinical needs. Finally, the increasing focus on managing chronic diseases in both hospital and homecare settings opens doors for specialized, user-friendly automated blood gas monitoring solutions.
Leading Players in the Automated Blood Gas System Market
Siemens Healthineers Werfen Abbott Radiometer Roche IDEXX Laboratories Sensa Core Labtron Equipment DALKO Diagnostics LeanGene
Key Developments in Automated Blood Gas System Industry
- 2023/10: Siemens Healthineers launches a new generation of blood gas analyzers with enhanced connectivity and improved user interface.
- 2023/07: Werfen acquires a leading provider of diagnostic software solutions to further strengthen its integrated offerings.
- 2022/12: Abbott receives FDA clearance for an expanded menu on its point-of-care blood gas analyzer.
- 2022/08: Radiometer introduces a new dry blood gas system designed for enhanced portability and ease of use in various clinical settings.
- 2021/05: Roche announces strategic partnerships to integrate its blood gas testing solutions with hospital information systems.
- 2021/02: IDEXX Laboratories focuses on expanding its veterinary diagnostics portfolio, including automated blood gas analysis.
- 2020/11: Sensa Core introduces innovative sensor technology aimed at improving the accuracy and longevity of blood gas analyzers.
- 2020/06: Labtron Equipment expands its distribution network for automated blood gas systems in emerging markets.
- 2019/10: DALKO Diagnostics unveils a compact, benchtop blood gas analyzer suitable for smaller clinics and laboratories.
Strategic Outlook for Automated Blood Gas System Market
The strategic outlook for the Automated Blood Gas System market is exceptionally positive, driven by relentless technological innovation and an ever-increasing demand for rapid, accurate diagnostic testing. The market is expected to witness sustained growth, with a strong emphasis on point-of-care (POC) applications that empower healthcare professionals with immediate patient insights. Future growth catalysts include the development of AI-integrated systems for predictive analytics, the expansion of multi-parameter testing capabilities on single platforms, and the increasing adoption of cost-effective dry blood gas technologies. Strategic collaborations, mergers, and acquisitions will continue to play a pivotal role in consolidating market share and expanding technological portfolios. As healthcare systems worldwide prioritize efficiency, accuracy, and decentralized testing, the Automated Blood Gas System market is well-positioned to evolve and address critical diagnostic needs across a broad spectrum of healthcare settings.
Automated Blood Gas System Segmentation
-
1. Application
- 1.1. Hospitals and Clinics
- 1.2. Ambulatory Surgical Centers (ASC)
- 1.3. Others
-
2. Types
- 2.1. Dry Blood Gas System
- 2.2. Wet Blood Gas System
Automated Blood Gas System Segmentation By Geography
-
1. North America
- 1.1. United States
- 1.2. Canada
- 1.3. Mexico
-
2. South America
- 2.1. Brazil
- 2.2. Argentina
- 2.3. Rest of South America
-
3. Europe
- 3.1. United Kingdom
- 3.2. Germany
- 3.3. France
- 3.4. Italy
- 3.5. Spain
- 3.6. Russia
- 3.7. Benelux
- 3.8. Nordics
- 3.9. Rest of Europe
-
4. Middle East & Africa
- 4.1. Turkey
- 4.2. Israel
- 4.3. GCC
- 4.4. North Africa
- 4.5. South Africa
- 4.6. Rest of Middle East & Africa
-
5. Asia Pacific
- 5.1. China
- 5.2. India
- 5.3. Japan
- 5.4. South Korea
- 5.5. ASEAN
- 5.6. Oceania
- 5.7. Rest of Asia Pacific
Automated Blood Gas System REPORT HIGHLIGHTS
| Aspects | Details |
|---|---|
| Study Period | 2019-2033 |
| Base Year | 2024 |
| Estimated Year | 2025 |
| Forecast Period | 2025-2033 |
| Historical Period | 2019-2024 |
| Growth Rate | CAGR of XX% from 2019-2033 |
| Segmentation |
|
Table of Contents
- 1. Introduction
- 1.1. Research Scope
- 1.2. Market Segmentation
- 1.3. Research Methodology
- 1.4. Definitions and Assumptions
- 2. Executive Summary
- 2.1. Introduction
- 3. Market Dynamics
- 3.1. Introduction
- 3.2. Market Drivers
- 3.3. Market Restrains
- 3.4. Market Trends
- 4. Market Factor Analysis
- 4.1. Porters Five Forces
- 4.2. Supply/Value Chain
- 4.3. PESTEL analysis
- 4.4. Market Entropy
- 4.5. Patent/Trademark Analysis
- 5. Global Automated Blood Gas System Analysis, Insights and Forecast, 2019-2031
- 5.1. Market Analysis, Insights and Forecast - by Application
- 5.1.1. Hospitals and Clinics
- 5.1.2. Ambulatory Surgical Centers (ASC)
- 5.1.3. Others
- 5.2. Market Analysis, Insights and Forecast - by Types
- 5.2.1. Dry Blood Gas System
- 5.2.2. Wet Blood Gas System
- 5.3. Market Analysis, Insights and Forecast - by Region
- 5.3.1. North America
- 5.3.2. South America
- 5.3.3. Europe
- 5.3.4. Middle East & Africa
- 5.3.5. Asia Pacific
- 5.1. Market Analysis, Insights and Forecast - by Application
- 6. North America Automated Blood Gas System Analysis, Insights and Forecast, 2019-2031
- 6.1. Market Analysis, Insights and Forecast - by Application
- 6.1.1. Hospitals and Clinics
- 6.1.2. Ambulatory Surgical Centers (ASC)
- 6.1.3. Others
- 6.2. Market Analysis, Insights and Forecast - by Types
- 6.2.1. Dry Blood Gas System
- 6.2.2. Wet Blood Gas System
- 6.1. Market Analysis, Insights and Forecast - by Application
- 7. South America Automated Blood Gas System Analysis, Insights and Forecast, 2019-2031
- 7.1. Market Analysis, Insights and Forecast - by Application
- 7.1.1. Hospitals and Clinics
- 7.1.2. Ambulatory Surgical Centers (ASC)
- 7.1.3. Others
- 7.2. Market Analysis, Insights and Forecast - by Types
- 7.2.1. Dry Blood Gas System
- 7.2.2. Wet Blood Gas System
- 7.1. Market Analysis, Insights and Forecast - by Application
- 8. Europe Automated Blood Gas System Analysis, Insights and Forecast, 2019-2031
- 8.1. Market Analysis, Insights and Forecast - by Application
- 8.1.1. Hospitals and Clinics
- 8.1.2. Ambulatory Surgical Centers (ASC)
- 8.1.3. Others
- 8.2. Market Analysis, Insights and Forecast - by Types
- 8.2.1. Dry Blood Gas System
- 8.2.2. Wet Blood Gas System
- 8.1. Market Analysis, Insights and Forecast - by Application
- 9. Middle East & Africa Automated Blood Gas System Analysis, Insights and Forecast, 2019-2031
- 9.1. Market Analysis, Insights and Forecast - by Application
- 9.1.1. Hospitals and Clinics
- 9.1.2. Ambulatory Surgical Centers (ASC)
- 9.1.3. Others
- 9.2. Market Analysis, Insights and Forecast - by Types
- 9.2.1. Dry Blood Gas System
- 9.2.2. Wet Blood Gas System
- 9.1. Market Analysis, Insights and Forecast - by Application
- 10. Asia Pacific Automated Blood Gas System Analysis, Insights and Forecast, 2019-2031
- 10.1. Market Analysis, Insights and Forecast - by Application
- 10.1.1. Hospitals and Clinics
- 10.1.2. Ambulatory Surgical Centers (ASC)
- 10.1.3. Others
- 10.2. Market Analysis, Insights and Forecast - by Types
- 10.2.1. Dry Blood Gas System
- 10.2.2. Wet Blood Gas System
- 10.1. Market Analysis, Insights and Forecast - by Application
- 11. Competitive Analysis
- 11.1. Global Market Share Analysis 2024
- 11.2. Company Profiles
- 11.2.1 Siemens Healthineers
- 11.2.1.1. Overview
- 11.2.1.2. Products
- 11.2.1.3. SWOT Analysis
- 11.2.1.4. Recent Developments
- 11.2.1.5. Financials (Based on Availability)
- 11.2.2 Werfen
- 11.2.2.1. Overview
- 11.2.2.2. Products
- 11.2.2.3. SWOT Analysis
- 11.2.2.4. Recent Developments
- 11.2.2.5. Financials (Based on Availability)
- 11.2.3 Abbott
- 11.2.3.1. Overview
- 11.2.3.2. Products
- 11.2.3.3. SWOT Analysis
- 11.2.3.4. Recent Developments
- 11.2.3.5. Financials (Based on Availability)
- 11.2.4 Radiometer
- 11.2.4.1. Overview
- 11.2.4.2. Products
- 11.2.4.3. SWOT Analysis
- 11.2.4.4. Recent Developments
- 11.2.4.5. Financials (Based on Availability)
- 11.2.5 Roche
- 11.2.5.1. Overview
- 11.2.5.2. Products
- 11.2.5.3. SWOT Analysis
- 11.2.5.4. Recent Developments
- 11.2.5.5. Financials (Based on Availability)
- 11.2.6 IDEXX Laboratories
- 11.2.6.1. Overview
- 11.2.6.2. Products
- 11.2.6.3. SWOT Analysis
- 11.2.6.4. Recent Developments
- 11.2.6.5. Financials (Based on Availability)
- 11.2.7 Sensa Core
- 11.2.7.1. Overview
- 11.2.7.2. Products
- 11.2.7.3. SWOT Analysis
- 11.2.7.4. Recent Developments
- 11.2.7.5. Financials (Based on Availability)
- 11.2.8 Labtron Equipment
- 11.2.8.1. Overview
- 11.2.8.2. Products
- 11.2.8.3. SWOT Analysis
- 11.2.8.4. Recent Developments
- 11.2.8.5. Financials (Based on Availability)
- 11.2.9 DALKO Diagnostics
- 11.2.9.1. Overview
- 11.2.9.2. Products
- 11.2.9.3. SWOT Analysis
- 11.2.9.4. Recent Developments
- 11.2.9.5. Financials (Based on Availability)
- 11.2.10 LeanGene
- 11.2.10.1. Overview
- 11.2.10.2. Products
- 11.2.10.3. SWOT Analysis
- 11.2.10.4. Recent Developments
- 11.2.10.5. Financials (Based on Availability)
- 11.2.1 Siemens Healthineers
List of Figures
- Figure 1: Global Automated Blood Gas System Revenue Breakdown (million, %) by Region 2024 & 2032
- Figure 2: North America Automated Blood Gas System Revenue (million), by Application 2024 & 2032
- Figure 3: North America Automated Blood Gas System Revenue Share (%), by Application 2024 & 2032
- Figure 4: North America Automated Blood Gas System Revenue (million), by Types 2024 & 2032
- Figure 5: North America Automated Blood Gas System Revenue Share (%), by Types 2024 & 2032
- Figure 6: North America Automated Blood Gas System Revenue (million), by Country 2024 & 2032
- Figure 7: North America Automated Blood Gas System Revenue Share (%), by Country 2024 & 2032
- Figure 8: South America Automated Blood Gas System Revenue (million), by Application 2024 & 2032
- Figure 9: South America Automated Blood Gas System Revenue Share (%), by Application 2024 & 2032
- Figure 10: South America Automated Blood Gas System Revenue (million), by Types 2024 & 2032
- Figure 11: South America Automated Blood Gas System Revenue Share (%), by Types 2024 & 2032
- Figure 12: South America Automated Blood Gas System Revenue (million), by Country 2024 & 2032
- Figure 13: South America Automated Blood Gas System Revenue Share (%), by Country 2024 & 2032
- Figure 14: Europe Automated Blood Gas System Revenue (million), by Application 2024 & 2032
- Figure 15: Europe Automated Blood Gas System Revenue Share (%), by Application 2024 & 2032
- Figure 16: Europe Automated Blood Gas System Revenue (million), by Types 2024 & 2032
- Figure 17: Europe Automated Blood Gas System Revenue Share (%), by Types 2024 & 2032
- Figure 18: Europe Automated Blood Gas System Revenue (million), by Country 2024 & 2032
- Figure 19: Europe Automated Blood Gas System Revenue Share (%), by Country 2024 & 2032
- Figure 20: Middle East & Africa Automated Blood Gas System Revenue (million), by Application 2024 & 2032
- Figure 21: Middle East & Africa Automated Blood Gas System Revenue Share (%), by Application 2024 & 2032
- Figure 22: Middle East & Africa Automated Blood Gas System Revenue (million), by Types 2024 & 2032
- Figure 23: Middle East & Africa Automated Blood Gas System Revenue Share (%), by Types 2024 & 2032
- Figure 24: Middle East & Africa Automated Blood Gas System Revenue (million), by Country 2024 & 2032
- Figure 25: Middle East & Africa Automated Blood Gas System Revenue Share (%), by Country 2024 & 2032
- Figure 26: Asia Pacific Automated Blood Gas System Revenue (million), by Application 2024 & 2032
- Figure 27: Asia Pacific Automated Blood Gas System Revenue Share (%), by Application 2024 & 2032
- Figure 28: Asia Pacific Automated Blood Gas System Revenue (million), by Types 2024 & 2032
- Figure 29: Asia Pacific Automated Blood Gas System Revenue Share (%), by Types 2024 & 2032
- Figure 30: Asia Pacific Automated Blood Gas System Revenue (million), by Country 2024 & 2032
- Figure 31: Asia Pacific Automated Blood Gas System Revenue Share (%), by Country 2024 & 2032
List of Tables
- Table 1: Global Automated Blood Gas System Revenue million Forecast, by Region 2019 & 2032
- Table 2: Global Automated Blood Gas System Revenue million Forecast, by Application 2019 & 2032
- Table 3: Global Automated Blood Gas System Revenue million Forecast, by Types 2019 & 2032
- Table 4: Global Automated Blood Gas System Revenue million Forecast, by Region 2019 & 2032
- Table 5: Global Automated Blood Gas System Revenue million Forecast, by Application 2019 & 2032
- Table 6: Global Automated Blood Gas System Revenue million Forecast, by Types 2019 & 2032
- Table 7: Global Automated Blood Gas System Revenue million Forecast, by Country 2019 & 2032
- Table 8: United States Automated Blood Gas System Revenue (million) Forecast, by Application 2019 & 2032
- Table 9: Canada Automated Blood Gas System Revenue (million) Forecast, by Application 2019 & 2032
- Table 10: Mexico Automated Blood Gas System Revenue (million) Forecast, by Application 2019 & 2032
- Table 11: Global Automated Blood Gas System Revenue million Forecast, by Application 2019 & 2032
- Table 12: Global Automated Blood Gas System Revenue million Forecast, by Types 2019 & 2032
- Table 13: Global Automated Blood Gas System Revenue million Forecast, by Country 2019 & 2032
- Table 14: Brazil Automated Blood Gas System Revenue (million) Forecast, by Application 2019 & 2032
- Table 15: Argentina Automated Blood Gas System Revenue (million) Forecast, by Application 2019 & 2032
- Table 16: Rest of South America Automated Blood Gas System Revenue (million) Forecast, by Application 2019 & 2032
- Table 17: Global Automated Blood Gas System Revenue million Forecast, by Application 2019 & 2032
- Table 18: Global Automated Blood Gas System Revenue million Forecast, by Types 2019 & 2032
- Table 19: Global Automated Blood Gas System Revenue million Forecast, by Country 2019 & 2032
- Table 20: United Kingdom Automated Blood Gas System Revenue (million) Forecast, by Application 2019 & 2032
- Table 21: Germany Automated Blood Gas System Revenue (million) Forecast, by Application 2019 & 2032
- Table 22: France Automated Blood Gas System Revenue (million) Forecast, by Application 2019 & 2032
- Table 23: Italy Automated Blood Gas System Revenue (million) Forecast, by Application 2019 & 2032
- Table 24: Spain Automated Blood Gas System Revenue (million) Forecast, by Application 2019 & 2032
- Table 25: Russia Automated Blood Gas System Revenue (million) Forecast, by Application 2019 & 2032
- Table 26: Benelux Automated Blood Gas System Revenue (million) Forecast, by Application 2019 & 2032
- Table 27: Nordics Automated Blood Gas System Revenue (million) Forecast, by Application 2019 & 2032
- Table 28: Rest of Europe Automated Blood Gas System Revenue (million) Forecast, by Application 2019 & 2032
- Table 29: Global Automated Blood Gas System Revenue million Forecast, by Application 2019 & 2032
- Table 30: Global Automated Blood Gas System Revenue million Forecast, by Types 2019 & 2032
- Table 31: Global Automated Blood Gas System Revenue million Forecast, by Country 2019 & 2032
- Table 32: Turkey Automated Blood Gas System Revenue (million) Forecast, by Application 2019 & 2032
- Table 33: Israel Automated Blood Gas System Revenue (million) Forecast, by Application 2019 & 2032
- Table 34: GCC Automated Blood Gas System Revenue (million) Forecast, by Application 2019 & 2032
- Table 35: North Africa Automated Blood Gas System Revenue (million) Forecast, by Application 2019 & 2032
- Table 36: South Africa Automated Blood Gas System Revenue (million) Forecast, by Application 2019 & 2032
- Table 37: Rest of Middle East & Africa Automated Blood Gas System Revenue (million) Forecast, by Application 2019 & 2032
- Table 38: Global Automated Blood Gas System Revenue million Forecast, by Application 2019 & 2032
- Table 39: Global Automated Blood Gas System Revenue million Forecast, by Types 2019 & 2032
- Table 40: Global Automated Blood Gas System Revenue million Forecast, by Country 2019 & 2032
- Table 41: China Automated Blood Gas System Revenue (million) Forecast, by Application 2019 & 2032
- Table 42: India Automated Blood Gas System Revenue (million) Forecast, by Application 2019 & 2032
- Table 43: Japan Automated Blood Gas System Revenue (million) Forecast, by Application 2019 & 2032
- Table 44: South Korea Automated Blood Gas System Revenue (million) Forecast, by Application 2019 & 2032
- Table 45: ASEAN Automated Blood Gas System Revenue (million) Forecast, by Application 2019 & 2032
- Table 46: Oceania Automated Blood Gas System Revenue (million) Forecast, by Application 2019 & 2032
- Table 47: Rest of Asia Pacific Automated Blood Gas System Revenue (million) Forecast, by Application 2019 & 2032
Frequently Asked Questions
1. What is the projected Compound Annual Growth Rate (CAGR) of the Automated Blood Gas System?
The projected CAGR is approximately XX%.
2. Which companies are prominent players in the Automated Blood Gas System?
Key companies in the market include Siemens Healthineers, Werfen, Abbott, Radiometer, Roche, IDEXX Laboratories, Sensa Core, Labtron Equipment, DALKO Diagnostics, LeanGene.
3. What are the main segments of the Automated Blood Gas System?
The market segments include Application, Types.
4. Can you provide details about the market size?
The market size is estimated to be USD XXX million as of 2022.
5. What are some drivers contributing to market growth?
N/A
6. What are the notable trends driving market growth?
N/A
7. Are there any restraints impacting market growth?
N/A
8. Can you provide examples of recent developments in the market?
N/A
9. What pricing options are available for accessing the report?
Pricing options include single-user, multi-user, and enterprise licenses priced at USD 2900.00, USD 4350.00, and USD 5800.00 respectively.
10. Is the market size provided in terms of value or volume?
The market size is provided in terms of value, measured in million.
11. Are there any specific market keywords associated with the report?
Yes, the market keyword associated with the report is "Automated Blood Gas System," which aids in identifying and referencing the specific market segment covered.
12. How do I determine which pricing option suits my needs best?
The pricing options vary based on user requirements and access needs. Individual users may opt for single-user licenses, while businesses requiring broader access may choose multi-user or enterprise licenses for cost-effective access to the report.
13. Are there any additional resources or data provided in the Automated Blood Gas System report?
While the report offers comprehensive insights, it's advisable to review the specific contents or supplementary materials provided to ascertain if additional resources or data are available.
14. How can I stay updated on further developments or reports in the Automated Blood Gas System?
To stay informed about further developments, trends, and reports in the Automated Blood Gas System, consider subscribing to industry newsletters, following relevant companies and organizations, or regularly checking reputable industry news sources and publications.
Methodology
Step 1 - Identification of Relevant Samples Size from Population Database


Step 2 - Approaches for Defining Global Market Size (Value, Volume* & Price*)

Note*: In applicable scenarios
Step 3 - Data Sources
Primary Research
- Web Analytics
- Survey Reports
- Research Institute
- Latest Research Reports
- Opinion Leaders
Secondary Research
- Annual Reports
- White Paper
- Latest Press Release
- Industry Association
- Paid Database
- Investor Presentations

Step 4 - Data Triangulation
Involves using different sources of information in order to increase the validity of a study
These sources are likely to be stakeholders in a program - participants, other researchers, program staff, other community members, and so on.
Then we put all data in single framework & apply various statistical tools to find out the dynamic on the market.
During the analysis stage, feedback from the stakeholder groups would be compared to determine areas of agreement as well as areas of divergence


