
Key Insights
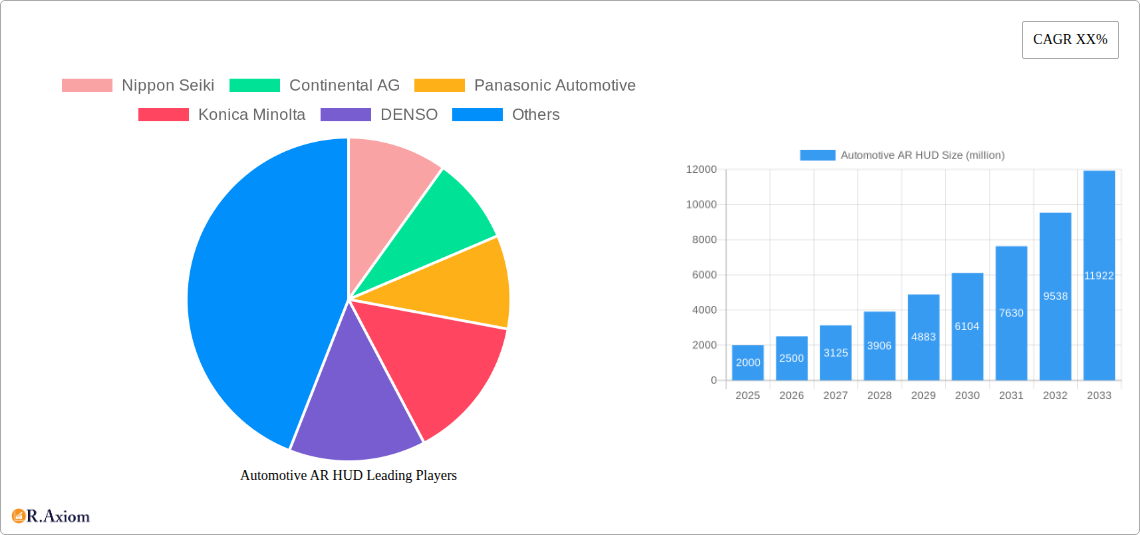
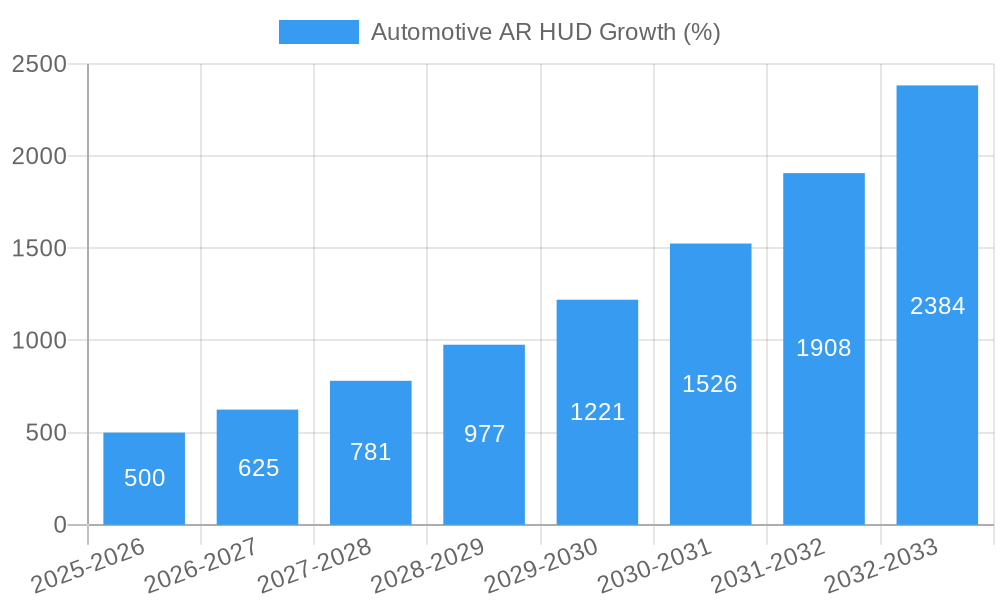
The automotive augmented reality head-up display (AR HUD) market is experiencing robust growth, driven by increasing demand for enhanced driver safety and improved in-car infotainment experiences. The market, estimated at $2 billion in 2025, is projected to witness a Compound Annual Growth Rate (CAGR) of 25% from 2025 to 2033, reaching approximately $12 billion by 2033. This expansion is fueled by several key factors, including the integration of advanced driver-assistance systems (ADAS), the rising adoption of electric vehicles (EVs), and the increasing consumer preference for sophisticated and intuitive in-vehicle technologies. Key trends include the miniaturization of AR HUD components, the development of higher-resolution displays, and the integration of seamless connectivity features like smartphone mirroring and cloud-based services. While cost remains a significant restraint for wider adoption, particularly in the mass-market segment, technological advancements are steadily driving down production costs, making AR HUDs accessible to a broader range of vehicles. The increasing focus on autonomous driving capabilities further strengthens the market outlook, as AR HUDs play a critical role in providing drivers with essential information while navigating autonomous modes.
Leading players in the automotive AR HUD market, such as Nippon Seiki, Continental AG, Panasonic Automotive, and others, are actively investing in research and development to enhance product features, improve performance, and expand their product portfolios. Competition is fierce, particularly among Tier-1 automotive suppliers striving to secure contracts with major vehicle manufacturers. The market is segmented by display technology (e.g., holographic, waveguide), vehicle type (passenger cars, commercial vehicles), and region (North America, Europe, Asia Pacific). The Asia Pacific region is expected to experience the fastest growth due to a surge in vehicle production and increasing consumer spending on automotive technologies in rapidly developing economies. The ongoing evolution of AR HUD technology, coupled with the expanding global automotive landscape, promises a dynamic and lucrative market opportunity in the coming years.
Automotive AR HUD Market Report: 2019-2033 - A Comprehensive Analysis
This in-depth report provides a comprehensive analysis of the Automotive Augmented Reality Head-Up Display (AR HUD) market, offering invaluable insights for stakeholders across the automotive and technology sectors. Covering the period from 2019 to 2033, with a focus on the 2025-2033 forecast period, this report meticulously examines market dynamics, technological advancements, and competitive landscapes to provide a clear roadmap for future growth. The report projects a market value exceeding xx million by 2033, driven by factors detailed within.
Study Period: 2019-2033 Base Year: 2025 Estimated Year: 2025 Forecast Period: 2025-2033 Historical Period: 2019-2024
Automotive AR HUD Market Concentration & Innovation
This section analyzes the Automotive AR HUD market's competitive landscape, focusing on market concentration, innovation drivers, regulatory influences, and strategic activities. The report reveals a moderately concentrated market with key players like Continental AG and DENSO holding significant shares. However, the emergence of innovative startups and diversification of technologies indicate a dynamic and evolving landscape.
- Market Share: Continental AG holds an estimated xx% market share in 2025, followed by DENSO at xx%. Other key players like Panasonic Automotive and Nippon Seiki collectively account for xx% of the market.
- M&A Activity: The report details several significant mergers and acquisitions (M&A) transactions during the historical period (2019-2024), with total deal values exceeding xx million. This activity reflects the strategic importance of AR HUD technology and the consolidation within the industry. Specific examples and their financial implications are analyzed.
- Innovation Drivers: Advancements in projection technology, improved image processing, and the integration of AI and machine learning are key drivers of innovation. The rising demand for enhanced driver assistance systems (ADAS) and autonomous driving capabilities further fuels technological advancements.
- Regulatory Framework: Emerging regulations concerning driver safety and autonomous driving are shaping the AR HUD market. The report examines these regulations across different regions, outlining their impact on technological adoption and market growth.
- Product Substitutes: The report identifies potential substitutes for AR HUD, analyzing their comparative advantages and market implications.
- End-User Trends: The analysis explores shifting consumer preferences towards enhanced safety features and advanced infotainment systems, shaping demand for AR HUD technology.
Automotive AR HUD Industry Trends & Insights
This section offers a detailed analysis of major market trends, encompassing market growth drivers, technological advancements, consumer preferences, and the competitive dynamics. The report projects a Compound Annual Growth Rate (CAGR) of xx% during the forecast period (2025-2033). This substantial growth is attributed to several key factors:
- Increased Adoption of ADAS: The rising demand for ADAS features significantly fuels the AR HUD market, as it enhances driver awareness and reduces the risk of accidents. Market penetration of AR HUD in ADAS-equipped vehicles is projected to reach xx% by 2033.
- Technological Disruptions: Breakthroughs in miniaturization, improved brightness, and wider field of view (FOV) are transforming the AR HUD landscape. The integration of advanced features like haptic feedback and gesture control further enhances the user experience.
- Consumer Preferences: A growing preference for connected car features and seamless integration of infotainment is driving the market. Consumers increasingly demand intuitive and immersive driving experiences.
- Competitive Dynamics: The report analyzes the strategies employed by leading players to maintain their market positions, including partnerships, collaborations, and new product launches. The competitive landscape's dynamic nature and the implications for market share are thoroughly explored.
Dominant Markets & Segments in Automotive AR HUD
This section identifies the leading geographical regions and market segments, providing a detailed analysis of their dominance. The report highlights that the North American market holds the largest share in 2025, driven by several factors.
Key Drivers in Dominant Regions:
- North America: High vehicle ownership rates, strong consumer preference for advanced features, and robust automotive industry support AR HUD adoption.
- Europe: Stricter regulations concerning road safety and autonomous driving are driving demand.
- Asia-Pacific: Rapid economic growth, increasing vehicle production, and a rising middle class are contributing to market expansion.
Dominance Analysis: The report provides a detailed analysis of each region's market size, growth drivers, challenges, and competitive dynamics. Factors like government policies, technological infrastructure, and consumer behavior are thoroughly examined.
Automotive AR HUD Product Developments
Recent product innovations focus on enhancing image quality, expanding the field of view, improving head tracking capabilities, and integrating more advanced features. Miniaturization of components and advancements in projection technologies are key trends. Competitive advantages are increasingly achieved through the integration of innovative features such as AI-powered driver assistance and personalized user interfaces. The market is witnessing a transition from basic display systems to sophisticated solutions offering advanced augmented reality experiences.
Report Scope & Segmentation Analysis
This report segments the Automotive AR HUD market based on various parameters, including vehicle type (passenger cars, commercial vehicles), display technology (laser-based, LED-based), and region (North America, Europe, Asia-Pacific, etc.). Each segment's growth projections, market sizes, and competitive dynamics are assessed in detail, offering a comprehensive view of the market's structural composition. The report also examines the various applications of AR HUD technology in different vehicle segments. Further segmentation is provided in detailed tables within the report itself.
Key Drivers of Automotive AR HUD Growth
Several factors contribute to the Automotive AR HUD market's significant growth. These include technological advancements such as higher resolution displays and wider FOV, increasing consumer demand for enhanced safety and infotainment features, supportive government regulations promoting autonomous driving technologies, and the integration of AR HUD into ADAS systems for safer and more efficient driving experiences. The rising adoption of connected cars and their integration with smartphone apps provides an additional boost to the market.
Challenges in the Automotive AR HUD Sector
Despite the market’s substantial growth potential, several challenges hinder wider adoption. High manufacturing costs remain a significant barrier, limiting affordability. Ensuring sufficient supply chain stability for key components is crucial. Furthermore, achieving optimal performance under various weather conditions and the integration of AR HUD with existing automotive systems necessitate continuous technological improvements. Competition from established players and emerging startups also adds to the complexity of the market landscape. The impact of these challenges is quantified in the report using various metrics.
Emerging Opportunities in Automotive AR HUD
Future market opportunities lie in the development of AR HUD solutions for commercial vehicles, the integration of AR HUD into autonomous driving systems, and the exploration of innovative display technologies. The growing demand for personalized infotainment features provides opportunities for tailored AR HUD solutions. The expansion into new geographical markets with developing automotive industries offers further growth potential.
Leading Players in the Automotive AR HUD Market
- Nippon Seiki
- Continental AG
- Panasonic Automotive
- Konica Minolta
- DENSO
- Maxell
- LG Electronic
- Foryou
- E-LEAD
- Huawei
- Ofilm Group
- Crystal Optech
- FUTURUS
- Raythink
- New Vision
- Shenzhen 3-dragons Technology
- Jiangcheng Technology
- Qianhai Zinger Technology
- YAZAKI METER
- Carrot Technology
- Shanghai Yesar Technology
Key Developments in Automotive AR HUD Industry
- 2022-Q4: Continental AG launches a new generation of AR HUD with enhanced image quality and expanded field of view.
- 2023-Q1: Panasonic Automotive announces a strategic partnership with a leading semiconductor manufacturer to develop advanced AR HUD chips.
- 2023-Q3: A significant merger between two key AR HUD technology providers results in a combined market share of xx%. (Specific details will be provided within the report.)
- (Further key developments with dates and impact analysis will be detailed within the report.)
Strategic Outlook for Automotive AR HUD Market
The Automotive AR HUD market presents significant growth potential driven by the convergence of technological advancements, evolving consumer preferences, and supportive regulatory frameworks. Continued innovation in display technologies, coupled with the increasing adoption of ADAS and autonomous driving features, will create substantial opportunities for both established players and new entrants. Strategic partnerships and collaborations will be crucial for success in this rapidly evolving market. The report concludes by offering actionable strategic recommendations for businesses operating in this sector.
Automotive AR HUD Segmentation
-
1. Application
- 1.1. Premium Car
- 1.2. Luxury Car
- 1.3. Others
-
2. Types
- 2.1. TFT Projection Type
- 2.2. DLP Projection Type
- 2.3. LCOS Projection Type
Automotive AR HUD Segmentation By Geography
-
1. North America
- 1.1. United States
- 1.2. Canada
- 1.3. Mexico
-
2. South America
- 2.1. Brazil
- 2.2. Argentina
- 2.3. Rest of South America
-
3. Europe
- 3.1. United Kingdom
- 3.2. Germany
- 3.3. France
- 3.4. Italy
- 3.5. Spain
- 3.6. Russia
- 3.7. Benelux
- 3.8. Nordics
- 3.9. Rest of Europe
-
4. Middle East & Africa
- 4.1. Turkey
- 4.2. Israel
- 4.3. GCC
- 4.4. North Africa
- 4.5. South Africa
- 4.6. Rest of Middle East & Africa
-
5. Asia Pacific
- 5.1. China
- 5.2. India
- 5.3. Japan
- 5.4. South Korea
- 5.5. ASEAN
- 5.6. Oceania
- 5.7. Rest of Asia Pacific

Automotive AR HUD REPORT HIGHLIGHTS
| Aspects | Details |
|---|---|
| Study Period | 2019-2033 |
| Base Year | 2024 |
| Estimated Year | 2025 |
| Forecast Period | 2025-2033 |
| Historical Period | 2019-2024 |
| Growth Rate | CAGR of XX% from 2019-2033 |
| Segmentation |
|
Table of Contents
- 1. Introduction
- 1.1. Research Scope
- 1.2. Market Segmentation
- 1.3. Research Methodology
- 1.4. Definitions and Assumptions
- 2. Executive Summary
- 2.1. Introduction
- 3. Market Dynamics
- 3.1. Introduction
- 3.2. Market Drivers
- 3.3. Market Restrains
- 3.4. Market Trends
- 4. Market Factor Analysis
- 4.1. Porters Five Forces
- 4.2. Supply/Value Chain
- 4.3. PESTEL analysis
- 4.4. Market Entropy
- 4.5. Patent/Trademark Analysis
- 5. Global Automotive AR HUD Analysis, Insights and Forecast, 2019-2031
- 5.1. Market Analysis, Insights and Forecast - by Application
- 5.1.1. Premium Car
- 5.1.2. Luxury Car
- 5.1.3. Others
- 5.2. Market Analysis, Insights and Forecast - by Types
- 5.2.1. TFT Projection Type
- 5.2.2. DLP Projection Type
- 5.2.3. LCOS Projection Type
- 5.3. Market Analysis, Insights and Forecast - by Region
- 5.3.1. North America
- 5.3.2. South America
- 5.3.3. Europe
- 5.3.4. Middle East & Africa
- 5.3.5. Asia Pacific
- 5.1. Market Analysis, Insights and Forecast - by Application
- 6. North America Automotive AR HUD Analysis, Insights and Forecast, 2019-2031
- 6.1. Market Analysis, Insights and Forecast - by Application
- 6.1.1. Premium Car
- 6.1.2. Luxury Car
- 6.1.3. Others
- 6.2. Market Analysis, Insights and Forecast - by Types
- 6.2.1. TFT Projection Type
- 6.2.2. DLP Projection Type
- 6.2.3. LCOS Projection Type
- 6.1. Market Analysis, Insights and Forecast - by Application
- 7. South America Automotive AR HUD Analysis, Insights and Forecast, 2019-2031
- 7.1. Market Analysis, Insights and Forecast - by Application
- 7.1.1. Premium Car
- 7.1.2. Luxury Car
- 7.1.3. Others
- 7.2. Market Analysis, Insights and Forecast - by Types
- 7.2.1. TFT Projection Type
- 7.2.2. DLP Projection Type
- 7.2.3. LCOS Projection Type
- 7.1. Market Analysis, Insights and Forecast - by Application
- 8. Europe Automotive AR HUD Analysis, Insights and Forecast, 2019-2031
- 8.1. Market Analysis, Insights and Forecast - by Application
- 8.1.1. Premium Car
- 8.1.2. Luxury Car
- 8.1.3. Others
- 8.2. Market Analysis, Insights and Forecast - by Types
- 8.2.1. TFT Projection Type
- 8.2.2. DLP Projection Type
- 8.2.3. LCOS Projection Type
- 8.1. Market Analysis, Insights and Forecast - by Application
- 9. Middle East & Africa Automotive AR HUD Analysis, Insights and Forecast, 2019-2031
- 9.1. Market Analysis, Insights and Forecast - by Application
- 9.1.1. Premium Car
- 9.1.2. Luxury Car
- 9.1.3. Others
- 9.2. Market Analysis, Insights and Forecast - by Types
- 9.2.1. TFT Projection Type
- 9.2.2. DLP Projection Type
- 9.2.3. LCOS Projection Type
- 9.1. Market Analysis, Insights and Forecast - by Application
- 10. Asia Pacific Automotive AR HUD Analysis, Insights and Forecast, 2019-2031
- 10.1. Market Analysis, Insights and Forecast - by Application
- 10.1.1. Premium Car
- 10.1.2. Luxury Car
- 10.1.3. Others
- 10.2. Market Analysis, Insights and Forecast - by Types
- 10.2.1. TFT Projection Type
- 10.2.2. DLP Projection Type
- 10.2.3. LCOS Projection Type
- 10.1. Market Analysis, Insights and Forecast - by Application
- 11. Competitive Analysis
- 11.1. Global Market Share Analysis 2024
- 11.2. Company Profiles
- 11.2.1 Nippon Seiki
- 11.2.1.1. Overview
- 11.2.1.2. Products
- 11.2.1.3. SWOT Analysis
- 11.2.1.4. Recent Developments
- 11.2.1.5. Financials (Based on Availability)
- 11.2.2 Continental AG
- 11.2.2.1. Overview
- 11.2.2.2. Products
- 11.2.2.3. SWOT Analysis
- 11.2.2.4. Recent Developments
- 11.2.2.5. Financials (Based on Availability)
- 11.2.3 Panasonic Automotive
- 11.2.3.1. Overview
- 11.2.3.2. Products
- 11.2.3.3. SWOT Analysis
- 11.2.3.4. Recent Developments
- 11.2.3.5. Financials (Based on Availability)
- 11.2.4 Konica Minolta
- 11.2.4.1. Overview
- 11.2.4.2. Products
- 11.2.4.3. SWOT Analysis
- 11.2.4.4. Recent Developments
- 11.2.4.5. Financials (Based on Availability)
- 11.2.5 DENSO
- 11.2.5.1. Overview
- 11.2.5.2. Products
- 11.2.5.3. SWOT Analysis
- 11.2.5.4. Recent Developments
- 11.2.5.5. Financials (Based on Availability)
- 11.2.6 Maxell
- 11.2.6.1. Overview
- 11.2.6.2. Products
- 11.2.6.3. SWOT Analysis
- 11.2.6.4. Recent Developments
- 11.2.6.5. Financials (Based on Availability)
- 11.2.7 LG Electronic
- 11.2.7.1. Overview
- 11.2.7.2. Products
- 11.2.7.3. SWOT Analysis
- 11.2.7.4. Recent Developments
- 11.2.7.5. Financials (Based on Availability)
- 11.2.8 Foryou
- 11.2.8.1. Overview
- 11.2.8.2. Products
- 11.2.8.3. SWOT Analysis
- 11.2.8.4. Recent Developments
- 11.2.8.5. Financials (Based on Availability)
- 11.2.9 E-LEAD
- 11.2.9.1. Overview
- 11.2.9.2. Products
- 11.2.9.3. SWOT Analysis
- 11.2.9.4. Recent Developments
- 11.2.9.5. Financials (Based on Availability)
- 11.2.10 Huawei
- 11.2.10.1. Overview
- 11.2.10.2. Products
- 11.2.10.3. SWOT Analysis
- 11.2.10.4. Recent Developments
- 11.2.10.5. Financials (Based on Availability)
- 11.2.11 Ofilm Group
- 11.2.11.1. Overview
- 11.2.11.2. Products
- 11.2.11.3. SWOT Analysis
- 11.2.11.4. Recent Developments
- 11.2.11.5. Financials (Based on Availability)
- 11.2.12 Crystal Optech
- 11.2.12.1. Overview
- 11.2.12.2. Products
- 11.2.12.3. SWOT Analysis
- 11.2.12.4. Recent Developments
- 11.2.12.5. Financials (Based on Availability)
- 11.2.13 FUTURUS
- 11.2.13.1. Overview
- 11.2.13.2. Products
- 11.2.13.3. SWOT Analysis
- 11.2.13.4. Recent Developments
- 11.2.13.5. Financials (Based on Availability)
- 11.2.14 Raythink
- 11.2.14.1. Overview
- 11.2.14.2. Products
- 11.2.14.3. SWOT Analysis
- 11.2.14.4. Recent Developments
- 11.2.14.5. Financials (Based on Availability)
- 11.2.15 New Vision
- 11.2.15.1. Overview
- 11.2.15.2. Products
- 11.2.15.3. SWOT Analysis
- 11.2.15.4. Recent Developments
- 11.2.15.5. Financials (Based on Availability)
- 11.2.16 Shenzhen 3-dragons Technology
- 11.2.16.1. Overview
- 11.2.16.2. Products
- 11.2.16.3. SWOT Analysis
- 11.2.16.4. Recent Developments
- 11.2.16.5. Financials (Based on Availability)
- 11.2.17 Jiangcheng Technology
- 11.2.17.1. Overview
- 11.2.17.2. Products
- 11.2.17.3. SWOT Analysis
- 11.2.17.4. Recent Developments
- 11.2.17.5. Financials (Based on Availability)
- 11.2.18 Qianhai Zinger Technology
- 11.2.18.1. Overview
- 11.2.18.2. Products
- 11.2.18.3. SWOT Analysis
- 11.2.18.4. Recent Developments
- 11.2.18.5. Financials (Based on Availability)
- 11.2.19 YAZAKI METER
- 11.2.19.1. Overview
- 11.2.19.2. Products
- 11.2.19.3. SWOT Analysis
- 11.2.19.4. Recent Developments
- 11.2.19.5. Financials (Based on Availability)
- 11.2.20 Carrot Technology
- 11.2.20.1. Overview
- 11.2.20.2. Products
- 11.2.20.3. SWOT Analysis
- 11.2.20.4. Recent Developments
- 11.2.20.5. Financials (Based on Availability)
- 11.2.21 Shanghai Yesar Technology
- 11.2.21.1. Overview
- 11.2.21.2. Products
- 11.2.21.3. SWOT Analysis
- 11.2.21.4. Recent Developments
- 11.2.21.5. Financials (Based on Availability)
- 11.2.1 Nippon Seiki
List of Figures
- Figure 1: Global Automotive AR HUD Revenue Breakdown (million, %) by Region 2024 & 2032
- Figure 2: Global Automotive AR HUD Volume Breakdown (K, %) by Region 2024 & 2032
- Figure 3: North America Automotive AR HUD Revenue (million), by Application 2024 & 2032
- Figure 4: North America Automotive AR HUD Volume (K), by Application 2024 & 2032
- Figure 5: North America Automotive AR HUD Revenue Share (%), by Application 2024 & 2032
- Figure 6: North America Automotive AR HUD Volume Share (%), by Application 2024 & 2032
- Figure 7: North America Automotive AR HUD Revenue (million), by Types 2024 & 2032
- Figure 8: North America Automotive AR HUD Volume (K), by Types 2024 & 2032
- Figure 9: North America Automotive AR HUD Revenue Share (%), by Types 2024 & 2032
- Figure 10: North America Automotive AR HUD Volume Share (%), by Types 2024 & 2032
- Figure 11: North America Automotive AR HUD Revenue (million), by Country 2024 & 2032
- Figure 12: North America Automotive AR HUD Volume (K), by Country 2024 & 2032
- Figure 13: North America Automotive AR HUD Revenue Share (%), by Country 2024 & 2032
- Figure 14: North America Automotive AR HUD Volume Share (%), by Country 2024 & 2032
- Figure 15: South America Automotive AR HUD Revenue (million), by Application 2024 & 2032
- Figure 16: South America Automotive AR HUD Volume (K), by Application 2024 & 2032
- Figure 17: South America Automotive AR HUD Revenue Share (%), by Application 2024 & 2032
- Figure 18: South America Automotive AR HUD Volume Share (%), by Application 2024 & 2032
- Figure 19: South America Automotive AR HUD Revenue (million), by Types 2024 & 2032
- Figure 20: South America Automotive AR HUD Volume (K), by Types 2024 & 2032
- Figure 21: South America Automotive AR HUD Revenue Share (%), by Types 2024 & 2032
- Figure 22: South America Automotive AR HUD Volume Share (%), by Types 2024 & 2032
- Figure 23: South America Automotive AR HUD Revenue (million), by Country 2024 & 2032
- Figure 24: South America Automotive AR HUD Volume (K), by Country 2024 & 2032
- Figure 25: South America Automotive AR HUD Revenue Share (%), by Country 2024 & 2032
- Figure 26: South America Automotive AR HUD Volume Share (%), by Country 2024 & 2032
- Figure 27: Europe Automotive AR HUD Revenue (million), by Application 2024 & 2032
- Figure 28: Europe Automotive AR HUD Volume (K), by Application 2024 & 2032
- Figure 29: Europe Automotive AR HUD Revenue Share (%), by Application 2024 & 2032
- Figure 30: Europe Automotive AR HUD Volume Share (%), by Application 2024 & 2032
- Figure 31: Europe Automotive AR HUD Revenue (million), by Types 2024 & 2032
- Figure 32: Europe Automotive AR HUD Volume (K), by Types 2024 & 2032
- Figure 33: Europe Automotive AR HUD Revenue Share (%), by Types 2024 & 2032
- Figure 34: Europe Automotive AR HUD Volume Share (%), by Types 2024 & 2032
- Figure 35: Europe Automotive AR HUD Revenue (million), by Country 2024 & 2032
- Figure 36: Europe Automotive AR HUD Volume (K), by Country 2024 & 2032
- Figure 37: Europe Automotive AR HUD Revenue Share (%), by Country 2024 & 2032
- Figure 38: Europe Automotive AR HUD Volume Share (%), by Country 2024 & 2032
- Figure 39: Middle East & Africa Automotive AR HUD Revenue (million), by Application 2024 & 2032
- Figure 40: Middle East & Africa Automotive AR HUD Volume (K), by Application 2024 & 2032
- Figure 41: Middle East & Africa Automotive AR HUD Revenue Share (%), by Application 2024 & 2032
- Figure 42: Middle East & Africa Automotive AR HUD Volume Share (%), by Application 2024 & 2032
- Figure 43: Middle East & Africa Automotive AR HUD Revenue (million), by Types 2024 & 2032
- Figure 44: Middle East & Africa Automotive AR HUD Volume (K), by Types 2024 & 2032
- Figure 45: Middle East & Africa Automotive AR HUD Revenue Share (%), by Types 2024 & 2032
- Figure 46: Middle East & Africa Automotive AR HUD Volume Share (%), by Types 2024 & 2032
- Figure 47: Middle East & Africa Automotive AR HUD Revenue (million), by Country 2024 & 2032
- Figure 48: Middle East & Africa Automotive AR HUD Volume (K), by Country 2024 & 2032
- Figure 49: Middle East & Africa Automotive AR HUD Revenue Share (%), by Country 2024 & 2032
- Figure 50: Middle East & Africa Automotive AR HUD Volume Share (%), by Country 2024 & 2032
- Figure 51: Asia Pacific Automotive AR HUD Revenue (million), by Application 2024 & 2032
- Figure 52: Asia Pacific Automotive AR HUD Volume (K), by Application 2024 & 2032
- Figure 53: Asia Pacific Automotive AR HUD Revenue Share (%), by Application 2024 & 2032
- Figure 54: Asia Pacific Automotive AR HUD Volume Share (%), by Application 2024 & 2032
- Figure 55: Asia Pacific Automotive AR HUD Revenue (million), by Types 2024 & 2032
- Figure 56: Asia Pacific Automotive AR HUD Volume (K), by Types 2024 & 2032
- Figure 57: Asia Pacific Automotive AR HUD Revenue Share (%), by Types 2024 & 2032
- Figure 58: Asia Pacific Automotive AR HUD Volume Share (%), by Types 2024 & 2032
- Figure 59: Asia Pacific Automotive AR HUD Revenue (million), by Country 2024 & 2032
- Figure 60: Asia Pacific Automotive AR HUD Volume (K), by Country 2024 & 2032
- Figure 61: Asia Pacific Automotive AR HUD Revenue Share (%), by Country 2024 & 2032
- Figure 62: Asia Pacific Automotive AR HUD Volume Share (%), by Country 2024 & 2032
List of Tables
- Table 1: Global Automotive AR HUD Revenue million Forecast, by Region 2019 & 2032
- Table 2: Global Automotive AR HUD Volume K Forecast, by Region 2019 & 2032
- Table 3: Global Automotive AR HUD Revenue million Forecast, by Application 2019 & 2032
- Table 4: Global Automotive AR HUD Volume K Forecast, by Application 2019 & 2032
- Table 5: Global Automotive AR HUD Revenue million Forecast, by Types 2019 & 2032
- Table 6: Global Automotive AR HUD Volume K Forecast, by Types 2019 & 2032
- Table 7: Global Automotive AR HUD Revenue million Forecast, by Region 2019 & 2032
- Table 8: Global Automotive AR HUD Volume K Forecast, by Region 2019 & 2032
- Table 9: Global Automotive AR HUD Revenue million Forecast, by Application 2019 & 2032
- Table 10: Global Automotive AR HUD Volume K Forecast, by Application 2019 & 2032
- Table 11: Global Automotive AR HUD Revenue million Forecast, by Types 2019 & 2032
- Table 12: Global Automotive AR HUD Volume K Forecast, by Types 2019 & 2032
- Table 13: Global Automotive AR HUD Revenue million Forecast, by Country 2019 & 2032
- Table 14: Global Automotive AR HUD Volume K Forecast, by Country 2019 & 2032
- Table 15: United States Automotive AR HUD Revenue (million) Forecast, by Application 2019 & 2032
- Table 16: United States Automotive AR HUD Volume (K) Forecast, by Application 2019 & 2032
- Table 17: Canada Automotive AR HUD Revenue (million) Forecast, by Application 2019 & 2032
- Table 18: Canada Automotive AR HUD Volume (K) Forecast, by Application 2019 & 2032
- Table 19: Mexico Automotive AR HUD Revenue (million) Forecast, by Application 2019 & 2032
- Table 20: Mexico Automotive AR HUD Volume (K) Forecast, by Application 2019 & 2032
- Table 21: Global Automotive AR HUD Revenue million Forecast, by Application 2019 & 2032
- Table 22: Global Automotive AR HUD Volume K Forecast, by Application 2019 & 2032
- Table 23: Global Automotive AR HUD Revenue million Forecast, by Types 2019 & 2032
- Table 24: Global Automotive AR HUD Volume K Forecast, by Types 2019 & 2032
- Table 25: Global Automotive AR HUD Revenue million Forecast, by Country 2019 & 2032
- Table 26: Global Automotive AR HUD Volume K Forecast, by Country 2019 & 2032
- Table 27: Brazil Automotive AR HUD Revenue (million) Forecast, by Application 2019 & 2032
- Table 28: Brazil Automotive AR HUD Volume (K) Forecast, by Application 2019 & 2032
- Table 29: Argentina Automotive AR HUD Revenue (million) Forecast, by Application 2019 & 2032
- Table 30: Argentina Automotive AR HUD Volume (K) Forecast, by Application 2019 & 2032
- Table 31: Rest of South America Automotive AR HUD Revenue (million) Forecast, by Application 2019 & 2032
- Table 32: Rest of South America Automotive AR HUD Volume (K) Forecast, by Application 2019 & 2032
- Table 33: Global Automotive AR HUD Revenue million Forecast, by Application 2019 & 2032
- Table 34: Global Automotive AR HUD Volume K Forecast, by Application 2019 & 2032
- Table 35: Global Automotive AR HUD Revenue million Forecast, by Types 2019 & 2032
- Table 36: Global Automotive AR HUD Volume K Forecast, by Types 2019 & 2032
- Table 37: Global Automotive AR HUD Revenue million Forecast, by Country 2019 & 2032
- Table 38: Global Automotive AR HUD Volume K Forecast, by Country 2019 & 2032
- Table 39: United Kingdom Automotive AR HUD Revenue (million) Forecast, by Application 2019 & 2032
- Table 40: United Kingdom Automotive AR HUD Volume (K) Forecast, by Application 2019 & 2032
- Table 41: Germany Automotive AR HUD Revenue (million) Forecast, by Application 2019 & 2032
- Table 42: Germany Automotive AR HUD Volume (K) Forecast, by Application 2019 & 2032
- Table 43: France Automotive AR HUD Revenue (million) Forecast, by Application 2019 & 2032
- Table 44: France Automotive AR HUD Volume (K) Forecast, by Application 2019 & 2032
- Table 45: Italy Automotive AR HUD Revenue (million) Forecast, by Application 2019 & 2032
- Table 46: Italy Automotive AR HUD Volume (K) Forecast, by Application 2019 & 2032
- Table 47: Spain Automotive AR HUD Revenue (million) Forecast, by Application 2019 & 2032
- Table 48: Spain Automotive AR HUD Volume (K) Forecast, by Application 2019 & 2032
- Table 49: Russia Automotive AR HUD Revenue (million) Forecast, by Application 2019 & 2032
- Table 50: Russia Automotive AR HUD Volume (K) Forecast, by Application 2019 & 2032
- Table 51: Benelux Automotive AR HUD Revenue (million) Forecast, by Application 2019 & 2032
- Table 52: Benelux Automotive AR HUD Volume (K) Forecast, by Application 2019 & 2032
- Table 53: Nordics Automotive AR HUD Revenue (million) Forecast, by Application 2019 & 2032
- Table 54: Nordics Automotive AR HUD Volume (K) Forecast, by Application 2019 & 2032
- Table 55: Rest of Europe Automotive AR HUD Revenue (million) Forecast, by Application 2019 & 2032
- Table 56: Rest of Europe Automotive AR HUD Volume (K) Forecast, by Application 2019 & 2032
- Table 57: Global Automotive AR HUD Revenue million Forecast, by Application 2019 & 2032
- Table 58: Global Automotive AR HUD Volume K Forecast, by Application 2019 & 2032
- Table 59: Global Automotive AR HUD Revenue million Forecast, by Types 2019 & 2032
- Table 60: Global Automotive AR HUD Volume K Forecast, by Types 2019 & 2032
- Table 61: Global Automotive AR HUD Revenue million Forecast, by Country 2019 & 2032
- Table 62: Global Automotive AR HUD Volume K Forecast, by Country 2019 & 2032
- Table 63: Turkey Automotive AR HUD Revenue (million) Forecast, by Application 2019 & 2032
- Table 64: Turkey Automotive AR HUD Volume (K) Forecast, by Application 2019 & 2032
- Table 65: Israel Automotive AR HUD Revenue (million) Forecast, by Application 2019 & 2032
- Table 66: Israel Automotive AR HUD Volume (K) Forecast, by Application 2019 & 2032
- Table 67: GCC Automotive AR HUD Revenue (million) Forecast, by Application 2019 & 2032
- Table 68: GCC Automotive AR HUD Volume (K) Forecast, by Application 2019 & 2032
- Table 69: North Africa Automotive AR HUD Revenue (million) Forecast, by Application 2019 & 2032
- Table 70: North Africa Automotive AR HUD Volume (K) Forecast, by Application 2019 & 2032
- Table 71: South Africa Automotive AR HUD Revenue (million) Forecast, by Application 2019 & 2032
- Table 72: South Africa Automotive AR HUD Volume (K) Forecast, by Application 2019 & 2032
- Table 73: Rest of Middle East & Africa Automotive AR HUD Revenue (million) Forecast, by Application 2019 & 2032
- Table 74: Rest of Middle East & Africa Automotive AR HUD Volume (K) Forecast, by Application 2019 & 2032
- Table 75: Global Automotive AR HUD Revenue million Forecast, by Application 2019 & 2032
- Table 76: Global Automotive AR HUD Volume K Forecast, by Application 2019 & 2032
- Table 77: Global Automotive AR HUD Revenue million Forecast, by Types 2019 & 2032
- Table 78: Global Automotive AR HUD Volume K Forecast, by Types 2019 & 2032
- Table 79: Global Automotive AR HUD Revenue million Forecast, by Country 2019 & 2032
- Table 80: Global Automotive AR HUD Volume K Forecast, by Country 2019 & 2032
- Table 81: China Automotive AR HUD Revenue (million) Forecast, by Application 2019 & 2032
- Table 82: China Automotive AR HUD Volume (K) Forecast, by Application 2019 & 2032
- Table 83: India Automotive AR HUD Revenue (million) Forecast, by Application 2019 & 2032
- Table 84: India Automotive AR HUD Volume (K) Forecast, by Application 2019 & 2032
- Table 85: Japan Automotive AR HUD Revenue (million) Forecast, by Application 2019 & 2032
- Table 86: Japan Automotive AR HUD Volume (K) Forecast, by Application 2019 & 2032
- Table 87: South Korea Automotive AR HUD Revenue (million) Forecast, by Application 2019 & 2032
- Table 88: South Korea Automotive AR HUD Volume (K) Forecast, by Application 2019 & 2032
- Table 89: ASEAN Automotive AR HUD Revenue (million) Forecast, by Application 2019 & 2032
- Table 90: ASEAN Automotive AR HUD Volume (K) Forecast, by Application 2019 & 2032
- Table 91: Oceania Automotive AR HUD Revenue (million) Forecast, by Application 2019 & 2032
- Table 92: Oceania Automotive AR HUD Volume (K) Forecast, by Application 2019 & 2032
- Table 93: Rest of Asia Pacific Automotive AR HUD Revenue (million) Forecast, by Application 2019 & 2032
- Table 94: Rest of Asia Pacific Automotive AR HUD Volume (K) Forecast, by Application 2019 & 2032
Frequently Asked Questions
1. What is the projected Compound Annual Growth Rate (CAGR) of the Automotive AR HUD?
The projected CAGR is approximately XX%.
2. Which companies are prominent players in the Automotive AR HUD?
Key companies in the market include Nippon Seiki, Continental AG, Panasonic Automotive, Konica Minolta, DENSO, Maxell, LG Electronic, Foryou, E-LEAD, Huawei, Ofilm Group, Crystal Optech, FUTURUS, Raythink, New Vision, Shenzhen 3-dragons Technology, Jiangcheng Technology, Qianhai Zinger Technology, YAZAKI METER, Carrot Technology, Shanghai Yesar Technology.
3. What are the main segments of the Automotive AR HUD?
The market segments include Application, Types.
4. Can you provide details about the market size?
The market size is estimated to be USD XXX million as of 2022.
5. What are some drivers contributing to market growth?
N/A
6. What are the notable trends driving market growth?
N/A
7. Are there any restraints impacting market growth?
N/A
8. Can you provide examples of recent developments in the market?
N/A
9. What pricing options are available for accessing the report?
Pricing options include single-user, multi-user, and enterprise licenses priced at USD 3350.00, USD 5025.00, and USD 6700.00 respectively.
10. Is the market size provided in terms of value or volume?
The market size is provided in terms of value, measured in million and volume, measured in K.
11. Are there any specific market keywords associated with the report?
Yes, the market keyword associated with the report is "Automotive AR HUD," which aids in identifying and referencing the specific market segment covered.
12. How do I determine which pricing option suits my needs best?
The pricing options vary based on user requirements and access needs. Individual users may opt for single-user licenses, while businesses requiring broader access may choose multi-user or enterprise licenses for cost-effective access to the report.
13. Are there any additional resources or data provided in the Automotive AR HUD report?
While the report offers comprehensive insights, it's advisable to review the specific contents or supplementary materials provided to ascertain if additional resources or data are available.
14. How can I stay updated on further developments or reports in the Automotive AR HUD?
To stay informed about further developments, trends, and reports in the Automotive AR HUD, consider subscribing to industry newsletters, following relevant companies and organizations, or regularly checking reputable industry news sources and publications.
Methodology
Step 1 - Identification of Relevant Samples Size from Population Database


Step 2 - Approaches for Defining Global Market Size (Value, Volume* & Price*)

Note*: In applicable scenarios
Step 3 - Data Sources
Primary Research
- Web Analytics
- Survey Reports
- Research Institute
- Latest Research Reports
- Opinion Leaders
Secondary Research
- Annual Reports
- White Paper
- Latest Press Release
- Industry Association
- Paid Database
- Investor Presentations

Step 4 - Data Triangulation
Involves using different sources of information in order to increase the validity of a study
These sources are likely to be stakeholders in a program - participants, other researchers, program staff, other community members, and so on.
Then we put all data in single framework & apply various statistical tools to find out the dynamic on the market.
During the analysis stage, feedback from the stakeholder groups would be compared to determine areas of agreement as well as areas of divergence


