
Key Insights
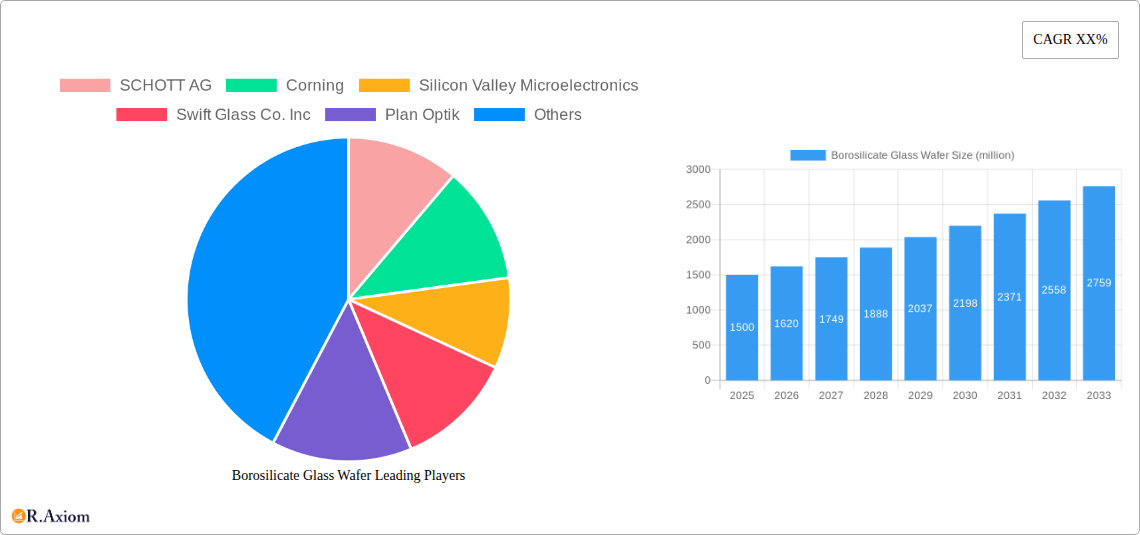
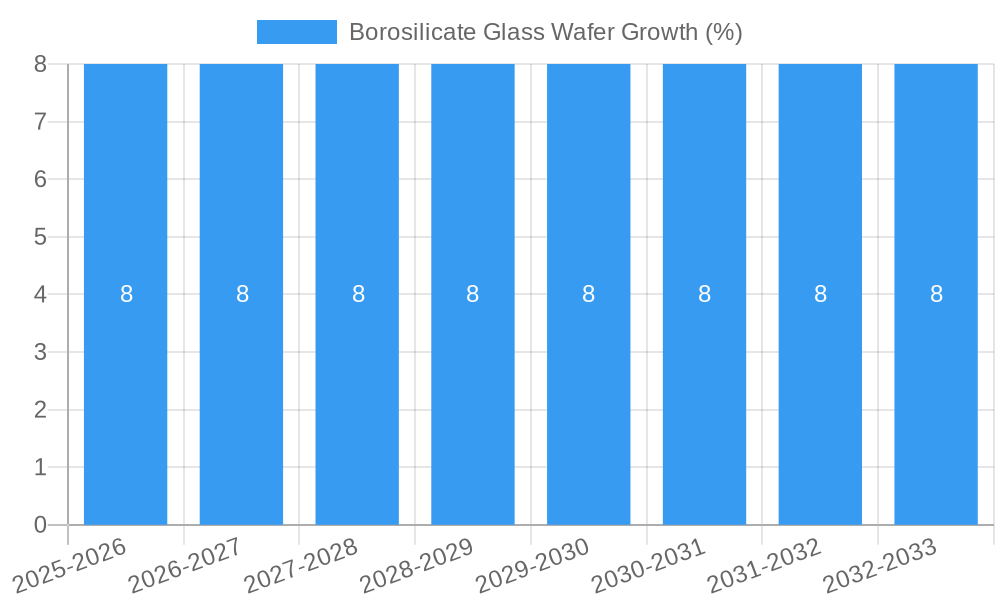
The global borosilicate glass wafer market is poised for substantial growth, projected to reach an estimated USD 1,500 million in 2025. This impressive expansion is driven by the burgeoning demand from critical sectors such as semiconductors and MEMS (Micro-Electro-Mechanical Systems) industries. Borosilicate glass, renowned for its exceptional thermal shock resistance, chemical inertness, and low thermal expansion, is becoming an indispensable material for advanced microfabrication processes. Its ability to withstand rigorous manufacturing environments makes it ideal for fabricating sophisticated sensors and other microelectronic components. The increasing miniaturization of electronic devices and the growing adoption of IoT (Internet of Things) solutions are directly fueling the need for high-quality borosilicate glass wafers, positioning the market for a compound annual growth rate (CAGR) of approximately 8% over the forecast period.
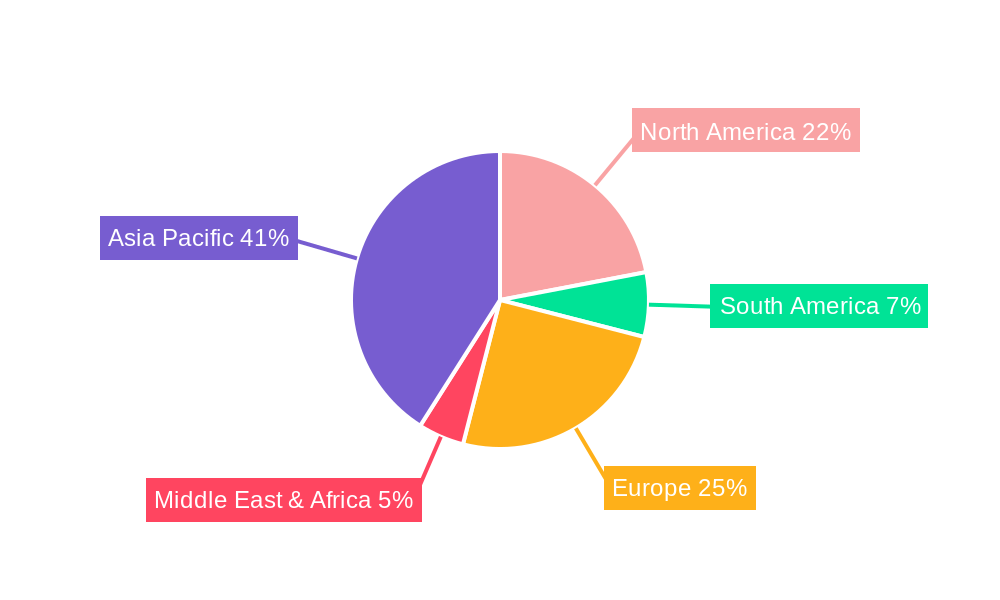
The market's robust growth trajectory is further bolstered by technological advancements and emerging applications. Innovations in wafer processing and surface treatments are enhancing the performance and versatility of borosilicate glass wafers, opening new avenues for their use in specialized sensor technologies, photonics, and advanced display manufacturing. While the market enjoys strong tailwinds, certain restraints, such as the intricate manufacturing processes and the need for specialized equipment, might present challenges. However, the increasing R&D investments by leading players like SCHOTT AG and Corning, alongside the growing adoption of these wafers across diverse applications, are expected to outweigh these limitations. The Asia Pacific region, particularly China and Japan, is anticipated to dominate the market share due to its strong manufacturing base and the rapid evolution of its semiconductor and electronics industries.
Borosilicate Glass Wafer Market Research Report: Comprehensive Analysis and Future Projections (2019-2033)
This in-depth market research report provides a detailed analysis of the global Borosilicate Glass Wafer market, encompassing a comprehensive study from 2019 to 2033, with a base year of 2025 and a forecast period extending from 2025 to 2033. The report delves into market concentration, innovation drivers, regulatory landscapes, competitive dynamics, emerging trends, and strategic outlooks, offering actionable insights for industry stakeholders. With an estimated market size reaching several million dollars, the borosilicate glass wafer market is a critical component for advancements in semiconductors, MEMS, sensors, and various other high-technology applications. This report is designed for immediate use, requiring no further modification, and provides a detailed exploration of the market's past, present, and future.
Borosilicate Glass Wafer Market Concentration & Innovation
The global borosilicate glass wafer market exhibits a moderate concentration, with key players investing heavily in research and development to drive innovation. Major companies like SCHOTT AG and Corning lead the charge, focusing on developing wafers with enhanced thermal shock resistance, superior chemical inertness, and precise dimensional stability. These advancements are crucial for the miniaturization and increased functionality demands in the semiconductor and MEMS industries. Regulatory frameworks, particularly those related to material safety and environmental compliance in manufacturing, play a significant role in shaping market dynamics. While direct product substitutes are limited, alternative materials for specific niche applications are under development, posing a potential long-term challenge. End-user trends indicate a growing preference for ultra-thin and high-purity borosilicate glass wafers, driven by the demand for sophisticated sensor technologies and advanced semiconductor packaging. Mergers and acquisitions (M&A) activities, although not extensive, have seen strategic investments aimed at consolidating market share and acquiring specialized technological capabilities. For instance, hypothetical M&A deals in the past few years have been valued in the tens of millions of dollars, reflecting the strategic importance of acquiring niche expertise.
- Market Share Dominance: Leading players collectively hold an estimated xx% of the market share.
- Innovation Drivers: Focus on material science advancements, improved manufacturing processes, and tailored wafer properties for specific applications.
- Regulatory Impact: Adherence to stringent quality control and environmental standards.
- M&A Activities: Strategic acquisitions to enhance product portfolios and market reach, with estimated deal values in the range of $20 million to $50 million annually.
Borosilicate Glass Wafer Industry Trends & Insights
The borosilicate glass wafer industry is poised for substantial growth, driven by escalating demand across its diverse application spectrum. The projected Compound Annual Growth Rate (CAGR) for the forecast period (2025–2033) is estimated at a robust xx%, indicating a thriving market. This growth is primarily fueled by the relentless expansion of the semiconductor industry, where borosilicate glass wafers are integral to the fabrication of integrated circuits and advanced packaging solutions. The increasing adoption of MEMS (Micro-Electro-Mechanical Systems) in consumer electronics, automotive applications, and industrial automation further bolsters demand for these specialized wafers. Furthermore, the burgeoning sensor market, encompassing environmental monitoring, medical devices, and smart home technologies, relies heavily on the unique properties of borosilicate glass, such as its low thermal expansion coefficient and excellent dielectric strength. Technological disruptions, including advancements in wafer processing techniques like chemical-mechanical planarization (CMP) and etching, are enabling the production of thinner and more precise wafers, meeting the ever-evolving requirements of high-tech manufacturing. Consumer preferences are shifting towards miniaturized, high-performance electronic devices, directly translating into a greater need for high-quality borosilicate glass wafers. The competitive dynamics of the market are characterized by a blend of established global players and emerging regional manufacturers, each striving to differentiate through product quality, customization capabilities, and cost-effectiveness. Market penetration of borosilicate glass wafers in new and emerging applications is steadily increasing, driven by ongoing innovation and the exploration of novel uses. The report anticipates that by 2033, the global borosilicate glass wafer market will be valued at several hundred million dollars, underscoring its strategic importance.
Dominant Markets & Segments in Borosilicate Glass Wafer
The borosilicate glass wafer market demonstrates significant regional and segmental dominance, with Asia-Pacific emerging as the leading geographical hub. This dominance is attributed to the region's robust manufacturing infrastructure for semiconductors, consumer electronics, and automotive components, where borosilicate glass wafers are indispensable. Within this region, countries like China, South Korea, Taiwan, and Japan are significant consumers and producers, driven by substantial government investments in high-technology sectors and favorable economic policies. The Semiconductor application segment stands out as the largest contributor to market revenue, accounting for an estimated xx% of the total market size. This is due to the continuous demand for advanced microprocessors, memory chips, and other semiconductor devices that utilize borosilicate glass wafers for their substrate and dielectric layers. The MEMS Industry segment represents another substantial and rapidly growing application, fueled by the increasing deployment of micro-sensors and actuators in smartphones, wearable devices, and the automotive sector for applications like airbag sensors and inertial measurement units. The Sensor segment, while slightly smaller than semiconductors, exhibits strong growth potential, driven by the expanding need for diverse sensor types in IoT devices, medical diagnostics, and environmental monitoring.
- Leading Region: Asia-Pacific, driven by China, South Korea, Taiwan, and Japan.
- Key Drivers: Extensive semiconductor manufacturing ecosystem, strong consumer electronics demand, supportive government initiatives for technological advancement, and significant automotive industry presence.
- Dominant Application Segment: Semiconductor.
- Key Drivers: Essential for integrated circuit fabrication, advanced packaging, and wafer-level packaging technologies.
- High-Growth Application Segment: MEMS Industry and Sensor applications.
- Key Drivers: Miniaturization of devices, proliferation of IoT technologies, increasing demand for smart automotive features, and advancements in medical devices.
- Dominant Wafer Size: The 4-inch and 6-inch borosilicate glass wafers currently command significant market share due to their widespread use in established semiconductor and MEMS manufacturing processes. However, the demand for smaller (2-inch and 3-inch) and larger (8-inch and above) wafers is also growing, catering to specific niche applications and next-generation device requirements.
Borosilicate Glass Wafer Product Developments
Product development in the borosilicate glass wafer market is primarily focused on enhancing material properties and manufacturing precision. Innovations include the development of ultra-thin wafers (down to tens of micrometers), wafers with specialized coatings for improved adhesion and conductivity, and glass compositions with tailored thermal expansion coefficients for specific operating environments. These developments offer competitive advantages by enabling the creation of smaller, more powerful, and more reliable electronic components. The applications span from high-performance semiconductors and sophisticated MEMS devices to advanced optical sensors and next-generation display technologies.
Report Scope & Segmentation Analysis
This report meticulously segments the borosilicate glass wafer market across key categories. The Application segmentation includes Semiconductor, MEMS Industry, Sensor, and Others. The Semiconductor segment, estimated at a market size of $XX million in 2025, is expected to grow at a CAGR of xx% through 2033, driven by demand in advanced lithography and packaging. The MEMS Industry segment, valued at $XX million in 2025, is projected to expand at a CAGR of xx%, fueled by automotive and consumer electronics. The Sensor segment, with a 2025 market value of $XX million, forecasts a CAGR of xx%, driven by IoT and medical applications. The Others segment encompasses diverse applications like optical components and specialty substrates. The Types segmentation includes 2 inch, 3 inch, 4 inch, and Others. The 4 inch segment, estimated at $XX million in 2025, is expected to see a CAGR of xx%. The 2 inch and 3 inch segments, though smaller, are growing rapidly at estimated CAGRs of xx% and xx% respectively, catering to specialized needs. The Others segment, including larger diameter wafers, is also projected for significant growth.
Key Drivers of Borosilicate Glass Wafer Growth
The borosilicate glass wafer market is propelled by several key drivers. Technologically, the miniaturization trend in electronics necessitates wafer materials with exceptional precision and stability. The burgeoning demand for advanced sensors in automotive, medical, and IoT applications, where borosilicate glass offers superior chemical and thermal resistance, is a significant growth catalyst. Economically, increasing global investments in semiconductor manufacturing capacity and the expansion of the smart device market are driving demand. Regulatory factors, such as the push for more energy-efficient electronic components and the need for robust materials in critical infrastructure, also contribute to market growth.
- Technological Advancements: Miniaturization of electronic components, demand for high-performance sensors.
- Market Expansion: Growth in automotive electronics, IoT devices, and medical diagnostic equipment.
- Economic Factors: Increased global investments in semiconductor fabrication, rising consumer spending on smart devices.
- Regulatory Support: Emphasis on energy efficiency, material durability in critical applications.
Challenges in the Borosilicate Glass Wafer Sector
Despite robust growth, the borosilicate glass wafer sector faces several challenges. Stringent quality control requirements and the high cost of specialized manufacturing equipment can act as barriers to entry for new players. Fluctuations in raw material prices and potential supply chain disruptions for key components can impact production costs and lead times. Intense competition from established players and the potential for material substitutions in certain niche applications pose ongoing competitive pressures. Achieving ultra-high purity levels and extremely tight tolerances on very large diameter wafers also presents significant manufacturing hurdles.
- High Manufacturing Costs: Specialized equipment and processes contribute to elevated production expenses.
- Supply Chain Volatility: Dependence on specific raw materials and potential disruptions.
- Competitive Landscape: Intense competition among established and emerging manufacturers.
- Technical Complexity: Achieving extremely high purity and precise dimensional control.
Emerging Opportunities in Borosilicate Glass Wafer
Emerging opportunities for borosilicate glass wafers lie in their application in next-generation technologies. The rapidly expanding quantum computing sector, for instance, requires highly specialized substrates with exceptional thermal and electrical properties, where borosilicate glass could play a crucial role. The development of advanced displays, including flexible and transparent screens, also presents new avenues for the use of precisely engineered glass wafers. Furthermore, the growing focus on sustainable electronics and materials is creating opportunities for borosilicate glass, known for its durability and recyclability potential, in eco-friendly device designs. Expansion into new geographical markets with growing high-tech manufacturing bases also represents a significant opportunity.
- Quantum Computing Substrates: Requirements for unique material properties in qubit fabrication.
- Advanced Display Technologies: Use in flexible, transparent, and high-resolution displays.
- Sustainable Electronics: Demand for durable and recyclable materials.
- Emerging Geographic Markets: Expansion into developing high-tech manufacturing hubs.
Leading Players in the Borosilicate Glass Wafer Market
- SCHOTT AG
- Corning
- Silicon Valley Microelectronics
- Swift Glass Co. Inc
- Plan Optik
- PräzisionsGlas&Optik GmbH
- Nanografi Nano Technology
- PhotonExport
- YEK Glass
- Hoya Candeo Optronics Corporation
Key Developments in Borosilicate Glass Wafer Industry
- 2023: SCHOTT AG announced advancements in its borosilicate glass formulations, enabling improved performance in extreme temperature applications for semiconductor manufacturing.
- 2022: Corning unveiled new ultra-thin borosilicate glass wafers with enhanced mechanical strength for advanced MEMS devices.
- 2021: Plan Optik expanded its production capacity for high-purity borosilicate glass wafers to meet growing demand from the sensor industry.
- 2020: Silicon Valley Microelectronics introduced a new line of customized borosilicate glass wafers with precise etching capabilities.
- 2019: Swift Glass Co. Inc. acquired a smaller competitor, expanding its product portfolio in specialty glass solutions for various industries.
Strategic Outlook for Borosilicate Glass Wafer Market
The strategic outlook for the borosilicate glass wafer market is overwhelmingly positive, driven by continuous innovation and expanding applications. Key growth catalysts include the sustained demand from the semiconductor and MEMS industries, coupled with the emergence of new high-growth sectors like quantum computing and advanced displays. Strategic partnerships between glass manufacturers and end-product developers will be crucial for tailoring wafer specifications to meet evolving technological requirements. Investments in advanced manufacturing technologies and a focus on sustainability will further enhance market competitiveness. The market is expected to witness significant growth in specialized and high-value segments, with a continued emphasis on product quality, customization, and reliability.
Borosilicate Glass Wafer Segmentation
-
1. Application
- 1.1. Semiconductor
- 1.2. MEMS Industry
- 1.3. Sensor
- 1.4. Others
-
2. Types
- 2.1. 2 inch
- 2.2. 3 inch
- 2.3. 4 inch
- 2.4. Others
Borosilicate Glass Wafer Segmentation By Geography
-
1. North America
- 1.1. United States
- 1.2. Canada
- 1.3. Mexico
-
2. South America
- 2.1. Brazil
- 2.2. Argentina
- 2.3. Rest of South America
-
3. Europe
- 3.1. United Kingdom
- 3.2. Germany
- 3.3. France
- 3.4. Italy
- 3.5. Spain
- 3.6. Russia
- 3.7. Benelux
- 3.8. Nordics
- 3.9. Rest of Europe
-
4. Middle East & Africa
- 4.1. Turkey
- 4.2. Israel
- 4.3. GCC
- 4.4. North Africa
- 4.5. South Africa
- 4.6. Rest of Middle East & Africa
-
5. Asia Pacific
- 5.1. China
- 5.2. India
- 5.3. Japan
- 5.4. South Korea
- 5.5. ASEAN
- 5.6. Oceania
- 5.7. Rest of Asia Pacific
Borosilicate Glass Wafer REPORT HIGHLIGHTS
| Aspects | Details |
|---|---|
| Study Period | 2019-2033 |
| Base Year | 2024 |
| Estimated Year | 2025 |
| Forecast Period | 2025-2033 |
| Historical Period | 2019-2024 |
| Growth Rate | CAGR of XX% from 2019-2033 |
| Segmentation |
|
Table of Contents
- 1. Introduction
- 1.1. Research Scope
- 1.2. Market Segmentation
- 1.3. Research Methodology
- 1.4. Definitions and Assumptions
- 2. Executive Summary
- 2.1. Introduction
- 3. Market Dynamics
- 3.1. Introduction
- 3.2. Market Drivers
- 3.3. Market Restrains
- 3.4. Market Trends
- 4. Market Factor Analysis
- 4.1. Porters Five Forces
- 4.2. Supply/Value Chain
- 4.3. PESTEL analysis
- 4.4. Market Entropy
- 4.5. Patent/Trademark Analysis
- 5. Global Borosilicate Glass Wafer Analysis, Insights and Forecast, 2019-2031
- 5.1. Market Analysis, Insights and Forecast - by Application
- 5.1.1. Semiconductor
- 5.1.2. MEMS Industry
- 5.1.3. Sensor
- 5.1.4. Others
- 5.2. Market Analysis, Insights and Forecast - by Types
- 5.2.1. 2 inch
- 5.2.2. 3 inch
- 5.2.3. 4 inch
- 5.2.4. Others
- 5.3. Market Analysis, Insights and Forecast - by Region
- 5.3.1. North America
- 5.3.2. South America
- 5.3.3. Europe
- 5.3.4. Middle East & Africa
- 5.3.5. Asia Pacific
- 5.1. Market Analysis, Insights and Forecast - by Application
- 6. North America Borosilicate Glass Wafer Analysis, Insights and Forecast, 2019-2031
- 6.1. Market Analysis, Insights and Forecast - by Application
- 6.1.1. Semiconductor
- 6.1.2. MEMS Industry
- 6.1.3. Sensor
- 6.1.4. Others
- 6.2. Market Analysis, Insights and Forecast - by Types
- 6.2.1. 2 inch
- 6.2.2. 3 inch
- 6.2.3. 4 inch
- 6.2.4. Others
- 6.1. Market Analysis, Insights and Forecast - by Application
- 7. South America Borosilicate Glass Wafer Analysis, Insights and Forecast, 2019-2031
- 7.1. Market Analysis, Insights and Forecast - by Application
- 7.1.1. Semiconductor
- 7.1.2. MEMS Industry
- 7.1.3. Sensor
- 7.1.4. Others
- 7.2. Market Analysis, Insights and Forecast - by Types
- 7.2.1. 2 inch
- 7.2.2. 3 inch
- 7.2.3. 4 inch
- 7.2.4. Others
- 7.1. Market Analysis, Insights and Forecast - by Application
- 8. Europe Borosilicate Glass Wafer Analysis, Insights and Forecast, 2019-2031
- 8.1. Market Analysis, Insights and Forecast - by Application
- 8.1.1. Semiconductor
- 8.1.2. MEMS Industry
- 8.1.3. Sensor
- 8.1.4. Others
- 8.2. Market Analysis, Insights and Forecast - by Types
- 8.2.1. 2 inch
- 8.2.2. 3 inch
- 8.2.3. 4 inch
- 8.2.4. Others
- 8.1. Market Analysis, Insights and Forecast - by Application
- 9. Middle East & Africa Borosilicate Glass Wafer Analysis, Insights and Forecast, 2019-2031
- 9.1. Market Analysis, Insights and Forecast - by Application
- 9.1.1. Semiconductor
- 9.1.2. MEMS Industry
- 9.1.3. Sensor
- 9.1.4. Others
- 9.2. Market Analysis, Insights and Forecast - by Types
- 9.2.1. 2 inch
- 9.2.2. 3 inch
- 9.2.3. 4 inch
- 9.2.4. Others
- 9.1. Market Analysis, Insights and Forecast - by Application
- 10. Asia Pacific Borosilicate Glass Wafer Analysis, Insights and Forecast, 2019-2031
- 10.1. Market Analysis, Insights and Forecast - by Application
- 10.1.1. Semiconductor
- 10.1.2. MEMS Industry
- 10.1.3. Sensor
- 10.1.4. Others
- 10.2. Market Analysis, Insights and Forecast - by Types
- 10.2.1. 2 inch
- 10.2.2. 3 inch
- 10.2.3. 4 inch
- 10.2.4. Others
- 10.1. Market Analysis, Insights and Forecast - by Application
- 11. Competitive Analysis
- 11.1. Global Market Share Analysis 2024
- 11.2. Company Profiles
- 11.2.1 SCHOTT AG
- 11.2.1.1. Overview
- 11.2.1.2. Products
- 11.2.1.3. SWOT Analysis
- 11.2.1.4. Recent Developments
- 11.2.1.5. Financials (Based on Availability)
- 11.2.2 Corning
- 11.2.2.1. Overview
- 11.2.2.2. Products
- 11.2.2.3. SWOT Analysis
- 11.2.2.4. Recent Developments
- 11.2.2.5. Financials (Based on Availability)
- 11.2.3 Silicon Valley Microelectronics
- 11.2.3.1. Overview
- 11.2.3.2. Products
- 11.2.3.3. SWOT Analysis
- 11.2.3.4. Recent Developments
- 11.2.3.5. Financials (Based on Availability)
- 11.2.4 Swift Glass Co. Inc
- 11.2.4.1. Overview
- 11.2.4.2. Products
- 11.2.4.3. SWOT Analysis
- 11.2.4.4. Recent Developments
- 11.2.4.5. Financials (Based on Availability)
- 11.2.5 Plan Optik
- 11.2.5.1. Overview
- 11.2.5.2. Products
- 11.2.5.3. SWOT Analysis
- 11.2.5.4. Recent Developments
- 11.2.5.5. Financials (Based on Availability)
- 11.2.6 PräzisionsGlas&Optik GmbH
- 11.2.6.1. Overview
- 11.2.6.2. Products
- 11.2.6.3. SWOT Analysis
- 11.2.6.4. Recent Developments
- 11.2.6.5. Financials (Based on Availability)
- 11.2.7 Nanografi Nano Technology
- 11.2.7.1. Overview
- 11.2.7.2. Products
- 11.2.7.3. SWOT Analysis
- 11.2.7.4. Recent Developments
- 11.2.7.5. Financials (Based on Availability)
- 11.2.8 PhotonExport
- 11.2.8.1. Overview
- 11.2.8.2. Products
- 11.2.8.3. SWOT Analysis
- 11.2.8.4. Recent Developments
- 11.2.8.5. Financials (Based on Availability)
- 11.2.9 YEK Glass
- 11.2.9.1. Overview
- 11.2.9.2. Products
- 11.2.9.3. SWOT Analysis
- 11.2.9.4. Recent Developments
- 11.2.9.5. Financials (Based on Availability)
- 11.2.10 Hoya Candeo Optronics Corporation
- 11.2.10.1. Overview
- 11.2.10.2. Products
- 11.2.10.3. SWOT Analysis
- 11.2.10.4. Recent Developments
- 11.2.10.5. Financials (Based on Availability)
- 11.2.1 SCHOTT AG
List of Figures
- Figure 1: Global Borosilicate Glass Wafer Revenue Breakdown (million, %) by Region 2024 & 2032
- Figure 2: Global Borosilicate Glass Wafer Volume Breakdown (K, %) by Region 2024 & 2032
- Figure 3: North America Borosilicate Glass Wafer Revenue (million), by Application 2024 & 2032
- Figure 4: North America Borosilicate Glass Wafer Volume (K), by Application 2024 & 2032
- Figure 5: North America Borosilicate Glass Wafer Revenue Share (%), by Application 2024 & 2032
- Figure 6: North America Borosilicate Glass Wafer Volume Share (%), by Application 2024 & 2032
- Figure 7: North America Borosilicate Glass Wafer Revenue (million), by Types 2024 & 2032
- Figure 8: North America Borosilicate Glass Wafer Volume (K), by Types 2024 & 2032
- Figure 9: North America Borosilicate Glass Wafer Revenue Share (%), by Types 2024 & 2032
- Figure 10: North America Borosilicate Glass Wafer Volume Share (%), by Types 2024 & 2032
- Figure 11: North America Borosilicate Glass Wafer Revenue (million), by Country 2024 & 2032
- Figure 12: North America Borosilicate Glass Wafer Volume (K), by Country 2024 & 2032
- Figure 13: North America Borosilicate Glass Wafer Revenue Share (%), by Country 2024 & 2032
- Figure 14: North America Borosilicate Glass Wafer Volume Share (%), by Country 2024 & 2032
- Figure 15: South America Borosilicate Glass Wafer Revenue (million), by Application 2024 & 2032
- Figure 16: South America Borosilicate Glass Wafer Volume (K), by Application 2024 & 2032
- Figure 17: South America Borosilicate Glass Wafer Revenue Share (%), by Application 2024 & 2032
- Figure 18: South America Borosilicate Glass Wafer Volume Share (%), by Application 2024 & 2032
- Figure 19: South America Borosilicate Glass Wafer Revenue (million), by Types 2024 & 2032
- Figure 20: South America Borosilicate Glass Wafer Volume (K), by Types 2024 & 2032
- Figure 21: South America Borosilicate Glass Wafer Revenue Share (%), by Types 2024 & 2032
- Figure 22: South America Borosilicate Glass Wafer Volume Share (%), by Types 2024 & 2032
- Figure 23: South America Borosilicate Glass Wafer Revenue (million), by Country 2024 & 2032
- Figure 24: South America Borosilicate Glass Wafer Volume (K), by Country 2024 & 2032
- Figure 25: South America Borosilicate Glass Wafer Revenue Share (%), by Country 2024 & 2032
- Figure 26: South America Borosilicate Glass Wafer Volume Share (%), by Country 2024 & 2032
- Figure 27: Europe Borosilicate Glass Wafer Revenue (million), by Application 2024 & 2032
- Figure 28: Europe Borosilicate Glass Wafer Volume (K), by Application 2024 & 2032
- Figure 29: Europe Borosilicate Glass Wafer Revenue Share (%), by Application 2024 & 2032
- Figure 30: Europe Borosilicate Glass Wafer Volume Share (%), by Application 2024 & 2032
- Figure 31: Europe Borosilicate Glass Wafer Revenue (million), by Types 2024 & 2032
- Figure 32: Europe Borosilicate Glass Wafer Volume (K), by Types 2024 & 2032
- Figure 33: Europe Borosilicate Glass Wafer Revenue Share (%), by Types 2024 & 2032
- Figure 34: Europe Borosilicate Glass Wafer Volume Share (%), by Types 2024 & 2032
- Figure 35: Europe Borosilicate Glass Wafer Revenue (million), by Country 2024 & 2032
- Figure 36: Europe Borosilicate Glass Wafer Volume (K), by Country 2024 & 2032
- Figure 37: Europe Borosilicate Glass Wafer Revenue Share (%), by Country 2024 & 2032
- Figure 38: Europe Borosilicate Glass Wafer Volume Share (%), by Country 2024 & 2032
- Figure 39: Middle East & Africa Borosilicate Glass Wafer Revenue (million), by Application 2024 & 2032
- Figure 40: Middle East & Africa Borosilicate Glass Wafer Volume (K), by Application 2024 & 2032
- Figure 41: Middle East & Africa Borosilicate Glass Wafer Revenue Share (%), by Application 2024 & 2032
- Figure 42: Middle East & Africa Borosilicate Glass Wafer Volume Share (%), by Application 2024 & 2032
- Figure 43: Middle East & Africa Borosilicate Glass Wafer Revenue (million), by Types 2024 & 2032
- Figure 44: Middle East & Africa Borosilicate Glass Wafer Volume (K), by Types 2024 & 2032
- Figure 45: Middle East & Africa Borosilicate Glass Wafer Revenue Share (%), by Types 2024 & 2032
- Figure 46: Middle East & Africa Borosilicate Glass Wafer Volume Share (%), by Types 2024 & 2032
- Figure 47: Middle East & Africa Borosilicate Glass Wafer Revenue (million), by Country 2024 & 2032
- Figure 48: Middle East & Africa Borosilicate Glass Wafer Volume (K), by Country 2024 & 2032
- Figure 49: Middle East & Africa Borosilicate Glass Wafer Revenue Share (%), by Country 2024 & 2032
- Figure 50: Middle East & Africa Borosilicate Glass Wafer Volume Share (%), by Country 2024 & 2032
- Figure 51: Asia Pacific Borosilicate Glass Wafer Revenue (million), by Application 2024 & 2032
- Figure 52: Asia Pacific Borosilicate Glass Wafer Volume (K), by Application 2024 & 2032
- Figure 53: Asia Pacific Borosilicate Glass Wafer Revenue Share (%), by Application 2024 & 2032
- Figure 54: Asia Pacific Borosilicate Glass Wafer Volume Share (%), by Application 2024 & 2032
- Figure 55: Asia Pacific Borosilicate Glass Wafer Revenue (million), by Types 2024 & 2032
- Figure 56: Asia Pacific Borosilicate Glass Wafer Volume (K), by Types 2024 & 2032
- Figure 57: Asia Pacific Borosilicate Glass Wafer Revenue Share (%), by Types 2024 & 2032
- Figure 58: Asia Pacific Borosilicate Glass Wafer Volume Share (%), by Types 2024 & 2032
- Figure 59: Asia Pacific Borosilicate Glass Wafer Revenue (million), by Country 2024 & 2032
- Figure 60: Asia Pacific Borosilicate Glass Wafer Volume (K), by Country 2024 & 2032
- Figure 61: Asia Pacific Borosilicate Glass Wafer Revenue Share (%), by Country 2024 & 2032
- Figure 62: Asia Pacific Borosilicate Glass Wafer Volume Share (%), by Country 2024 & 2032
List of Tables
- Table 1: Global Borosilicate Glass Wafer Revenue million Forecast, by Region 2019 & 2032
- Table 2: Global Borosilicate Glass Wafer Volume K Forecast, by Region 2019 & 2032
- Table 3: Global Borosilicate Glass Wafer Revenue million Forecast, by Application 2019 & 2032
- Table 4: Global Borosilicate Glass Wafer Volume K Forecast, by Application 2019 & 2032
- Table 5: Global Borosilicate Glass Wafer Revenue million Forecast, by Types 2019 & 2032
- Table 6: Global Borosilicate Glass Wafer Volume K Forecast, by Types 2019 & 2032
- Table 7: Global Borosilicate Glass Wafer Revenue million Forecast, by Region 2019 & 2032
- Table 8: Global Borosilicate Glass Wafer Volume K Forecast, by Region 2019 & 2032
- Table 9: Global Borosilicate Glass Wafer Revenue million Forecast, by Application 2019 & 2032
- Table 10: Global Borosilicate Glass Wafer Volume K Forecast, by Application 2019 & 2032
- Table 11: Global Borosilicate Glass Wafer Revenue million Forecast, by Types 2019 & 2032
- Table 12: Global Borosilicate Glass Wafer Volume K Forecast, by Types 2019 & 2032
- Table 13: Global Borosilicate Glass Wafer Revenue million Forecast, by Country 2019 & 2032
- Table 14: Global Borosilicate Glass Wafer Volume K Forecast, by Country 2019 & 2032
- Table 15: United States Borosilicate Glass Wafer Revenue (million) Forecast, by Application 2019 & 2032
- Table 16: United States Borosilicate Glass Wafer Volume (K) Forecast, by Application 2019 & 2032
- Table 17: Canada Borosilicate Glass Wafer Revenue (million) Forecast, by Application 2019 & 2032
- Table 18: Canada Borosilicate Glass Wafer Volume (K) Forecast, by Application 2019 & 2032
- Table 19: Mexico Borosilicate Glass Wafer Revenue (million) Forecast, by Application 2019 & 2032
- Table 20: Mexico Borosilicate Glass Wafer Volume (K) Forecast, by Application 2019 & 2032
- Table 21: Global Borosilicate Glass Wafer Revenue million Forecast, by Application 2019 & 2032
- Table 22: Global Borosilicate Glass Wafer Volume K Forecast, by Application 2019 & 2032
- Table 23: Global Borosilicate Glass Wafer Revenue million Forecast, by Types 2019 & 2032
- Table 24: Global Borosilicate Glass Wafer Volume K Forecast, by Types 2019 & 2032
- Table 25: Global Borosilicate Glass Wafer Revenue million Forecast, by Country 2019 & 2032
- Table 26: Global Borosilicate Glass Wafer Volume K Forecast, by Country 2019 & 2032
- Table 27: Brazil Borosilicate Glass Wafer Revenue (million) Forecast, by Application 2019 & 2032
- Table 28: Brazil Borosilicate Glass Wafer Volume (K) Forecast, by Application 2019 & 2032
- Table 29: Argentina Borosilicate Glass Wafer Revenue (million) Forecast, by Application 2019 & 2032
- Table 30: Argentina Borosilicate Glass Wafer Volume (K) Forecast, by Application 2019 & 2032
- Table 31: Rest of South America Borosilicate Glass Wafer Revenue (million) Forecast, by Application 2019 & 2032
- Table 32: Rest of South America Borosilicate Glass Wafer Volume (K) Forecast, by Application 2019 & 2032
- Table 33: Global Borosilicate Glass Wafer Revenue million Forecast, by Application 2019 & 2032
- Table 34: Global Borosilicate Glass Wafer Volume K Forecast, by Application 2019 & 2032
- Table 35: Global Borosilicate Glass Wafer Revenue million Forecast, by Types 2019 & 2032
- Table 36: Global Borosilicate Glass Wafer Volume K Forecast, by Types 2019 & 2032
- Table 37: Global Borosilicate Glass Wafer Revenue million Forecast, by Country 2019 & 2032
- Table 38: Global Borosilicate Glass Wafer Volume K Forecast, by Country 2019 & 2032
- Table 39: United Kingdom Borosilicate Glass Wafer Revenue (million) Forecast, by Application 2019 & 2032
- Table 40: United Kingdom Borosilicate Glass Wafer Volume (K) Forecast, by Application 2019 & 2032
- Table 41: Germany Borosilicate Glass Wafer Revenue (million) Forecast, by Application 2019 & 2032
- Table 42: Germany Borosilicate Glass Wafer Volume (K) Forecast, by Application 2019 & 2032
- Table 43: France Borosilicate Glass Wafer Revenue (million) Forecast, by Application 2019 & 2032
- Table 44: France Borosilicate Glass Wafer Volume (K) Forecast, by Application 2019 & 2032
- Table 45: Italy Borosilicate Glass Wafer Revenue (million) Forecast, by Application 2019 & 2032
- Table 46: Italy Borosilicate Glass Wafer Volume (K) Forecast, by Application 2019 & 2032
- Table 47: Spain Borosilicate Glass Wafer Revenue (million) Forecast, by Application 2019 & 2032
- Table 48: Spain Borosilicate Glass Wafer Volume (K) Forecast, by Application 2019 & 2032
- Table 49: Russia Borosilicate Glass Wafer Revenue (million) Forecast, by Application 2019 & 2032
- Table 50: Russia Borosilicate Glass Wafer Volume (K) Forecast, by Application 2019 & 2032
- Table 51: Benelux Borosilicate Glass Wafer Revenue (million) Forecast, by Application 2019 & 2032
- Table 52: Benelux Borosilicate Glass Wafer Volume (K) Forecast, by Application 2019 & 2032
- Table 53: Nordics Borosilicate Glass Wafer Revenue (million) Forecast, by Application 2019 & 2032
- Table 54: Nordics Borosilicate Glass Wafer Volume (K) Forecast, by Application 2019 & 2032
- Table 55: Rest of Europe Borosilicate Glass Wafer Revenue (million) Forecast, by Application 2019 & 2032
- Table 56: Rest of Europe Borosilicate Glass Wafer Volume (K) Forecast, by Application 2019 & 2032
- Table 57: Global Borosilicate Glass Wafer Revenue million Forecast, by Application 2019 & 2032
- Table 58: Global Borosilicate Glass Wafer Volume K Forecast, by Application 2019 & 2032
- Table 59: Global Borosilicate Glass Wafer Revenue million Forecast, by Types 2019 & 2032
- Table 60: Global Borosilicate Glass Wafer Volume K Forecast, by Types 2019 & 2032
- Table 61: Global Borosilicate Glass Wafer Revenue million Forecast, by Country 2019 & 2032
- Table 62: Global Borosilicate Glass Wafer Volume K Forecast, by Country 2019 & 2032
- Table 63: Turkey Borosilicate Glass Wafer Revenue (million) Forecast, by Application 2019 & 2032
- Table 64: Turkey Borosilicate Glass Wafer Volume (K) Forecast, by Application 2019 & 2032
- Table 65: Israel Borosilicate Glass Wafer Revenue (million) Forecast, by Application 2019 & 2032
- Table 66: Israel Borosilicate Glass Wafer Volume (K) Forecast, by Application 2019 & 2032
- Table 67: GCC Borosilicate Glass Wafer Revenue (million) Forecast, by Application 2019 & 2032
- Table 68: GCC Borosilicate Glass Wafer Volume (K) Forecast, by Application 2019 & 2032
- Table 69: North Africa Borosilicate Glass Wafer Revenue (million) Forecast, by Application 2019 & 2032
- Table 70: North Africa Borosilicate Glass Wafer Volume (K) Forecast, by Application 2019 & 2032
- Table 71: South Africa Borosilicate Glass Wafer Revenue (million) Forecast, by Application 2019 & 2032
- Table 72: South Africa Borosilicate Glass Wafer Volume (K) Forecast, by Application 2019 & 2032
- Table 73: Rest of Middle East & Africa Borosilicate Glass Wafer Revenue (million) Forecast, by Application 2019 & 2032
- Table 74: Rest of Middle East & Africa Borosilicate Glass Wafer Volume (K) Forecast, by Application 2019 & 2032
- Table 75: Global Borosilicate Glass Wafer Revenue million Forecast, by Application 2019 & 2032
- Table 76: Global Borosilicate Glass Wafer Volume K Forecast, by Application 2019 & 2032
- Table 77: Global Borosilicate Glass Wafer Revenue million Forecast, by Types 2019 & 2032
- Table 78: Global Borosilicate Glass Wafer Volume K Forecast, by Types 2019 & 2032
- Table 79: Global Borosilicate Glass Wafer Revenue million Forecast, by Country 2019 & 2032
- Table 80: Global Borosilicate Glass Wafer Volume K Forecast, by Country 2019 & 2032
- Table 81: China Borosilicate Glass Wafer Revenue (million) Forecast, by Application 2019 & 2032
- Table 82: China Borosilicate Glass Wafer Volume (K) Forecast, by Application 2019 & 2032
- Table 83: India Borosilicate Glass Wafer Revenue (million) Forecast, by Application 2019 & 2032
- Table 84: India Borosilicate Glass Wafer Volume (K) Forecast, by Application 2019 & 2032
- Table 85: Japan Borosilicate Glass Wafer Revenue (million) Forecast, by Application 2019 & 2032
- Table 86: Japan Borosilicate Glass Wafer Volume (K) Forecast, by Application 2019 & 2032
- Table 87: South Korea Borosilicate Glass Wafer Revenue (million) Forecast, by Application 2019 & 2032
- Table 88: South Korea Borosilicate Glass Wafer Volume (K) Forecast, by Application 2019 & 2032
- Table 89: ASEAN Borosilicate Glass Wafer Revenue (million) Forecast, by Application 2019 & 2032
- Table 90: ASEAN Borosilicate Glass Wafer Volume (K) Forecast, by Application 2019 & 2032
- Table 91: Oceania Borosilicate Glass Wafer Revenue (million) Forecast, by Application 2019 & 2032
- Table 92: Oceania Borosilicate Glass Wafer Volume (K) Forecast, by Application 2019 & 2032
- Table 93: Rest of Asia Pacific Borosilicate Glass Wafer Revenue (million) Forecast, by Application 2019 & 2032
- Table 94: Rest of Asia Pacific Borosilicate Glass Wafer Volume (K) Forecast, by Application 2019 & 2032
Frequently Asked Questions
1. What is the projected Compound Annual Growth Rate (CAGR) of the Borosilicate Glass Wafer?
The projected CAGR is approximately XX%.
2. Which companies are prominent players in the Borosilicate Glass Wafer?
Key companies in the market include SCHOTT AG, Corning, Silicon Valley Microelectronics, Swift Glass Co. Inc, Plan Optik, PräzisionsGlas&Optik GmbH, Nanografi Nano Technology, PhotonExport, YEK Glass, Hoya Candeo Optronics Corporation.
3. What are the main segments of the Borosilicate Glass Wafer?
The market segments include Application, Types.
4. Can you provide details about the market size?
The market size is estimated to be USD XXX million as of 2022.
5. What are some drivers contributing to market growth?
N/A
6. What are the notable trends driving market growth?
N/A
7. Are there any restraints impacting market growth?
N/A
8. Can you provide examples of recent developments in the market?
N/A
9. What pricing options are available for accessing the report?
Pricing options include single-user, multi-user, and enterprise licenses priced at USD 3350.00, USD 5025.00, and USD 6700.00 respectively.
10. Is the market size provided in terms of value or volume?
The market size is provided in terms of value, measured in million and volume, measured in K.
11. Are there any specific market keywords associated with the report?
Yes, the market keyword associated with the report is "Borosilicate Glass Wafer," which aids in identifying and referencing the specific market segment covered.
12. How do I determine which pricing option suits my needs best?
The pricing options vary based on user requirements and access needs. Individual users may opt for single-user licenses, while businesses requiring broader access may choose multi-user or enterprise licenses for cost-effective access to the report.
13. Are there any additional resources or data provided in the Borosilicate Glass Wafer report?
While the report offers comprehensive insights, it's advisable to review the specific contents or supplementary materials provided to ascertain if additional resources or data are available.
14. How can I stay updated on further developments or reports in the Borosilicate Glass Wafer?
To stay informed about further developments, trends, and reports in the Borosilicate Glass Wafer, consider subscribing to industry newsletters, following relevant companies and organizations, or regularly checking reputable industry news sources and publications.
Methodology
Step 1 - Identification of Relevant Samples Size from Population Database


Step 2 - Approaches for Defining Global Market Size (Value, Volume* & Price*)

Note*: In applicable scenarios
Step 3 - Data Sources
Primary Research
- Web Analytics
- Survey Reports
- Research Institute
- Latest Research Reports
- Opinion Leaders
Secondary Research
- Annual Reports
- White Paper
- Latest Press Release
- Industry Association
- Paid Database
- Investor Presentations

Step 4 - Data Triangulation
Involves using different sources of information in order to increase the validity of a study
These sources are likely to be stakeholders in a program - participants, other researchers, program staff, other community members, and so on.
Then we put all data in single framework & apply various statistical tools to find out the dynamic on the market.
During the analysis stage, feedback from the stakeholder groups would be compared to determine areas of agreement as well as areas of divergence


