
Key Insights
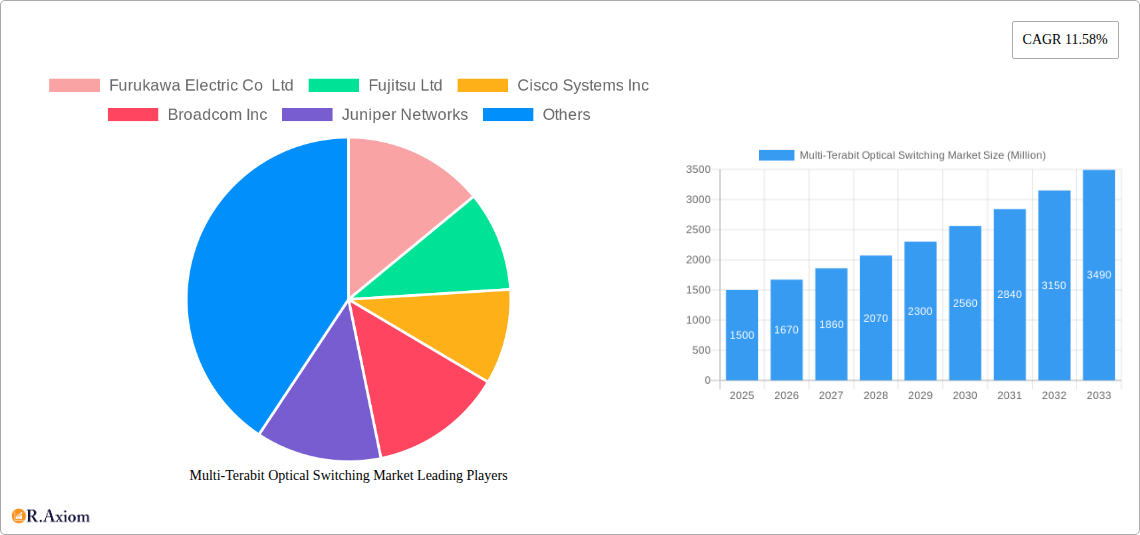
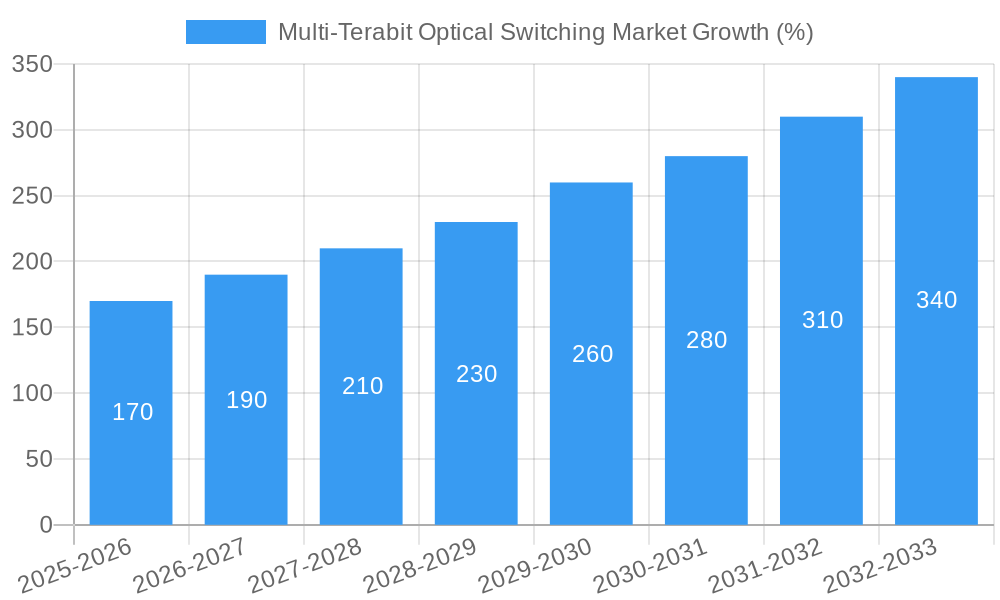
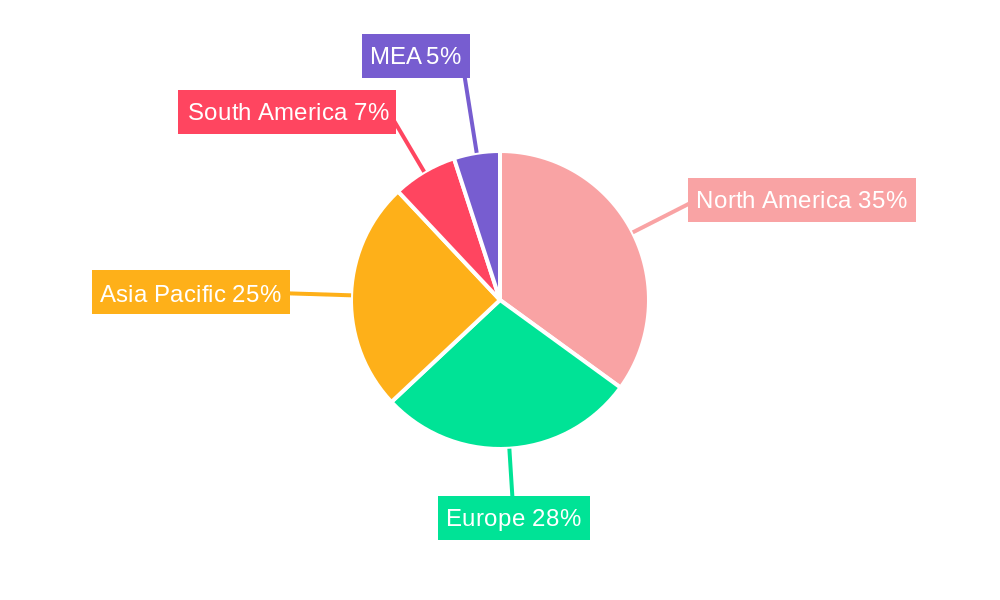
The multi-terabit optical switching market is experiencing robust growth, driven by the escalating demand for higher bandwidth and faster data transmission speeds across various sectors. The market's Compound Annual Growth Rate (CAGR) of 11.58% from 2019 to 2024 indicates significant expansion, projected to continue into the forecast period (2025-2033). Key drivers include the proliferation of 5G networks, the increasing adoption of cloud computing and data centers, and the growing need for high-speed connectivity in sectors like government and defense, IT and telecom, and BFSI. Technological advancements in electro-optic, acoustic-optic, MEMS-based, and magneto-optic switching technologies are further fueling market expansion. While the market faces some restraints, such as high initial investment costs for infrastructure upgrades and the complexity of integrating these advanced switching systems, these are largely outweighed by the compelling benefits of enhanced network capacity and performance. The market segmentation reveals a strong demand across all end-user industries, with government and defense, and IT and telecom leading the way. Geographical distribution shows North America and Asia Pacific as prominent regions, exhibiting substantial growth potential due to the presence of major technology hubs and significant investments in network infrastructure. The competitive landscape is populated by established players like Furukawa Electric, Fujitsu, Cisco, and Broadcom, along with emerging players vying for market share through innovation and strategic partnerships.
The market's future trajectory is anticipated to remain positive, driven by continued technological innovation and expanding applications. The increasing adoption of software-defined networking (SDN) and network function virtualization (NFV) is likely to further boost market growth by offering improved network flexibility and scalability. Expansion into new geographical markets, particularly in developing economies with burgeoning digital infrastructure needs, presents significant growth opportunities. However, sustained growth will depend on effective addressing of challenges related to standardization, interoperability, and cost-effectiveness of multi-terabit optical switching solutions. Market players will need to focus on developing cost-effective solutions and exploring new applications in emerging areas like the Internet of Things (IoT) and artificial intelligence (AI) to maintain their competitive edge.
Multi-Terabit Optical Switching Market: A Comprehensive Market Report (2019-2033)
This in-depth report provides a comprehensive analysis of the Multi-Terabit Optical Switching market, offering invaluable insights for industry stakeholders, investors, and strategic decision-makers. The report covers the period from 2019 to 2033, with 2025 as the base year and a forecast period extending to 2033. It meticulously examines market dynamics, technological advancements, competitive landscapes, and future growth prospects. Detailed segmentation by type and end-user industry allows for a granular understanding of market trends and opportunities.
Multi-Terabit Optical Switching Market Market Concentration & Innovation
The Multi-Terabit Optical Switching market exhibits a moderately concentrated landscape, with a few major players holding significant market share. However, the market is also witnessing considerable innovation, driven by the need for higher bandwidth and improved network efficiency. Market concentration is influenced by factors such as technological advancements, economies of scale, and mergers and acquisitions (M&A) activity. The estimated market share of the top five players in 2025 is approximately xx%, indicating a consolidated yet dynamic market structure. M&A activities, while not frequent, have played a role in shaping market dynamics, with deals valued at an estimated xx Million in the last five years. Regulatory frameworks, particularly those concerning data privacy and network security, influence the market's growth trajectory. Product substitutes, such as alternative transmission technologies, present ongoing competitive pressures. End-user trends, notably the increasing demand for high-bandwidth applications in sectors like IT and Telecom, are key drivers of market growth.
- Market Share (2025 Estimate): Top 5 players – xx%
- M&A Deal Value (2019-2024): Approximately xx Million
- Key Innovation Drivers: Increased bandwidth demand, need for improved network efficiency, advancements in optical technologies.
- Regulatory Impact: Data privacy regulations, network security standards.
Multi-Terabit Optical Switching Market Industry Trends & Insights
The Multi-Terabit Optical Switching market is characterized by robust growth, driven by the exponential increase in data traffic and the proliferation of bandwidth-intensive applications. The market is projected to register a Compound Annual Growth Rate (CAGR) of xx% during the forecast period (2025-2033). Technological disruptions, particularly in areas like space division multiplexing (SDM) and coherent optical transmission, are reshaping the market landscape. Consumer preferences are increasingly leaning towards higher bandwidth capabilities and improved network reliability. Competitive dynamics are intense, with companies vying for market share through technological innovation, strategic partnerships, and product differentiation. Market penetration is expected to increase steadily, reaching xx% by 2033. This growth is propelled by the continuous need for enhanced network infrastructure to support the growing demand for data in diverse sectors.
Dominant Markets & Segments in Multi-Terabit Optical Switching Market
The IT and Telecom sector currently dominates the Multi-Terabit Optical Switching market, followed by the Government and Defense sector. Within the "By Type" segmentation, Electro-optic switching holds the largest market share, driven by its mature technology and widespread adoption.
- Leading Region/Country: North America (xx Million in 2025)
- Dominant Segment (By Type): Electro-optic Switching
- Dominant Segment (End-User): IT and Telecom
Key Drivers for Dominant Segments:
- IT and Telecom: High demand for high-bandwidth networks, cloud computing expansion, 5G deployment.
- Government and Defense: Need for secure and reliable communication infrastructure, national security applications.
- Electro-optic Switching: Mature technology, cost-effectiveness, compatibility with existing infrastructure.
Multi-Terabit Optical Switching Market Product Developments
Recent product innovations focus on increasing switching capacity, improving energy efficiency, and enhancing network flexibility. New products feature advanced features like improved error correction, higher spectral efficiency, and better integration with existing network infrastructure. These advancements address the growing demand for higher bandwidth and more efficient network solutions, providing significant competitive advantages in a rapidly evolving market.
Report Scope & Segmentation Analysis
This report segments the Multi-Terabit Optical Switching market by type (Electro-optic Switching, Acoustic-Optic switching, Mems-based Switching, Magneto-Optic Switching, Others) and end-user industry (Government and Defense, IT and Telecom, BFSI, Manufacturing, Others). Each segment's growth projections, market size estimations, and competitive dynamics are analyzed in detail. The Electro-optic Switching segment is projected to experience the highest CAGR, driven by its wide applications and maturity. Similarly, the IT and Telecom segment is expected to hold the largest market share due to its high bandwidth requirements and rapid technological advancements.
Key Drivers of Multi-Terabit Optical Switching Market Growth
The growth of the Multi-Terabit Optical Switching market is propelled by several key factors: the exponential growth of data traffic driven by cloud computing, the increasing adoption of high-bandwidth applications (e.g., 5G, 4K/8K video streaming), and governmental investments in infrastructure modernization. Technological advancements such as space division multiplexing (SDM) and coherent optical transmission enable greater capacity and efficiency. Furthermore, favorable regulatory policies promoting digital infrastructure development contribute to market expansion.
Challenges in the Multi-Terabit Optical Switching Market Sector
Challenges facing the market include the high cost of deploying and maintaining Multi-Terabit Optical Switching systems, the complexity of integrating these systems into existing network infrastructures, and the potential for supply chain disruptions. The need for skilled workforce for implementation and maintenance also poses a constraint. These factors can hinder market growth and increase the overall cost of network deployment.
Emerging Opportunities in Multi-Terabit Optical Switching Market
Emerging opportunities lie in the development of next-generation optical switching technologies, particularly those focused on enhancing scalability, efficiency, and energy consumption. The growing demand for higher bandwidth in emerging economies presents a significant opportunity for market expansion. The integration of artificial intelligence (AI) and machine learning (ML) for network optimization and management also creates promising avenues for innovation and growth.
Leading Players in the Multi-Terabit Optical Switching Market Market
- Furukawa Electric Co Ltd
- Fujitsu Ltd
- Cisco Systems Inc
- Broadcom Inc
- Juniper Networks
- Keysight Technologies Inc
- Huawei Technologies Co Ltd
- Nokia Corporation
- NTT Advanced Technology Corporation
- Agiltron Inc
Key Developments in Multi-Terabit Optical Switching Market Industry
- November 2021: ADVA's involvement in three BMBF-funded research projects utilizing SDM technology to enhance optical network capacity. This signifies a significant push towards higher bandwidth capabilities.
- July 2021: OT Systems Ltd launched new Ethernet media converters and optical Ethernet switches, expanding product offerings in the market. This reflects the ongoing development of essential network infrastructure components.
Strategic Outlook for Multi-Terabit Optical Switching Market Market
The Multi-Terabit Optical Switching market is poised for continued robust growth, driven by the unrelenting increase in data consumption and the need for faster, more efficient network infrastructure. Strategic investments in research and development, coupled with strategic partnerships and acquisitions, will be crucial for companies to maintain a competitive edge. The focus on energy-efficient solutions and advanced technologies like SDM will shape the future trajectory of the market.
Multi-Terabit Optical Switching Market Segmentation
-
1. Type
- 1.1. Electro-optic Switching
- 1.2. Acoustic-Optic switching
- 1.3. Mems-based Switching
- 1.4. Magneto-Optic Switching
- 1.5. Others
-
2. End-User Industry
- 2.1. Government and Defense
- 2.2. IT and Telecom
- 2.3. BFSI
- 2.4. Manufacturing
- 2.5. Others
Multi-Terabit Optical Switching Market Segmentation By Geography
- 1. North America
- 2. Europe
- 3. Asia Pacific
- 4. Latin America
- 5. Middle East and Africa
Multi-Terabit Optical Switching Market REPORT HIGHLIGHTS
| Aspects | Details |
|---|---|
| Study Period | 2019-2033 |
| Base Year | 2024 |
| Estimated Year | 2025 |
| Forecast Period | 2025-2033 |
| Historical Period | 2019-2024 |
| Growth Rate | CAGR of 11.58% from 2019-2033 |
| Segmentation |
|
Table of Contents
- 1. Introduction
- 1.1. Research Scope
- 1.2. Market Segmentation
- 1.3. Research Methodology
- 1.4. Definitions and Assumptions
- 2. Executive Summary
- 2.1. Introduction
- 3. Market Dynamics
- 3.1. Introduction
- 3.2. Market Drivers
- 3.2.1. Growing Adoption of Digitalization; Widespread Implementation of 5G and Increase in Demand for Data Centers
- 3.3. Market Restrains
- 3.3.1. High Costs of Optical Switches
- 3.4. Market Trends
- 3.4.1. IT and Telecom is Analyzed to Grow at Highest Rate During the Forecast Period
- 4. Market Factor Analysis
- 4.1. Porters Five Forces
- 4.2. Supply/Value Chain
- 4.3. PESTEL analysis
- 4.4. Market Entropy
- 4.5. Patent/Trademark Analysis
- 5. Global Multi-Terabit Optical Switching Market Analysis, Insights and Forecast, 2019-2031
- 5.1. Market Analysis, Insights and Forecast - by Type
- 5.1.1. Electro-optic Switching
- 5.1.2. Acoustic-Optic switching
- 5.1.3. Mems-based Switching
- 5.1.4. Magneto-Optic Switching
- 5.1.5. Others
- 5.2. Market Analysis, Insights and Forecast - by End-User Industry
- 5.2.1. Government and Defense
- 5.2.2. IT and Telecom
- 5.2.3. BFSI
- 5.2.4. Manufacturing
- 5.2.5. Others
- 5.3. Market Analysis, Insights and Forecast - by Region
- 5.3.1. North America
- 5.3.2. Europe
- 5.3.3. Asia Pacific
- 5.3.4. Latin America
- 5.3.5. Middle East and Africa
- 5.1. Market Analysis, Insights and Forecast - by Type
- 6. North America Multi-Terabit Optical Switching Market Analysis, Insights and Forecast, 2019-2031
- 6.1. Market Analysis, Insights and Forecast - by Type
- 6.1.1. Electro-optic Switching
- 6.1.2. Acoustic-Optic switching
- 6.1.3. Mems-based Switching
- 6.1.4. Magneto-Optic Switching
- 6.1.5. Others
- 6.2. Market Analysis, Insights and Forecast - by End-User Industry
- 6.2.1. Government and Defense
- 6.2.2. IT and Telecom
- 6.2.3. BFSI
- 6.2.4. Manufacturing
- 6.2.5. Others
- 6.1. Market Analysis, Insights and Forecast - by Type
- 7. Europe Multi-Terabit Optical Switching Market Analysis, Insights and Forecast, 2019-2031
- 7.1. Market Analysis, Insights and Forecast - by Type
- 7.1.1. Electro-optic Switching
- 7.1.2. Acoustic-Optic switching
- 7.1.3. Mems-based Switching
- 7.1.4. Magneto-Optic Switching
- 7.1.5. Others
- 7.2. Market Analysis, Insights and Forecast - by End-User Industry
- 7.2.1. Government and Defense
- 7.2.2. IT and Telecom
- 7.2.3. BFSI
- 7.2.4. Manufacturing
- 7.2.5. Others
- 7.1. Market Analysis, Insights and Forecast - by Type
- 8. Asia Pacific Multi-Terabit Optical Switching Market Analysis, Insights and Forecast, 2019-2031
- 8.1. Market Analysis, Insights and Forecast - by Type
- 8.1.1. Electro-optic Switching
- 8.1.2. Acoustic-Optic switching
- 8.1.3. Mems-based Switching
- 8.1.4. Magneto-Optic Switching
- 8.1.5. Others
- 8.2. Market Analysis, Insights and Forecast - by End-User Industry
- 8.2.1. Government and Defense
- 8.2.2. IT and Telecom
- 8.2.3. BFSI
- 8.2.4. Manufacturing
- 8.2.5. Others
- 8.1. Market Analysis, Insights and Forecast - by Type
- 9. Latin America Multi-Terabit Optical Switching Market Analysis, Insights and Forecast, 2019-2031
- 9.1. Market Analysis, Insights and Forecast - by Type
- 9.1.1. Electro-optic Switching
- 9.1.2. Acoustic-Optic switching
- 9.1.3. Mems-based Switching
- 9.1.4. Magneto-Optic Switching
- 9.1.5. Others
- 9.2. Market Analysis, Insights and Forecast - by End-User Industry
- 9.2.1. Government and Defense
- 9.2.2. IT and Telecom
- 9.2.3. BFSI
- 9.2.4. Manufacturing
- 9.2.5. Others
- 9.1. Market Analysis, Insights and Forecast - by Type
- 10. Middle East and Africa Multi-Terabit Optical Switching Market Analysis, Insights and Forecast, 2019-2031
- 10.1. Market Analysis, Insights and Forecast - by Type
- 10.1.1. Electro-optic Switching
- 10.1.2. Acoustic-Optic switching
- 10.1.3. Mems-based Switching
- 10.1.4. Magneto-Optic Switching
- 10.1.5. Others
- 10.2. Market Analysis, Insights and Forecast - by End-User Industry
- 10.2.1. Government and Defense
- 10.2.2. IT and Telecom
- 10.2.3. BFSI
- 10.2.4. Manufacturing
- 10.2.5. Others
- 10.1. Market Analysis, Insights and Forecast - by Type
- 11. North America Multi-Terabit Optical Switching Market Analysis, Insights and Forecast, 2019-2031
- 11.1. Market Analysis, Insights and Forecast - By Country/Sub-region
- 11.1.1 United States
- 11.1.2 Canada
- 11.1.3 Mexico
- 12. Europe Multi-Terabit Optical Switching Market Analysis, Insights and Forecast, 2019-2031
- 12.1. Market Analysis, Insights and Forecast - By Country/Sub-region
- 12.1.1 Germany
- 12.1.2 United Kingdom
- 12.1.3 France
- 12.1.4 Spain
- 12.1.5 Italy
- 12.1.6 Spain
- 12.1.7 Belgium
- 12.1.8 Netherland
- 12.1.9 Nordics
- 12.1.10 Rest of Europe
- 13. Asia Pacific Multi-Terabit Optical Switching Market Analysis, Insights and Forecast, 2019-2031
- 13.1. Market Analysis, Insights and Forecast - By Country/Sub-region
- 13.1.1 China
- 13.1.2 Japan
- 13.1.3 India
- 13.1.4 South Korea
- 13.1.5 Southeast Asia
- 13.1.6 Australia
- 13.1.7 Indonesia
- 13.1.8 Phillipes
- 13.1.9 Singapore
- 13.1.10 Thailandc
- 13.1.11 Rest of Asia Pacific
- 14. South America Multi-Terabit Optical Switching Market Analysis, Insights and Forecast, 2019-2031
- 14.1. Market Analysis, Insights and Forecast - By Country/Sub-region
- 14.1.1 Brazil
- 14.1.2 Argentina
- 14.1.3 Peru
- 14.1.4 Chile
- 14.1.5 Colombia
- 14.1.6 Ecuador
- 14.1.7 Venezuela
- 14.1.8 Rest of South America
- 15. North America Multi-Terabit Optical Switching Market Analysis, Insights and Forecast, 2019-2031
- 15.1. Market Analysis, Insights and Forecast - By Country/Sub-region
- 15.1.1 United States
- 15.1.2 Canada
- 15.1.3 Mexico
- 16. MEA Multi-Terabit Optical Switching Market Analysis, Insights and Forecast, 2019-2031
- 16.1. Market Analysis, Insights and Forecast - By Country/Sub-region
- 16.1.1 United Arab Emirates
- 16.1.2 Saudi Arabia
- 16.1.3 South Africa
- 16.1.4 Rest of Middle East and Africa
- 17. Competitive Analysis
- 17.1. Global Market Share Analysis 2024
- 17.2. Company Profiles
- 17.2.1 Furukawa Electric Co Ltd
- 17.2.1.1. Overview
- 17.2.1.2. Products
- 17.2.1.3. SWOT Analysis
- 17.2.1.4. Recent Developments
- 17.2.1.5. Financials (Based on Availability)
- 17.2.2 Fujitsu Ltd
- 17.2.2.1. Overview
- 17.2.2.2. Products
- 17.2.2.3. SWOT Analysis
- 17.2.2.4. Recent Developments
- 17.2.2.5. Financials (Based on Availability)
- 17.2.3 Cisco Systems Inc
- 17.2.3.1. Overview
- 17.2.3.2. Products
- 17.2.3.3. SWOT Analysis
- 17.2.3.4. Recent Developments
- 17.2.3.5. Financials (Based on Availability)
- 17.2.4 Broadcom Inc
- 17.2.4.1. Overview
- 17.2.4.2. Products
- 17.2.4.3. SWOT Analysis
- 17.2.4.4. Recent Developments
- 17.2.4.5. Financials (Based on Availability)
- 17.2.5 Juniper Networks
- 17.2.5.1. Overview
- 17.2.5.2. Products
- 17.2.5.3. SWOT Analysis
- 17.2.5.4. Recent Developments
- 17.2.5.5. Financials (Based on Availability)
- 17.2.6 Keysight Technologies Inc
- 17.2.6.1. Overview
- 17.2.6.2. Products
- 17.2.6.3. SWOT Analysis
- 17.2.6.4. Recent Developments
- 17.2.6.5. Financials (Based on Availability)
- 17.2.7 Huawei Technologies Co Ltd
- 17.2.7.1. Overview
- 17.2.7.2. Products
- 17.2.7.3. SWOT Analysis
- 17.2.7.4. Recent Developments
- 17.2.7.5. Financials (Based on Availability)
- 17.2.8 Nokia Corporation
- 17.2.8.1. Overview
- 17.2.8.2. Products
- 17.2.8.3. SWOT Analysis
- 17.2.8.4. Recent Developments
- 17.2.8.5. Financials (Based on Availability)
- 17.2.9 NTT Advanced Technology Corporation
- 17.2.9.1. Overview
- 17.2.9.2. Products
- 17.2.9.3. SWOT Analysis
- 17.2.9.4. Recent Developments
- 17.2.9.5. Financials (Based on Availability)
- 17.2.10 Agiltron Inc
- 17.2.10.1. Overview
- 17.2.10.2. Products
- 17.2.10.3. SWOT Analysis
- 17.2.10.4. Recent Developments
- 17.2.10.5. Financials (Based on Availability)
- 17.2.1 Furukawa Electric Co Ltd
List of Figures
- Figure 1: Global Multi-Terabit Optical Switching Market Revenue Breakdown (Million, %) by Region 2024 & 2032
- Figure 2: Global Multi-Terabit Optical Switching Market Volume Breakdown (K Unit, %) by Region 2024 & 2032
- Figure 3: North America Multi-Terabit Optical Switching Market Revenue (Million), by Country 2024 & 2032
- Figure 4: North America Multi-Terabit Optical Switching Market Volume (K Unit), by Country 2024 & 2032
- Figure 5: North America Multi-Terabit Optical Switching Market Revenue Share (%), by Country 2024 & 2032
- Figure 6: North America Multi-Terabit Optical Switching Market Volume Share (%), by Country 2024 & 2032
- Figure 7: Europe Multi-Terabit Optical Switching Market Revenue (Million), by Country 2024 & 2032
- Figure 8: Europe Multi-Terabit Optical Switching Market Volume (K Unit), by Country 2024 & 2032
- Figure 9: Europe Multi-Terabit Optical Switching Market Revenue Share (%), by Country 2024 & 2032
- Figure 10: Europe Multi-Terabit Optical Switching Market Volume Share (%), by Country 2024 & 2032
- Figure 11: Asia Pacific Multi-Terabit Optical Switching Market Revenue (Million), by Country 2024 & 2032
- Figure 12: Asia Pacific Multi-Terabit Optical Switching Market Volume (K Unit), by Country 2024 & 2032
- Figure 13: Asia Pacific Multi-Terabit Optical Switching Market Revenue Share (%), by Country 2024 & 2032
- Figure 14: Asia Pacific Multi-Terabit Optical Switching Market Volume Share (%), by Country 2024 & 2032
- Figure 15: South America Multi-Terabit Optical Switching Market Revenue (Million), by Country 2024 & 2032
- Figure 16: South America Multi-Terabit Optical Switching Market Volume (K Unit), by Country 2024 & 2032
- Figure 17: South America Multi-Terabit Optical Switching Market Revenue Share (%), by Country 2024 & 2032
- Figure 18: South America Multi-Terabit Optical Switching Market Volume Share (%), by Country 2024 & 2032
- Figure 19: North America Multi-Terabit Optical Switching Market Revenue (Million), by Country 2024 & 2032
- Figure 20: North America Multi-Terabit Optical Switching Market Volume (K Unit), by Country 2024 & 2032
- Figure 21: North America Multi-Terabit Optical Switching Market Revenue Share (%), by Country 2024 & 2032
- Figure 22: North America Multi-Terabit Optical Switching Market Volume Share (%), by Country 2024 & 2032
- Figure 23: MEA Multi-Terabit Optical Switching Market Revenue (Million), by Country 2024 & 2032
- Figure 24: MEA Multi-Terabit Optical Switching Market Volume (K Unit), by Country 2024 & 2032
- Figure 25: MEA Multi-Terabit Optical Switching Market Revenue Share (%), by Country 2024 & 2032
- Figure 26: MEA Multi-Terabit Optical Switching Market Volume Share (%), by Country 2024 & 2032
- Figure 27: North America Multi-Terabit Optical Switching Market Revenue (Million), by Type 2024 & 2032
- Figure 28: North America Multi-Terabit Optical Switching Market Volume (K Unit), by Type 2024 & 2032
- Figure 29: North America Multi-Terabit Optical Switching Market Revenue Share (%), by Type 2024 & 2032
- Figure 30: North America Multi-Terabit Optical Switching Market Volume Share (%), by Type 2024 & 2032
- Figure 31: North America Multi-Terabit Optical Switching Market Revenue (Million), by End-User Industry 2024 & 2032
- Figure 32: North America Multi-Terabit Optical Switching Market Volume (K Unit), by End-User Industry 2024 & 2032
- Figure 33: North America Multi-Terabit Optical Switching Market Revenue Share (%), by End-User Industry 2024 & 2032
- Figure 34: North America Multi-Terabit Optical Switching Market Volume Share (%), by End-User Industry 2024 & 2032
- Figure 35: North America Multi-Terabit Optical Switching Market Revenue (Million), by Country 2024 & 2032
- Figure 36: North America Multi-Terabit Optical Switching Market Volume (K Unit), by Country 2024 & 2032
- Figure 37: North America Multi-Terabit Optical Switching Market Revenue Share (%), by Country 2024 & 2032
- Figure 38: North America Multi-Terabit Optical Switching Market Volume Share (%), by Country 2024 & 2032
- Figure 39: Europe Multi-Terabit Optical Switching Market Revenue (Million), by Type 2024 & 2032
- Figure 40: Europe Multi-Terabit Optical Switching Market Volume (K Unit), by Type 2024 & 2032
- Figure 41: Europe Multi-Terabit Optical Switching Market Revenue Share (%), by Type 2024 & 2032
- Figure 42: Europe Multi-Terabit Optical Switching Market Volume Share (%), by Type 2024 & 2032
- Figure 43: Europe Multi-Terabit Optical Switching Market Revenue (Million), by End-User Industry 2024 & 2032
- Figure 44: Europe Multi-Terabit Optical Switching Market Volume (K Unit), by End-User Industry 2024 & 2032
- Figure 45: Europe Multi-Terabit Optical Switching Market Revenue Share (%), by End-User Industry 2024 & 2032
- Figure 46: Europe Multi-Terabit Optical Switching Market Volume Share (%), by End-User Industry 2024 & 2032
- Figure 47: Europe Multi-Terabit Optical Switching Market Revenue (Million), by Country 2024 & 2032
- Figure 48: Europe Multi-Terabit Optical Switching Market Volume (K Unit), by Country 2024 & 2032
- Figure 49: Europe Multi-Terabit Optical Switching Market Revenue Share (%), by Country 2024 & 2032
- Figure 50: Europe Multi-Terabit Optical Switching Market Volume Share (%), by Country 2024 & 2032
- Figure 51: Asia Pacific Multi-Terabit Optical Switching Market Revenue (Million), by Type 2024 & 2032
- Figure 52: Asia Pacific Multi-Terabit Optical Switching Market Volume (K Unit), by Type 2024 & 2032
- Figure 53: Asia Pacific Multi-Terabit Optical Switching Market Revenue Share (%), by Type 2024 & 2032
- Figure 54: Asia Pacific Multi-Terabit Optical Switching Market Volume Share (%), by Type 2024 & 2032
- Figure 55: Asia Pacific Multi-Terabit Optical Switching Market Revenue (Million), by End-User Industry 2024 & 2032
- Figure 56: Asia Pacific Multi-Terabit Optical Switching Market Volume (K Unit), by End-User Industry 2024 & 2032
- Figure 57: Asia Pacific Multi-Terabit Optical Switching Market Revenue Share (%), by End-User Industry 2024 & 2032
- Figure 58: Asia Pacific Multi-Terabit Optical Switching Market Volume Share (%), by End-User Industry 2024 & 2032
- Figure 59: Asia Pacific Multi-Terabit Optical Switching Market Revenue (Million), by Country 2024 & 2032
- Figure 60: Asia Pacific Multi-Terabit Optical Switching Market Volume (K Unit), by Country 2024 & 2032
- Figure 61: Asia Pacific Multi-Terabit Optical Switching Market Revenue Share (%), by Country 2024 & 2032
- Figure 62: Asia Pacific Multi-Terabit Optical Switching Market Volume Share (%), by Country 2024 & 2032
- Figure 63: Latin America Multi-Terabit Optical Switching Market Revenue (Million), by Type 2024 & 2032
- Figure 64: Latin America Multi-Terabit Optical Switching Market Volume (K Unit), by Type 2024 & 2032
- Figure 65: Latin America Multi-Terabit Optical Switching Market Revenue Share (%), by Type 2024 & 2032
- Figure 66: Latin America Multi-Terabit Optical Switching Market Volume Share (%), by Type 2024 & 2032
- Figure 67: Latin America Multi-Terabit Optical Switching Market Revenue (Million), by End-User Industry 2024 & 2032
- Figure 68: Latin America Multi-Terabit Optical Switching Market Volume (K Unit), by End-User Industry 2024 & 2032
- Figure 69: Latin America Multi-Terabit Optical Switching Market Revenue Share (%), by End-User Industry 2024 & 2032
- Figure 70: Latin America Multi-Terabit Optical Switching Market Volume Share (%), by End-User Industry 2024 & 2032
- Figure 71: Latin America Multi-Terabit Optical Switching Market Revenue (Million), by Country 2024 & 2032
- Figure 72: Latin America Multi-Terabit Optical Switching Market Volume (K Unit), by Country 2024 & 2032
- Figure 73: Latin America Multi-Terabit Optical Switching Market Revenue Share (%), by Country 2024 & 2032
- Figure 74: Latin America Multi-Terabit Optical Switching Market Volume Share (%), by Country 2024 & 2032
- Figure 75: Middle East and Africa Multi-Terabit Optical Switching Market Revenue (Million), by Type 2024 & 2032
- Figure 76: Middle East and Africa Multi-Terabit Optical Switching Market Volume (K Unit), by Type 2024 & 2032
- Figure 77: Middle East and Africa Multi-Terabit Optical Switching Market Revenue Share (%), by Type 2024 & 2032
- Figure 78: Middle East and Africa Multi-Terabit Optical Switching Market Volume Share (%), by Type 2024 & 2032
- Figure 79: Middle East and Africa Multi-Terabit Optical Switching Market Revenue (Million), by End-User Industry 2024 & 2032
- Figure 80: Middle East and Africa Multi-Terabit Optical Switching Market Volume (K Unit), by End-User Industry 2024 & 2032
- Figure 81: Middle East and Africa Multi-Terabit Optical Switching Market Revenue Share (%), by End-User Industry 2024 & 2032
- Figure 82: Middle East and Africa Multi-Terabit Optical Switching Market Volume Share (%), by End-User Industry 2024 & 2032
- Figure 83: Middle East and Africa Multi-Terabit Optical Switching Market Revenue (Million), by Country 2024 & 2032
- Figure 84: Middle East and Africa Multi-Terabit Optical Switching Market Volume (K Unit), by Country 2024 & 2032
- Figure 85: Middle East and Africa Multi-Terabit Optical Switching Market Revenue Share (%), by Country 2024 & 2032
- Figure 86: Middle East and Africa Multi-Terabit Optical Switching Market Volume Share (%), by Country 2024 & 2032
List of Tables
- Table 1: Global Multi-Terabit Optical Switching Market Revenue Million Forecast, by Region 2019 & 2032
- Table 2: Global Multi-Terabit Optical Switching Market Volume K Unit Forecast, by Region 2019 & 2032
- Table 3: Global Multi-Terabit Optical Switching Market Revenue Million Forecast, by Type 2019 & 2032
- Table 4: Global Multi-Terabit Optical Switching Market Volume K Unit Forecast, by Type 2019 & 2032
- Table 5: Global Multi-Terabit Optical Switching Market Revenue Million Forecast, by End-User Industry 2019 & 2032
- Table 6: Global Multi-Terabit Optical Switching Market Volume K Unit Forecast, by End-User Industry 2019 & 2032
- Table 7: Global Multi-Terabit Optical Switching Market Revenue Million Forecast, by Region 2019 & 2032
- Table 8: Global Multi-Terabit Optical Switching Market Volume K Unit Forecast, by Region 2019 & 2032
- Table 9: Global Multi-Terabit Optical Switching Market Revenue Million Forecast, by Country 2019 & 2032
- Table 10: Global Multi-Terabit Optical Switching Market Volume K Unit Forecast, by Country 2019 & 2032
- Table 11: United States Multi-Terabit Optical Switching Market Revenue (Million) Forecast, by Application 2019 & 2032
- Table 12: United States Multi-Terabit Optical Switching Market Volume (K Unit) Forecast, by Application 2019 & 2032
- Table 13: Canada Multi-Terabit Optical Switching Market Revenue (Million) Forecast, by Application 2019 & 2032
- Table 14: Canada Multi-Terabit Optical Switching Market Volume (K Unit) Forecast, by Application 2019 & 2032
- Table 15: Mexico Multi-Terabit Optical Switching Market Revenue (Million) Forecast, by Application 2019 & 2032
- Table 16: Mexico Multi-Terabit Optical Switching Market Volume (K Unit) Forecast, by Application 2019 & 2032
- Table 17: Global Multi-Terabit Optical Switching Market Revenue Million Forecast, by Country 2019 & 2032
- Table 18: Global Multi-Terabit Optical Switching Market Volume K Unit Forecast, by Country 2019 & 2032
- Table 19: Germany Multi-Terabit Optical Switching Market Revenue (Million) Forecast, by Application 2019 & 2032
- Table 20: Germany Multi-Terabit Optical Switching Market Volume (K Unit) Forecast, by Application 2019 & 2032
- Table 21: United Kingdom Multi-Terabit Optical Switching Market Revenue (Million) Forecast, by Application 2019 & 2032
- Table 22: United Kingdom Multi-Terabit Optical Switching Market Volume (K Unit) Forecast, by Application 2019 & 2032
- Table 23: France Multi-Terabit Optical Switching Market Revenue (Million) Forecast, by Application 2019 & 2032
- Table 24: France Multi-Terabit Optical Switching Market Volume (K Unit) Forecast, by Application 2019 & 2032
- Table 25: Spain Multi-Terabit Optical Switching Market Revenue (Million) Forecast, by Application 2019 & 2032
- Table 26: Spain Multi-Terabit Optical Switching Market Volume (K Unit) Forecast, by Application 2019 & 2032
- Table 27: Italy Multi-Terabit Optical Switching Market Revenue (Million) Forecast, by Application 2019 & 2032
- Table 28: Italy Multi-Terabit Optical Switching Market Volume (K Unit) Forecast, by Application 2019 & 2032
- Table 29: Spain Multi-Terabit Optical Switching Market Revenue (Million) Forecast, by Application 2019 & 2032
- Table 30: Spain Multi-Terabit Optical Switching Market Volume (K Unit) Forecast, by Application 2019 & 2032
- Table 31: Belgium Multi-Terabit Optical Switching Market Revenue (Million) Forecast, by Application 2019 & 2032
- Table 32: Belgium Multi-Terabit Optical Switching Market Volume (K Unit) Forecast, by Application 2019 & 2032
- Table 33: Netherland Multi-Terabit Optical Switching Market Revenue (Million) Forecast, by Application 2019 & 2032
- Table 34: Netherland Multi-Terabit Optical Switching Market Volume (K Unit) Forecast, by Application 2019 & 2032
- Table 35: Nordics Multi-Terabit Optical Switching Market Revenue (Million) Forecast, by Application 2019 & 2032
- Table 36: Nordics Multi-Terabit Optical Switching Market Volume (K Unit) Forecast, by Application 2019 & 2032
- Table 37: Rest of Europe Multi-Terabit Optical Switching Market Revenue (Million) Forecast, by Application 2019 & 2032
- Table 38: Rest of Europe Multi-Terabit Optical Switching Market Volume (K Unit) Forecast, by Application 2019 & 2032
- Table 39: Global Multi-Terabit Optical Switching Market Revenue Million Forecast, by Country 2019 & 2032
- Table 40: Global Multi-Terabit Optical Switching Market Volume K Unit Forecast, by Country 2019 & 2032
- Table 41: China Multi-Terabit Optical Switching Market Revenue (Million) Forecast, by Application 2019 & 2032
- Table 42: China Multi-Terabit Optical Switching Market Volume (K Unit) Forecast, by Application 2019 & 2032
- Table 43: Japan Multi-Terabit Optical Switching Market Revenue (Million) Forecast, by Application 2019 & 2032
- Table 44: Japan Multi-Terabit Optical Switching Market Volume (K Unit) Forecast, by Application 2019 & 2032
- Table 45: India Multi-Terabit Optical Switching Market Revenue (Million) Forecast, by Application 2019 & 2032
- Table 46: India Multi-Terabit Optical Switching Market Volume (K Unit) Forecast, by Application 2019 & 2032
- Table 47: South Korea Multi-Terabit Optical Switching Market Revenue (Million) Forecast, by Application 2019 & 2032
- Table 48: South Korea Multi-Terabit Optical Switching Market Volume (K Unit) Forecast, by Application 2019 & 2032
- Table 49: Southeast Asia Multi-Terabit Optical Switching Market Revenue (Million) Forecast, by Application 2019 & 2032
- Table 50: Southeast Asia Multi-Terabit Optical Switching Market Volume (K Unit) Forecast, by Application 2019 & 2032
- Table 51: Australia Multi-Terabit Optical Switching Market Revenue (Million) Forecast, by Application 2019 & 2032
- Table 52: Australia Multi-Terabit Optical Switching Market Volume (K Unit) Forecast, by Application 2019 & 2032
- Table 53: Indonesia Multi-Terabit Optical Switching Market Revenue (Million) Forecast, by Application 2019 & 2032
- Table 54: Indonesia Multi-Terabit Optical Switching Market Volume (K Unit) Forecast, by Application 2019 & 2032
- Table 55: Phillipes Multi-Terabit Optical Switching Market Revenue (Million) Forecast, by Application 2019 & 2032
- Table 56: Phillipes Multi-Terabit Optical Switching Market Volume (K Unit) Forecast, by Application 2019 & 2032
- Table 57: Singapore Multi-Terabit Optical Switching Market Revenue (Million) Forecast, by Application 2019 & 2032
- Table 58: Singapore Multi-Terabit Optical Switching Market Volume (K Unit) Forecast, by Application 2019 & 2032
- Table 59: Thailandc Multi-Terabit Optical Switching Market Revenue (Million) Forecast, by Application 2019 & 2032
- Table 60: Thailandc Multi-Terabit Optical Switching Market Volume (K Unit) Forecast, by Application 2019 & 2032
- Table 61: Rest of Asia Pacific Multi-Terabit Optical Switching Market Revenue (Million) Forecast, by Application 2019 & 2032
- Table 62: Rest of Asia Pacific Multi-Terabit Optical Switching Market Volume (K Unit) Forecast, by Application 2019 & 2032
- Table 63: Global Multi-Terabit Optical Switching Market Revenue Million Forecast, by Country 2019 & 2032
- Table 64: Global Multi-Terabit Optical Switching Market Volume K Unit Forecast, by Country 2019 & 2032
- Table 65: Brazil Multi-Terabit Optical Switching Market Revenue (Million) Forecast, by Application 2019 & 2032
- Table 66: Brazil Multi-Terabit Optical Switching Market Volume (K Unit) Forecast, by Application 2019 & 2032
- Table 67: Argentina Multi-Terabit Optical Switching Market Revenue (Million) Forecast, by Application 2019 & 2032
- Table 68: Argentina Multi-Terabit Optical Switching Market Volume (K Unit) Forecast, by Application 2019 & 2032
- Table 69: Peru Multi-Terabit Optical Switching Market Revenue (Million) Forecast, by Application 2019 & 2032
- Table 70: Peru Multi-Terabit Optical Switching Market Volume (K Unit) Forecast, by Application 2019 & 2032
- Table 71: Chile Multi-Terabit Optical Switching Market Revenue (Million) Forecast, by Application 2019 & 2032
- Table 72: Chile Multi-Terabit Optical Switching Market Volume (K Unit) Forecast, by Application 2019 & 2032
- Table 73: Colombia Multi-Terabit Optical Switching Market Revenue (Million) Forecast, by Application 2019 & 2032
- Table 74: Colombia Multi-Terabit Optical Switching Market Volume (K Unit) Forecast, by Application 2019 & 2032
- Table 75: Ecuador Multi-Terabit Optical Switching Market Revenue (Million) Forecast, by Application 2019 & 2032
- Table 76: Ecuador Multi-Terabit Optical Switching Market Volume (K Unit) Forecast, by Application 2019 & 2032
- Table 77: Venezuela Multi-Terabit Optical Switching Market Revenue (Million) Forecast, by Application 2019 & 2032
- Table 78: Venezuela Multi-Terabit Optical Switching Market Volume (K Unit) Forecast, by Application 2019 & 2032
- Table 79: Rest of South America Multi-Terabit Optical Switching Market Revenue (Million) Forecast, by Application 2019 & 2032
- Table 80: Rest of South America Multi-Terabit Optical Switching Market Volume (K Unit) Forecast, by Application 2019 & 2032
- Table 81: Global Multi-Terabit Optical Switching Market Revenue Million Forecast, by Country 2019 & 2032
- Table 82: Global Multi-Terabit Optical Switching Market Volume K Unit Forecast, by Country 2019 & 2032
- Table 83: United States Multi-Terabit Optical Switching Market Revenue (Million) Forecast, by Application 2019 & 2032
- Table 84: United States Multi-Terabit Optical Switching Market Volume (K Unit) Forecast, by Application 2019 & 2032
- Table 85: Canada Multi-Terabit Optical Switching Market Revenue (Million) Forecast, by Application 2019 & 2032
- Table 86: Canada Multi-Terabit Optical Switching Market Volume (K Unit) Forecast, by Application 2019 & 2032
- Table 87: Mexico Multi-Terabit Optical Switching Market Revenue (Million) Forecast, by Application 2019 & 2032
- Table 88: Mexico Multi-Terabit Optical Switching Market Volume (K Unit) Forecast, by Application 2019 & 2032
- Table 89: Global Multi-Terabit Optical Switching Market Revenue Million Forecast, by Country 2019 & 2032
- Table 90: Global Multi-Terabit Optical Switching Market Volume K Unit Forecast, by Country 2019 & 2032
- Table 91: United Arab Emirates Multi-Terabit Optical Switching Market Revenue (Million) Forecast, by Application 2019 & 2032
- Table 92: United Arab Emirates Multi-Terabit Optical Switching Market Volume (K Unit) Forecast, by Application 2019 & 2032
- Table 93: Saudi Arabia Multi-Terabit Optical Switching Market Revenue (Million) Forecast, by Application 2019 & 2032
- Table 94: Saudi Arabia Multi-Terabit Optical Switching Market Volume (K Unit) Forecast, by Application 2019 & 2032
- Table 95: South Africa Multi-Terabit Optical Switching Market Revenue (Million) Forecast, by Application 2019 & 2032
- Table 96: South Africa Multi-Terabit Optical Switching Market Volume (K Unit) Forecast, by Application 2019 & 2032
- Table 97: Rest of Middle East and Africa Multi-Terabit Optical Switching Market Revenue (Million) Forecast, by Application 2019 & 2032
- Table 98: Rest of Middle East and Africa Multi-Terabit Optical Switching Market Volume (K Unit) Forecast, by Application 2019 & 2032
- Table 99: Global Multi-Terabit Optical Switching Market Revenue Million Forecast, by Type 2019 & 2032
- Table 100: Global Multi-Terabit Optical Switching Market Volume K Unit Forecast, by Type 2019 & 2032
- Table 101: Global Multi-Terabit Optical Switching Market Revenue Million Forecast, by End-User Industry 2019 & 2032
- Table 102: Global Multi-Terabit Optical Switching Market Volume K Unit Forecast, by End-User Industry 2019 & 2032
- Table 103: Global Multi-Terabit Optical Switching Market Revenue Million Forecast, by Country 2019 & 2032
- Table 104: Global Multi-Terabit Optical Switching Market Volume K Unit Forecast, by Country 2019 & 2032
- Table 105: Global Multi-Terabit Optical Switching Market Revenue Million Forecast, by Type 2019 & 2032
- Table 106: Global Multi-Terabit Optical Switching Market Volume K Unit Forecast, by Type 2019 & 2032
- Table 107: Global Multi-Terabit Optical Switching Market Revenue Million Forecast, by End-User Industry 2019 & 2032
- Table 108: Global Multi-Terabit Optical Switching Market Volume K Unit Forecast, by End-User Industry 2019 & 2032
- Table 109: Global Multi-Terabit Optical Switching Market Revenue Million Forecast, by Country 2019 & 2032
- Table 110: Global Multi-Terabit Optical Switching Market Volume K Unit Forecast, by Country 2019 & 2032
- Table 111: Global Multi-Terabit Optical Switching Market Revenue Million Forecast, by Type 2019 & 2032
- Table 112: Global Multi-Terabit Optical Switching Market Volume K Unit Forecast, by Type 2019 & 2032
- Table 113: Global Multi-Terabit Optical Switching Market Revenue Million Forecast, by End-User Industry 2019 & 2032
- Table 114: Global Multi-Terabit Optical Switching Market Volume K Unit Forecast, by End-User Industry 2019 & 2032
- Table 115: Global Multi-Terabit Optical Switching Market Revenue Million Forecast, by Country 2019 & 2032
- Table 116: Global Multi-Terabit Optical Switching Market Volume K Unit Forecast, by Country 2019 & 2032
- Table 117: Global Multi-Terabit Optical Switching Market Revenue Million Forecast, by Type 2019 & 2032
- Table 118: Global Multi-Terabit Optical Switching Market Volume K Unit Forecast, by Type 2019 & 2032
- Table 119: Global Multi-Terabit Optical Switching Market Revenue Million Forecast, by End-User Industry 2019 & 2032
- Table 120: Global Multi-Terabit Optical Switching Market Volume K Unit Forecast, by End-User Industry 2019 & 2032
- Table 121: Global Multi-Terabit Optical Switching Market Revenue Million Forecast, by Country 2019 & 2032
- Table 122: Global Multi-Terabit Optical Switching Market Volume K Unit Forecast, by Country 2019 & 2032
- Table 123: Global Multi-Terabit Optical Switching Market Revenue Million Forecast, by Type 2019 & 2032
- Table 124: Global Multi-Terabit Optical Switching Market Volume K Unit Forecast, by Type 2019 & 2032
- Table 125: Global Multi-Terabit Optical Switching Market Revenue Million Forecast, by End-User Industry 2019 & 2032
- Table 126: Global Multi-Terabit Optical Switching Market Volume K Unit Forecast, by End-User Industry 2019 & 2032
- Table 127: Global Multi-Terabit Optical Switching Market Revenue Million Forecast, by Country 2019 & 2032
- Table 128: Global Multi-Terabit Optical Switching Market Volume K Unit Forecast, by Country 2019 & 2032
Frequently Asked Questions
1. What is the projected Compound Annual Growth Rate (CAGR) of the Multi-Terabit Optical Switching Market?
The projected CAGR is approximately 11.58%.
2. Which companies are prominent players in the Multi-Terabit Optical Switching Market?
Key companies in the market include Furukawa Electric Co Ltd, Fujitsu Ltd, Cisco Systems Inc, Broadcom Inc, Juniper Networks, Keysight Technologies Inc, Huawei Technologies Co Ltd, Nokia Corporation, NTT Advanced Technology Corporation, Agiltron Inc.
3. What are the main segments of the Multi-Terabit Optical Switching Market?
The market segments include Type, End-User Industry.
4. Can you provide details about the market size?
The market size is estimated to be USD XX Million as of 2022.
5. What are some drivers contributing to market growth?
Growing Adoption of Digitalization; Widespread Implementation of 5G and Increase in Demand for Data Centers.
6. What are the notable trends driving market growth?
IT and Telecom is Analyzed to Grow at Highest Rate During the Forecast Period.
7. Are there any restraints impacting market growth?
High Costs of Optical Switches.
8. Can you provide examples of recent developments in the market?
November 2021-ADVA announced that it would play a significant role in three research projects that will use space division multiplexing (SDM) technology to increase the capacity of optical networks. The efforts, partially financed by Germany's Federal Ministry of Education and Research (BMBF), aim to revolutionize optical transport systems by leveraging several parallel transmission routes. The study will look for innovative solutions to deal with the exponential data traffic growth while lowering the cost per bit. The projects will create and demonstrate solutions to allow the next generation of high-performance networks over three years.
9. What pricing options are available for accessing the report?
Pricing options include single-user, multi-user, and enterprise licenses priced at USD 4750, USD 5250, and USD 8750 respectively.
10. Is the market size provided in terms of value or volume?
The market size is provided in terms of value, measured in Million and volume, measured in K Unit.
11. Are there any specific market keywords associated with the report?
Yes, the market keyword associated with the report is "Multi-Terabit Optical Switching Market," which aids in identifying and referencing the specific market segment covered.
12. How do I determine which pricing option suits my needs best?
The pricing options vary based on user requirements and access needs. Individual users may opt for single-user licenses, while businesses requiring broader access may choose multi-user or enterprise licenses for cost-effective access to the report.
13. Are there any additional resources or data provided in the Multi-Terabit Optical Switching Market report?
While the report offers comprehensive insights, it's advisable to review the specific contents or supplementary materials provided to ascertain if additional resources or data are available.
14. How can I stay updated on further developments or reports in the Multi-Terabit Optical Switching Market?
To stay informed about further developments, trends, and reports in the Multi-Terabit Optical Switching Market, consider subscribing to industry newsletters, following relevant companies and organizations, or regularly checking reputable industry news sources and publications.
Methodology
Step 1 - Identification of Relevant Samples Size from Population Database


Step 2 - Approaches for Defining Global Market Size (Value, Volume* & Price*)

Note*: In applicable scenarios
Step 3 - Data Sources
Primary Research
- Web Analytics
- Survey Reports
- Research Institute
- Latest Research Reports
- Opinion Leaders
Secondary Research
- Annual Reports
- White Paper
- Latest Press Release
- Industry Association
- Paid Database
- Investor Presentations

Step 4 - Data Triangulation
Involves using different sources of information in order to increase the validity of a study
These sources are likely to be stakeholders in a program - participants, other researchers, program staff, other community members, and so on.
Then we put all data in single framework & apply various statistical tools to find out the dynamic on the market.
During the analysis stage, feedback from the stakeholder groups would be compared to determine areas of agreement as well as areas of divergence


