
Key Insights
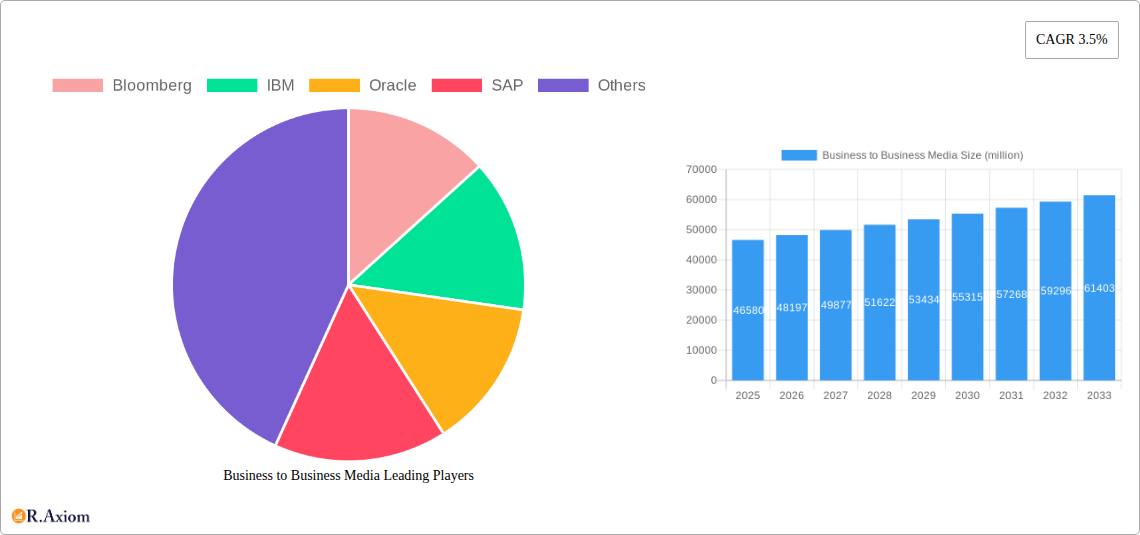
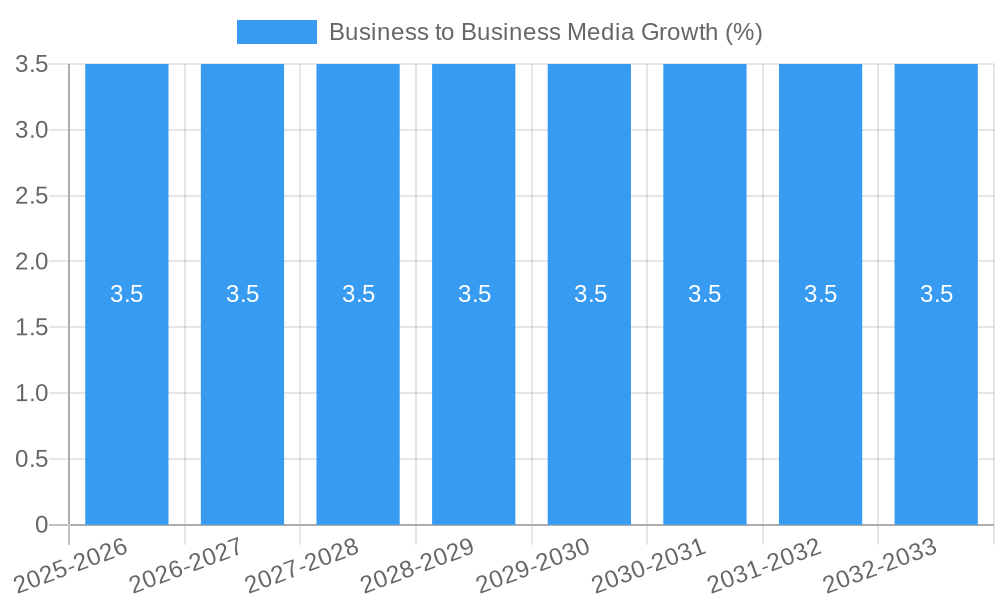
The Business to Business (B2B) Media market is poised for robust expansion, projected to reach an estimated USD 46,580 million in 2025, driven by a consistent Compound Annual Growth Rate (CAGR) of 3.5% through 2033. This sustained growth is largely fueled by the increasing demand for targeted content and specialized information across a multitude of industries, including Business Services, IT, Retail, and Finance. Businesses are increasingly leveraging B2B media for effective customer engagement, lead generation, and brand building. The shift towards digital platforms for content delivery, encompassing online publications, webinars, and social media, is a significant trend, complemented by ongoing demand for traditional formats like print media for certain high-value content and events that foster direct networking and engagement. The market's dynamism is also evident in the diverse applications, from critical business intelligence and financial news dissemination by giants like Bloomberg and IBM, to enterprise resource planning solutions from SAP and Oracle, all of which rely on sophisticated B2B media strategies.
Further propelling this market forward is the evolving landscape of marketing and communication, where personalized and data-driven B2B media solutions are becoming paramount. Companies are investing heavily in understanding niche audience needs and delivering tailored content that resonates, thereby enhancing customer loyalty and driving revenue. While the digital transformation offers immense opportunities, challenges such as content saturation and the need for continuous innovation in engagement strategies are present. Nevertheless, the inherent value proposition of B2B media in facilitating crucial business interactions and information exchange ensures its continued relevance and growth. Emerging markets, particularly in Asia Pacific, are expected to contribute significantly to this growth trajectory, as businesses in these regions increasingly adopt sophisticated B2B media strategies to compete on a global scale. The strategic integration of events, print, and digital channels will be key for market players to capture a larger share of this expanding market.
This in-depth report delivers a panoramic view of the Business to Business (B2B) Media market, analyzing its intricate dynamics, growth trajectories, and future potential. Leveraging extensive research and data, this analysis provides actionable insights for industry stakeholders, marketers, and investors navigating the evolving landscape of B2B media. The study encompasses a detailed examination of market concentration, innovation drivers, emerging trends, dominant segments, and key players, offering a definitive resource for strategic decision-making.
Business to Business Media Market Concentration & Innovation
The Business to Business Media market exhibits a moderate level of concentration, with a few dominant players like Bloomberg, IBM, Oracle, and SAP holding significant market share, estimated to be in the range of 30-40% for the top five entities. Innovation is a critical driver, fueled by the relentless pursuit of enhanced data analytics, personalized content delivery, and immersive digital experiences. Regulatory frameworks, while generally supportive, require adherence to data privacy laws like GDPR, impacting data utilization strategies. Product substitutes, such as direct sales channels and internal marketing teams, present a constant competitive challenge, demanding continuous value proposition enhancement from B2B media providers. End-user trends are leaning towards demand for data-driven insights, ROI justification, and integrated multi-channel campaigns. Mergers and acquisitions (M&A) activity, with estimated deal values in the hundreds of millions, is strategically focused on acquiring niche technologies, expanding geographic reach, and consolidating market presence.
Business to Business Media Industry Trends & Insights
The Business to Business Media industry is poised for significant growth, driven by an estimated Compound Annual Growth Rate (CAGR) of approximately 8% over the forecast period (2025-2033). This expansion is underpinned by the increasing need for specialized information and targeted communication within professional sectors. Technological disruptions, particularly the advent of AI-powered content creation, advanced analytics for audience segmentation, and the metaverse for virtual events, are fundamentally reshaping how B2B media is produced and consumed. Consumer preferences are shifting towards personalized, value-added content that directly addresses business challenges and facilitates decision-making. Marketers are prioritizing measurable ROI, leading to a demand for sophisticated attribution models and performance-tracking tools. The competitive dynamics are intensifying, with a clear distinction emerging between traditional media outlets adapting to digital formats and new digital-native platforms offering innovative solutions. Market penetration is projected to reach over 70% across key segments by 2033, signifying the growing indispensability of B2B media in the corporate ecosystem.
Dominant Markets & Segments in Business to Business Media
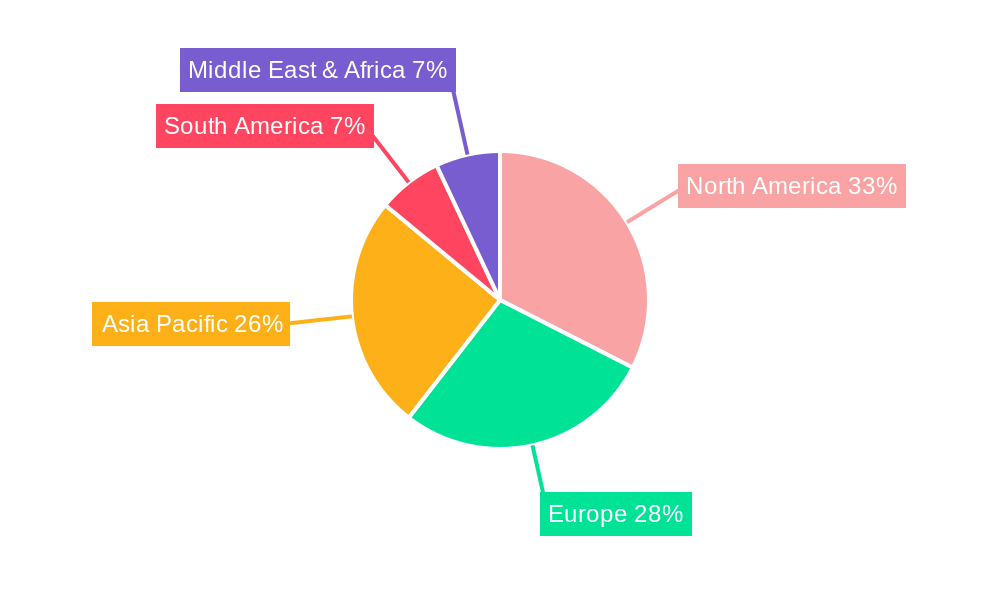
The IT and Finance segments are emerging as the most dominant applications within the Business to Business Media market, collectively accounting for an estimated 45% of the total market value. This dominance is propelled by the rapid pace of technological innovation in IT and the inherent need for real-time financial data, analysis, and insights in the Finance sector. Geographically, North America continues to lead, representing a substantial portion of global B2B media expenditure, estimated at over 40% of the total market size. This leadership is attributed to its robust economy, high adoption of digital technologies, and the presence of major corporate headquarters.
Key Drivers in IT:
- Constant innovation in software, hardware, and cloud services.
- High demand for cybersecurity solutions and data management tools.
- Strong emphasis on digital transformation initiatives across industries.
- Significant R&D investments by leading IT corporations.
Key Drivers in Finance:
- Need for real-time market data, analytics, and trading platforms.
- Strict regulatory compliance demands requiring specialized information.
- Growth in fintech and the increasing complexity of financial instruments.
- Globalized financial markets necessitating cross-border information flow.
Among the types of B2B media, Digital platforms and Business Information services are experiencing the most significant growth and market penetration, estimated to capture over 60% of the market by 2033. Digital channels offer unparalleled reach, customization, and measurability, while Business Information providers offer crucial data, research, and analytics that empower strategic decision-making. Events, both physical and virtual, continue to play a vital role, particularly in fostering networking and product launches, with an estimated market share of around 20%. Print media, while experiencing a decline, retains a niche but important role in specific industries requiring in-depth, tangible publications.
Business to Business Media Product Developments
Product development in Business to Business Media is increasingly focused on AI-driven content personalization, interactive data visualization tools, and integrated marketing platforms. Companies are investing in solutions that offer deeper audience insights, automate campaign management, and provide measurable ROI for advertisers. The competitive advantage lies in the ability to deliver targeted, high-impact content that resonates with specific professional audiences, fostering stronger engagement and driving business outcomes. Technological trends like machine learning and natural language processing are integral to creating more sophisticated and effective B2B media products.
Report Scope & Segmentation Analysis
This report segments the Business to Business Media market across key applications and types.
Application Segments:
- Business Services: This segment encompasses media tailored for consulting firms, logistics companies, and human resources providers, projected to grow at a CAGR of 7.5%.
- IT: Covering media for software, hardware, cloud services, and IT consulting, expected to expand with a CAGR of 9.2%.
- Retail: Media for B2B suppliers, e-commerce platforms, and retail technology providers, with a projected CAGR of 6.8%.
- Finance: Media for financial institutions, investment firms, and fintech companies, anticipated to grow at a CAGR of 8.8%.
Type Segments:
- Events: Includes conferences, trade shows, webinars, and virtual summits, with a projected CAGR of 7.9%.
- Print: Encompasses trade magazines, journals, and specialized publications, expected to see a modest CAGR of 3.1%.
- Digital: Covers online publications, websites, social media, email marketing, and digital advertising, with a strong projected CAGR of 9.5%.
- Business Information: Includes data analytics, market research reports, and subscription-based information services, with a robust CAGR of 8.5%.
Key Drivers of Business to Business Media Growth
The growth of the Business to Business Media sector is propelled by several interconnected factors. Technological advancements, particularly the proliferation of digital platforms and data analytics tools, enable more targeted and effective media delivery. The increasing complexity of business markets necessitates specialized information and insights, driving demand for B2B media content. Globalization continues to expand the reach of businesses, creating a need for cross-border media solutions. Furthermore, evolving regulatory landscapes in areas like data privacy often require businesses to seek expert guidance and information, further boosting the B2B media sector.
Challenges in the Business to Business Media Sector
Despite its growth, the Business to Business Media sector faces notable challenges. Intensifying competition from both established players and agile digital startups puts pressure on pricing and innovation. Measuring ROI effectively remains a persistent hurdle for B2B media buyers, demanding greater transparency and performance-based models. Ad fatigue among business audiences, saturated with constant information streams, requires media providers to create more engaging and relevant content. Evolving consumer preferences and the rapid pace of technological change necessitate continuous adaptation and investment in new platforms and methodologies.
Emerging Opportunities in Business to Business Media
Significant emerging opportunities lie in the personalization of content through AI and machine learning, allowing for hyper-targeted campaigns. The metaverse and immersive technologies present a novel frontier for virtual events, product demonstrations, and interactive brand experiences. The growing demand for data analytics and actionable insights creates opportunities for B2B media providers to offer sophisticated research and consulting services. Furthermore, the expansion of niche professional communities online offers untapped potential for specialized media tailored to specific industries and job functions.
Leading Players in the Business to Business Media Market
- Bloomberg
- IBM
- Oracle
- SAP
- Salesforce
- Microsoft
- Adobe
- Cisco
- Dow Jones
- Thomson Reuters
Key Developments in Business to Business Media Industry
- 2023/04: Increased investment in AI-powered content generation and personalization tools by major B2B media houses.
- 2023/03: Significant M&A activity focused on acquiring data analytics firms to enhance audience segmentation capabilities.
- 2023/01: Growing adoption of virtual and hybrid event formats, offering greater flexibility and reach for B2B engagement.
- 2022/12: Launch of advanced marketing automation platforms integrating CRM, content management, and analytics for B2B clients.
- 2022/10: Increased focus on sustainability and ESG reporting within B2B media content and events.
Strategic Outlook for Business to Business Media Market
The strategic outlook for the Business to Business Media market remains exceptionally positive. The continued digital transformation across industries, coupled with the increasing need for specialized knowledge and data-driven decision-making, will fuel sustained demand. Key growth catalysts include the adoption of emerging technologies like AI and AR/VR, the development of hyper-personalized content strategies, and the expansion into new geographic markets. B2B media companies that can demonstrate clear ROI, offer innovative engagement models, and adapt to evolving audience behaviors are best positioned for long-term success and market leadership.
Business to Business Media Segmentation
-
1. Application
- 1.1. Business Services
- 1.2. IT
- 1.3. Retail
- 1.4. Finance
-
2. Types
- 2.1. Events
- 2.2. Print
- 2.3. Digital
- 2.4. Business Information
Business to Business Media Segmentation By Geography
-
1. North America
- 1.1. United States
- 1.2. Canada
- 1.3. Mexico
-
2. South America
- 2.1. Brazil
- 2.2. Argentina
- 2.3. Rest of South America
-
3. Europe
- 3.1. United Kingdom
- 3.2. Germany
- 3.3. France
- 3.4. Italy
- 3.5. Spain
- 3.6. Russia
- 3.7. Benelux
- 3.8. Nordics
- 3.9. Rest of Europe
-
4. Middle East & Africa
- 4.1. Turkey
- 4.2. Israel
- 4.3. GCC
- 4.4. North Africa
- 4.5. South Africa
- 4.6. Rest of Middle East & Africa
-
5. Asia Pacific
- 5.1. China
- 5.2. India
- 5.3. Japan
- 5.4. South Korea
- 5.5. ASEAN
- 5.6. Oceania
- 5.7. Rest of Asia Pacific
Business to Business Media REPORT HIGHLIGHTS
| Aspects | Details |
|---|---|
| Study Period | 2019-2033 |
| Base Year | 2024 |
| Estimated Year | 2025 |
| Forecast Period | 2025-2033 |
| Historical Period | 2019-2024 |
| Growth Rate | CAGR of 3.5% from 2019-2033 |
| Segmentation |
|
Table of Contents
- 1. Introduction
- 1.1. Research Scope
- 1.2. Market Segmentation
- 1.3. Research Methodology
- 1.4. Definitions and Assumptions
- 2. Executive Summary
- 2.1. Introduction
- 3. Market Dynamics
- 3.1. Introduction
- 3.2. Market Drivers
- 3.3. Market Restrains
- 3.4. Market Trends
- 4. Market Factor Analysis
- 4.1. Porters Five Forces
- 4.2. Supply/Value Chain
- 4.3. PESTEL analysis
- 4.4. Market Entropy
- 4.5. Patent/Trademark Analysis
- 5. Global Business to Business Media Analysis, Insights and Forecast, 2019-2031
- 5.1. Market Analysis, Insights and Forecast - by Application
- 5.1.1. Business Services
- 5.1.2. IT
- 5.1.3. Retail
- 5.1.4. Finance
- 5.2. Market Analysis, Insights and Forecast - by Types
- 5.2.1. Events
- 5.2.2. Print
- 5.2.3. Digital
- 5.2.4. Business Information
- 5.3. Market Analysis, Insights and Forecast - by Region
- 5.3.1. North America
- 5.3.2. South America
- 5.3.3. Europe
- 5.3.4. Middle East & Africa
- 5.3.5. Asia Pacific
- 5.1. Market Analysis, Insights and Forecast - by Application
- 6. North America Business to Business Media Analysis, Insights and Forecast, 2019-2031
- 6.1. Market Analysis, Insights and Forecast - by Application
- 6.1.1. Business Services
- 6.1.2. IT
- 6.1.3. Retail
- 6.1.4. Finance
- 6.2. Market Analysis, Insights and Forecast - by Types
- 6.2.1. Events
- 6.2.2. Print
- 6.2.3. Digital
- 6.2.4. Business Information
- 6.1. Market Analysis, Insights and Forecast - by Application
- 7. South America Business to Business Media Analysis, Insights and Forecast, 2019-2031
- 7.1. Market Analysis, Insights and Forecast - by Application
- 7.1.1. Business Services
- 7.1.2. IT
- 7.1.3. Retail
- 7.1.4. Finance
- 7.2. Market Analysis, Insights and Forecast - by Types
- 7.2.1. Events
- 7.2.2. Print
- 7.2.3. Digital
- 7.2.4. Business Information
- 7.1. Market Analysis, Insights and Forecast - by Application
- 8. Europe Business to Business Media Analysis, Insights and Forecast, 2019-2031
- 8.1. Market Analysis, Insights and Forecast - by Application
- 8.1.1. Business Services
- 8.1.2. IT
- 8.1.3. Retail
- 8.1.4. Finance
- 8.2. Market Analysis, Insights and Forecast - by Types
- 8.2.1. Events
- 8.2.2. Print
- 8.2.3. Digital
- 8.2.4. Business Information
- 8.1. Market Analysis, Insights and Forecast - by Application
- 9. Middle East & Africa Business to Business Media Analysis, Insights and Forecast, 2019-2031
- 9.1. Market Analysis, Insights and Forecast - by Application
- 9.1.1. Business Services
- 9.1.2. IT
- 9.1.3. Retail
- 9.1.4. Finance
- 9.2. Market Analysis, Insights and Forecast - by Types
- 9.2.1. Events
- 9.2.2. Print
- 9.2.3. Digital
- 9.2.4. Business Information
- 9.1. Market Analysis, Insights and Forecast - by Application
- 10. Asia Pacific Business to Business Media Analysis, Insights and Forecast, 2019-2031
- 10.1. Market Analysis, Insights and Forecast - by Application
- 10.1.1. Business Services
- 10.1.2. IT
- 10.1.3. Retail
- 10.1.4. Finance
- 10.2. Market Analysis, Insights and Forecast - by Types
- 10.2.1. Events
- 10.2.2. Print
- 10.2.3. Digital
- 10.2.4. Business Information
- 10.1. Market Analysis, Insights and Forecast - by Application
- 11. Competitive Analysis
- 11.1. Global Market Share Analysis 2024
- 11.2. Company Profiles
- 11.2.1 Bloomberg
- 11.2.1.1. Overview
- 11.2.1.2. Products
- 11.2.1.3. SWOT Analysis
- 11.2.1.4. Recent Developments
- 11.2.1.5. Financials (Based on Availability)
- 11.2.2 IBM
- 11.2.2.1. Overview
- 11.2.2.2. Products
- 11.2.2.3. SWOT Analysis
- 11.2.2.4. Recent Developments
- 11.2.2.5. Financials (Based on Availability)
- 11.2.3 Oracle
- 11.2.3.1. Overview
- 11.2.3.2. Products
- 11.2.3.3. SWOT Analysis
- 11.2.3.4. Recent Developments
- 11.2.3.5. Financials (Based on Availability)
- 11.2.4 SAP
- 11.2.4.1. Overview
- 11.2.4.2. Products
- 11.2.4.3. SWOT Analysis
- 11.2.4.4. Recent Developments
- 11.2.4.5. Financials (Based on Availability)
- 11.2.1 Bloomberg
List of Figures
- Figure 1: Global Business to Business Media Revenue Breakdown (million, %) by Region 2024 & 2032
- Figure 2: North America Business to Business Media Revenue (million), by Application 2024 & 2032
- Figure 3: North America Business to Business Media Revenue Share (%), by Application 2024 & 2032
- Figure 4: North America Business to Business Media Revenue (million), by Types 2024 & 2032
- Figure 5: North America Business to Business Media Revenue Share (%), by Types 2024 & 2032
- Figure 6: North America Business to Business Media Revenue (million), by Country 2024 & 2032
- Figure 7: North America Business to Business Media Revenue Share (%), by Country 2024 & 2032
- Figure 8: South America Business to Business Media Revenue (million), by Application 2024 & 2032
- Figure 9: South America Business to Business Media Revenue Share (%), by Application 2024 & 2032
- Figure 10: South America Business to Business Media Revenue (million), by Types 2024 & 2032
- Figure 11: South America Business to Business Media Revenue Share (%), by Types 2024 & 2032
- Figure 12: South America Business to Business Media Revenue (million), by Country 2024 & 2032
- Figure 13: South America Business to Business Media Revenue Share (%), by Country 2024 & 2032
- Figure 14: Europe Business to Business Media Revenue (million), by Application 2024 & 2032
- Figure 15: Europe Business to Business Media Revenue Share (%), by Application 2024 & 2032
- Figure 16: Europe Business to Business Media Revenue (million), by Types 2024 & 2032
- Figure 17: Europe Business to Business Media Revenue Share (%), by Types 2024 & 2032
- Figure 18: Europe Business to Business Media Revenue (million), by Country 2024 & 2032
- Figure 19: Europe Business to Business Media Revenue Share (%), by Country 2024 & 2032
- Figure 20: Middle East & Africa Business to Business Media Revenue (million), by Application 2024 & 2032
- Figure 21: Middle East & Africa Business to Business Media Revenue Share (%), by Application 2024 & 2032
- Figure 22: Middle East & Africa Business to Business Media Revenue (million), by Types 2024 & 2032
- Figure 23: Middle East & Africa Business to Business Media Revenue Share (%), by Types 2024 & 2032
- Figure 24: Middle East & Africa Business to Business Media Revenue (million), by Country 2024 & 2032
- Figure 25: Middle East & Africa Business to Business Media Revenue Share (%), by Country 2024 & 2032
- Figure 26: Asia Pacific Business to Business Media Revenue (million), by Application 2024 & 2032
- Figure 27: Asia Pacific Business to Business Media Revenue Share (%), by Application 2024 & 2032
- Figure 28: Asia Pacific Business to Business Media Revenue (million), by Types 2024 & 2032
- Figure 29: Asia Pacific Business to Business Media Revenue Share (%), by Types 2024 & 2032
- Figure 30: Asia Pacific Business to Business Media Revenue (million), by Country 2024 & 2032
- Figure 31: Asia Pacific Business to Business Media Revenue Share (%), by Country 2024 & 2032
List of Tables
- Table 1: Global Business to Business Media Revenue million Forecast, by Region 2019 & 2032
- Table 2: Global Business to Business Media Revenue million Forecast, by Application 2019 & 2032
- Table 3: Global Business to Business Media Revenue million Forecast, by Types 2019 & 2032
- Table 4: Global Business to Business Media Revenue million Forecast, by Region 2019 & 2032
- Table 5: Global Business to Business Media Revenue million Forecast, by Application 2019 & 2032
- Table 6: Global Business to Business Media Revenue million Forecast, by Types 2019 & 2032
- Table 7: Global Business to Business Media Revenue million Forecast, by Country 2019 & 2032
- Table 8: United States Business to Business Media Revenue (million) Forecast, by Application 2019 & 2032
- Table 9: Canada Business to Business Media Revenue (million) Forecast, by Application 2019 & 2032
- Table 10: Mexico Business to Business Media Revenue (million) Forecast, by Application 2019 & 2032
- Table 11: Global Business to Business Media Revenue million Forecast, by Application 2019 & 2032
- Table 12: Global Business to Business Media Revenue million Forecast, by Types 2019 & 2032
- Table 13: Global Business to Business Media Revenue million Forecast, by Country 2019 & 2032
- Table 14: Brazil Business to Business Media Revenue (million) Forecast, by Application 2019 & 2032
- Table 15: Argentina Business to Business Media Revenue (million) Forecast, by Application 2019 & 2032
- Table 16: Rest of South America Business to Business Media Revenue (million) Forecast, by Application 2019 & 2032
- Table 17: Global Business to Business Media Revenue million Forecast, by Application 2019 & 2032
- Table 18: Global Business to Business Media Revenue million Forecast, by Types 2019 & 2032
- Table 19: Global Business to Business Media Revenue million Forecast, by Country 2019 & 2032
- Table 20: United Kingdom Business to Business Media Revenue (million) Forecast, by Application 2019 & 2032
- Table 21: Germany Business to Business Media Revenue (million) Forecast, by Application 2019 & 2032
- Table 22: France Business to Business Media Revenue (million) Forecast, by Application 2019 & 2032
- Table 23: Italy Business to Business Media Revenue (million) Forecast, by Application 2019 & 2032
- Table 24: Spain Business to Business Media Revenue (million) Forecast, by Application 2019 & 2032
- Table 25: Russia Business to Business Media Revenue (million) Forecast, by Application 2019 & 2032
- Table 26: Benelux Business to Business Media Revenue (million) Forecast, by Application 2019 & 2032
- Table 27: Nordics Business to Business Media Revenue (million) Forecast, by Application 2019 & 2032
- Table 28: Rest of Europe Business to Business Media Revenue (million) Forecast, by Application 2019 & 2032
- Table 29: Global Business to Business Media Revenue million Forecast, by Application 2019 & 2032
- Table 30: Global Business to Business Media Revenue million Forecast, by Types 2019 & 2032
- Table 31: Global Business to Business Media Revenue million Forecast, by Country 2019 & 2032
- Table 32: Turkey Business to Business Media Revenue (million) Forecast, by Application 2019 & 2032
- Table 33: Israel Business to Business Media Revenue (million) Forecast, by Application 2019 & 2032
- Table 34: GCC Business to Business Media Revenue (million) Forecast, by Application 2019 & 2032
- Table 35: North Africa Business to Business Media Revenue (million) Forecast, by Application 2019 & 2032
- Table 36: South Africa Business to Business Media Revenue (million) Forecast, by Application 2019 & 2032
- Table 37: Rest of Middle East & Africa Business to Business Media Revenue (million) Forecast, by Application 2019 & 2032
- Table 38: Global Business to Business Media Revenue million Forecast, by Application 2019 & 2032
- Table 39: Global Business to Business Media Revenue million Forecast, by Types 2019 & 2032
- Table 40: Global Business to Business Media Revenue million Forecast, by Country 2019 & 2032
- Table 41: China Business to Business Media Revenue (million) Forecast, by Application 2019 & 2032
- Table 42: India Business to Business Media Revenue (million) Forecast, by Application 2019 & 2032
- Table 43: Japan Business to Business Media Revenue (million) Forecast, by Application 2019 & 2032
- Table 44: South Korea Business to Business Media Revenue (million) Forecast, by Application 2019 & 2032
- Table 45: ASEAN Business to Business Media Revenue (million) Forecast, by Application 2019 & 2032
- Table 46: Oceania Business to Business Media Revenue (million) Forecast, by Application 2019 & 2032
- Table 47: Rest of Asia Pacific Business to Business Media Revenue (million) Forecast, by Application 2019 & 2032
Frequently Asked Questions
1. What is the projected Compound Annual Growth Rate (CAGR) of the Business to Business Media?
The projected CAGR is approximately 3.5%.
2. Which companies are prominent players in the Business to Business Media?
Key companies in the market include Bloomberg, IBM, Oracle, SAP.
3. What are the main segments of the Business to Business Media?
The market segments include Application, Types.
4. Can you provide details about the market size?
The market size is estimated to be USD 46580 million as of 2022.
5. What are some drivers contributing to market growth?
N/A
6. What are the notable trends driving market growth?
N/A
7. Are there any restraints impacting market growth?
N/A
8. Can you provide examples of recent developments in the market?
N/A
9. What pricing options are available for accessing the report?
Pricing options include single-user, multi-user, and enterprise licenses priced at USD 2900.00, USD 4350.00, and USD 5800.00 respectively.
10. Is the market size provided in terms of value or volume?
The market size is provided in terms of value, measured in million.
11. Are there any specific market keywords associated with the report?
Yes, the market keyword associated with the report is "Business to Business Media," which aids in identifying and referencing the specific market segment covered.
12. How do I determine which pricing option suits my needs best?
The pricing options vary based on user requirements and access needs. Individual users may opt for single-user licenses, while businesses requiring broader access may choose multi-user or enterprise licenses for cost-effective access to the report.
13. Are there any additional resources or data provided in the Business to Business Media report?
While the report offers comprehensive insights, it's advisable to review the specific contents or supplementary materials provided to ascertain if additional resources or data are available.
14. How can I stay updated on further developments or reports in the Business to Business Media?
To stay informed about further developments, trends, and reports in the Business to Business Media, consider subscribing to industry newsletters, following relevant companies and organizations, or regularly checking reputable industry news sources and publications.
Methodology
Step 1 - Identification of Relevant Samples Size from Population Database


Step 2 - Approaches for Defining Global Market Size (Value, Volume* & Price*)

Note*: In applicable scenarios
Step 3 - Data Sources
Primary Research
- Web Analytics
- Survey Reports
- Research Institute
- Latest Research Reports
- Opinion Leaders
Secondary Research
- Annual Reports
- White Paper
- Latest Press Release
- Industry Association
- Paid Database
- Investor Presentations

Step 4 - Data Triangulation
Involves using different sources of information in order to increase the validity of a study
These sources are likely to be stakeholders in a program - participants, other researchers, program staff, other community members, and so on.
Then we put all data in single framework & apply various statistical tools to find out the dynamic on the market.
During the analysis stage, feedback from the stakeholder groups would be compared to determine areas of agreement as well as areas of divergence


