
Key Insights
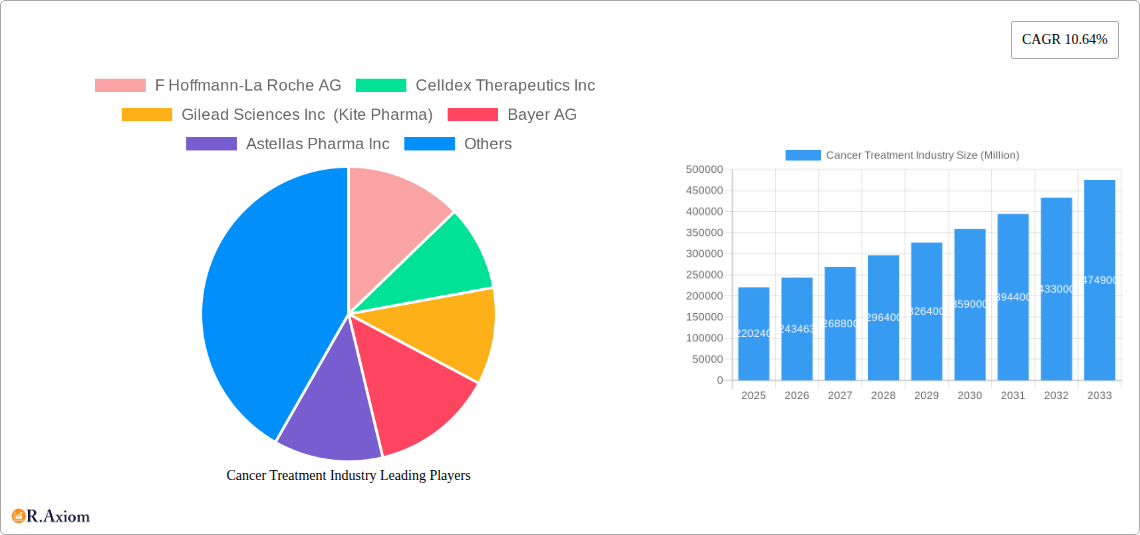
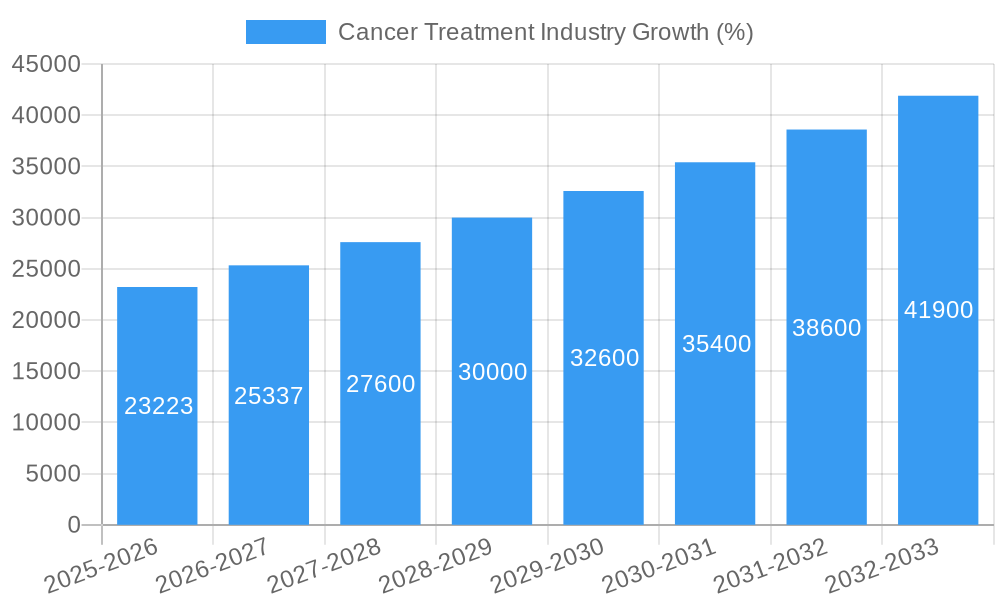
The global cancer treatment market, valued at $220.24 billion in 2025, is projected to experience robust growth, driven by several key factors. Rising cancer incidence rates worldwide, an aging global population increasing susceptibility to various cancers, and advancements in therapeutic modalities like immunotherapy and targeted therapies are significantly bolstering market expansion. The increasing prevalence of specific cancers, such as breast cancer, lung cancer, and prostate cancer, further fuels demand for effective treatments. Furthermore, growing healthcare expenditure and rising disposable incomes in developing economies are expected to contribute significantly to market growth over the forecast period. Government initiatives aimed at improving cancer care infrastructure and raising awareness about early detection and treatment further support market expansion.
However, the market also faces certain challenges. High treatment costs associated with novel therapies, including CAR T-cell therapy and other advanced immunotherapies, can limit accessibility for a considerable portion of the population. Additionally, the development and approval of new cancer treatments is a lengthy and complex process, potentially delaying market entry for innovative therapies. Regulatory hurdles and reimbursement complexities also pose significant challenges to market growth. Despite these restraints, the ongoing research and development efforts in the field of oncology, coupled with the increasing focus on personalized medicine, are expected to drive the market forward, resulting in a compound annual growth rate (CAGR) of 10.64% from 2025 to 2033. The market segmentation by therapy type (chemotherapy, immunotherapy, targeted therapy, etc.) and cancer type (breast, lung, prostate, etc.) reflects the diverse treatment landscape and ongoing efforts to tailor therapies to specific patient needs.
Cancer Treatment Industry: A Comprehensive Market Report (2019-2033)
This in-depth report provides a comprehensive analysis of the global cancer treatment industry, covering market size, segmentation, key players, and future growth prospects. With a detailed examination of the period from 2019 to 2033 (base year 2025), this report offers actionable insights for industry stakeholders, investors, and researchers. The report leverages extensive market data, covering various therapy types, cancer types, and end-users, to provide a holistic view of this dynamic market. The total market size in 2025 is estimated at $XX Million, with a projected Compound Annual Growth Rate (CAGR) of XX% from 2025 to 2033.
Cancer Treatment Industry Market Concentration & Innovation
The global cancer treatment market is characterized by a high degree of concentration, with a few multinational pharmaceutical companies holding significant market share. Key players like F Hoffmann-La Roche AG, Novartis AG, Merck & Co Inc, and Pfizer Inc dominate the landscape, commanding a combined market share of approximately XX%. This dominance stems from their extensive research and development capabilities, robust product pipelines, and strong global distribution networks. However, smaller, specialized companies are also making significant contributions, particularly in the areas of targeted therapy and immunotherapy.
Innovation is a key driver within this industry, with continuous advancements in drug discovery, diagnostic technologies, and treatment modalities. Regulatory frameworks, while stringent, are evolving to expedite the approval of innovative cancer therapies. The intense competition fuels further innovation, pushing the boundaries of treatment efficacy and patient outcomes. Product substitutes, such as alternative therapies and lifestyle modifications, are also gaining traction, albeit still playing a minor role in the overall market.
End-user trends indicate a growing preference for personalized medicine approaches, driving the demand for targeted therapies and companion diagnostics. Mergers and acquisitions (M&A) activity is prevalent, with major players strategically acquiring smaller companies to bolster their portfolios and expand their reach. Recent M&A deal values have been substantial, with some deals exceeding $XX Million, demonstrating the industry's robust investment climate.
- Market Concentration: Top 5 players hold approximately XX% market share.
- Innovation Drivers: Advancements in immunotherapy, targeted therapy, and personalized medicine.
- Regulatory Landscape: Stringent but evolving to facilitate innovation.
- M&A Activity: Significant activity with deals exceeding $XX Million.
Cancer Treatment Industry Industry Trends & Insights
The cancer treatment industry is experiencing robust growth driven by several key factors. The rising global prevalence of cancer, coupled with an aging population, significantly contributes to increasing demand for effective therapies. Technological advancements, particularly in immunotherapy and targeted therapies, are revolutionizing cancer treatment, leading to improved outcomes and patient survival rates. The shift towards personalized medicine is fueling the development of precision therapies tailored to individual patient characteristics. Furthermore, increased healthcare expenditure and improved access to healthcare in emerging economies are contributing to market expansion.
Consumer preferences are shifting towards less invasive treatment options with reduced side effects. This trend fuels the demand for minimally invasive surgical techniques, targeted therapies, and immunotherapy, pushing the boundaries of treatment efficacy and patient satisfaction. The competitive landscape is highly dynamic, characterized by intense rivalry among established players and emerging biotech companies. This competition spurs innovation and leads to continuous improvement in treatment options. The global market is projected to reach $XX Million by 2033, representing a CAGR of XX%. Market penetration of innovative therapies is also increasing, with newer agents gradually replacing older treatments.
Dominant Markets & Segments in Cancer Treatment Industry
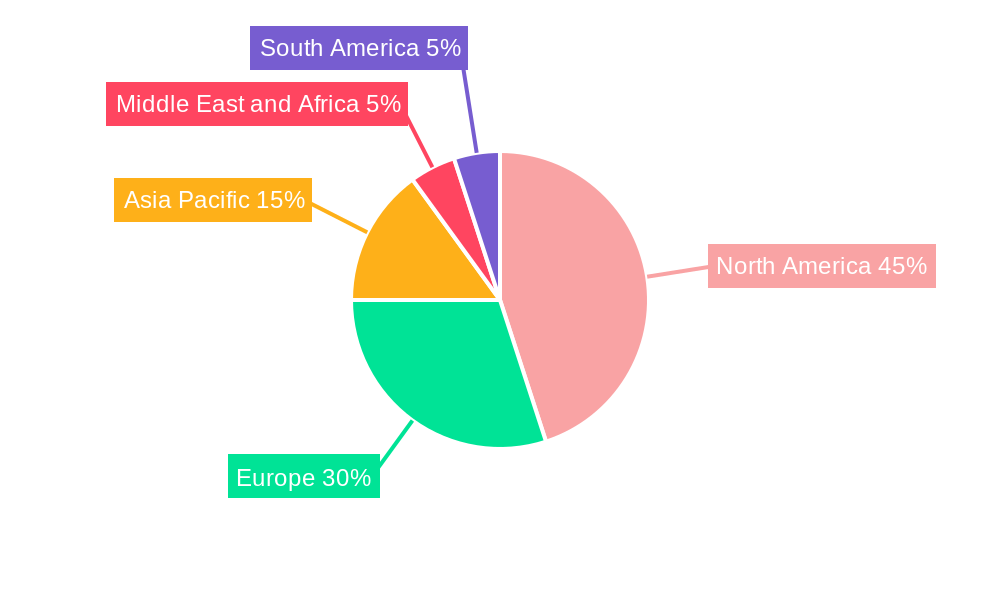
The North American region currently dominates the cancer treatment market, driven by high healthcare expenditure, advanced medical infrastructure, and a large patient pool. Within therapy types, Immunotherapy is witnessing the fastest growth due to its high efficacy and targeted approach. Among cancer types, Blood Cancer and Breast Cancer represent substantial segments.
Key Drivers of Regional Dominance:
- North America: High healthcare expenditure, advanced infrastructure.
- Europe: Robust healthcare systems, growing R&D investments.
- Asia-Pacific: Rising prevalence of cancer, increasing healthcare awareness.
Dominant Therapy Types: Immunotherapy, Targeted Therapy
Dominant Cancer Types: Blood Cancer, Breast Cancer, Lung Cancer
Dominant End Users: Hospitals, Specialty Clinics
The dominance of specific segments is influenced by several factors. For example, the high prevalence of certain cancer types and the availability of advanced treatment facilities drive market share in specific regions. Economic policies, such as government funding for cancer research and healthcare initiatives, also play a pivotal role in driving market growth.
Cancer Treatment Industry Product Developments
Recent years have witnessed significant advancements in cancer treatment, particularly in the areas of immunotherapy and targeted therapies. Innovative therapies, including CAR T-cell therapy, checkpoint inhibitors, and bispecific antibodies, have demonstrated remarkable success in treating various cancers. These therapies offer significant advantages over conventional treatments by targeting cancer cells selectively, minimizing damage to healthy tissues. The continuous emergence of new products and the ongoing clinical trials further underscore the robust innovation within the industry. This technological progress is rapidly changing the landscape of cancer treatment, improving patient outcomes and enhancing quality of life.
Report Scope & Segmentation Analysis
This report comprehensively segments the cancer treatment market based on therapy type (Chemotherapy, Targeted Therapy, Immunotherapy, Hormonal Therapy, Other Treatment Types), cancer type (Blood Cancer, Breast Cancer, Prostate Cancer, Gastrointestinal Cancer, Gynaecologic Cancer, Respiratory/Lung Cancer, Other Cancer Types), and end-user (Hospitals, Specialty Clinics, Cancer and Radiation Therapy Centers). Each segment is analyzed in detail, providing growth projections, market sizes, and competitive dynamics. For example, the Immunotherapy segment is projected to witness significant growth due to its high efficacy and selectivity. Blood Cancer represents a large market segment due to its high prevalence. Hospitals and specialized cancer centers account for a considerable share of end-users owing to their advanced infrastructure and expertise.
Key Drivers of Cancer Treatment Industry Growth
Several key factors are driving the growth of the cancer treatment industry. The rising prevalence of cancer globally, coupled with an aging population, is a major contributor. Advances in biotechnology, particularly in immunotherapy, targeted therapy, and personalized medicine, have revolutionized treatment approaches, leading to improved outcomes. Increased healthcare expenditure and improved access to healthcare in developing economies are also contributing to market expansion. Favorable regulatory environments in certain regions, allowing faster approval of innovative therapies, further accelerate market growth.
Challenges in the Cancer Treatment Industry Sector
Despite significant advancements, the cancer treatment industry faces certain challenges. High drug prices and affordability issues limit access to advanced therapies, particularly in low- and middle-income countries. Stringent regulatory requirements and lengthy approval processes can hinder the timely introduction of new treatments. The complexity of cancer biology necessitates continuous research and development efforts to overcome treatment resistance and improve efficacy. Supply chain disruptions can also impact the availability and affordability of essential drugs and medical devices. Finally, the intense competition among various players adds another layer of complexity.
Emerging Opportunities in Cancer Treatment Industry
Despite the challenges, the cancer treatment industry presents numerous opportunities. The emergence of personalized medicine approaches, driven by advancements in genomics and molecular biology, allows for targeted therapies tailored to specific patient characteristics. The development of novel drug delivery systems promises improved efficacy and reduced side effects. Growing investments in cancer research and development are also fueling the discovery of new treatments. Expanding access to quality healthcare in underserved populations represents a significant market opportunity.
Leading Players in the Cancer Treatment Industry Market
- F Hoffmann-La Roche AG
- Celldex Therapeutics Inc
- Gilead Sciences Inc (Kite Pharma)
- Bayer AG
- Astellas Pharma Inc
- Novartis AG
- Amgen Inc
- Merck & Co Inc
- Takeda Pharmaceutical Company Limited
- AstraZeneca
- Abbvie Inc
- GSK PLC
- Lilly
- Bristol Myers Squibb Company
- Johnson & Johnson Services Inc
- Alaunos Therapeutics Inc
- Pfizer Inc
Key Developments in Cancer Treatment Industry Industry
- May 2023: Genmab A/S received USFDA approval for EPKINLY (epcoritamab-bysp) for R/R DLBCL.
- April 2023: Genentech received USFDA approval for Polivy (polatuzumab vedotin-piiq) in combination with R-CHP for untreated DLBCL.
- April 2023: Gamida Cell Ltd received USFDA approval for Omisirge (omidubicel-onlv) for hematologic malignancies in patients 12+.
Strategic Outlook for Cancer Treatment Industry Market
The future of the cancer treatment industry looks promising, with continued growth fueled by technological advancements, increasing cancer prevalence, and rising healthcare expenditure. The focus on personalized medicine, innovative treatment modalities, and improved access to care will shape the market landscape. Opportunities exist for companies to invest in research and development, expand their product portfolios, and explore new markets. The industry's strategic focus will likely be on developing more effective and targeted therapies, improving patient outcomes, and enhancing accessibility to treatments globally.
Cancer Treatment Industry Segmentation
-
1. Therapy Type
- 1.1. Chemotherapy
- 1.2. Targeted Therapy
- 1.3. Immunotherapy
- 1.4. Hormonal Therapy
- 1.5. Other Treatment Types
-
2. Cancer Type
- 2.1. Blood Cancer
- 2.2. Breast Cancer
- 2.3. Prostate Cancer
- 2.4. Gastrointestinal Cancer
- 2.5. Gynaecologic Cancer
- 2.6. Respiratory/Lung Cancer
- 2.7. Other Cancer Types
-
3. End User
- 3.1. Hospitals
- 3.2. Specialty Clinics
- 3.3. Cancer and Radiation Therapy Centers
Cancer Treatment Industry Segmentation By Geography
-
1. North America
- 1.1. United States
- 1.2. Canada
- 1.3. Mexico
-
2. Europe
- 2.1. Germany
- 2.2. United Kingdom
- 2.3. France
- 2.4. Italy
- 2.5. Spain
- 2.6. Rest of Europe
-
3. Asia Pacific
- 3.1. China
- 3.2. Japan
- 3.3. India
- 3.4. Australia
- 3.5. South Korea
- 3.6. Rest of Asia Pacific
-
4. Middle East and Africa
- 4.1. GCC
- 4.2. South Africa
- 4.3. Rest of Middle East and Africa
-
5. South America
- 5.1. Brazil
- 5.2. Argentina
- 5.3. Rest of South America
Cancer Treatment Industry REPORT HIGHLIGHTS
| Aspects | Details |
|---|---|
| Study Period | 2019-2033 |
| Base Year | 2024 |
| Estimated Year | 2025 |
| Forecast Period | 2025-2033 |
| Historical Period | 2019-2024 |
| Growth Rate | CAGR of 10.64% from 2019-2033 |
| Segmentation |
|
Table of Contents
- 1. Introduction
- 1.1. Research Scope
- 1.2. Market Segmentation
- 1.3. Research Methodology
- 1.4. Definitions and Assumptions
- 2. Executive Summary
- 2.1. Introduction
- 3. Market Dynamics
- 3.1. Introduction
- 3.2. Market Drivers
- 3.2.1. Increasing Patient Assistance Programs (PAPs) and Rising Demand for Personalized Medicine; Growing Government Initiatives for Cancer Awareness; Rising Prevalence of Cancer Worldwide; Strong R&D Initiatives from Key Players
- 3.3. Market Restrains
- 3.3.1. Fluctuation in Reimbursement Policies; High Cost of Cancer Therapies
- 3.4. Market Trends
- 3.4.1. The Targeted Therapy Segment is Expected to Witness Significant Growth during the the Forecast Period
- 4. Market Factor Analysis
- 4.1. Porters Five Forces
- 4.2. Supply/Value Chain
- 4.3. PESTEL analysis
- 4.4. Market Entropy
- 4.5. Patent/Trademark Analysis
- 5. Global Cancer Treatment Industry Analysis, Insights and Forecast, 2019-2031
- 5.1. Market Analysis, Insights and Forecast - by Therapy Type
- 5.1.1. Chemotherapy
- 5.1.2. Targeted Therapy
- 5.1.3. Immunotherapy
- 5.1.4. Hormonal Therapy
- 5.1.5. Other Treatment Types
- 5.2. Market Analysis, Insights and Forecast - by Cancer Type
- 5.2.1. Blood Cancer
- 5.2.2. Breast Cancer
- 5.2.3. Prostate Cancer
- 5.2.4. Gastrointestinal Cancer
- 5.2.5. Gynaecologic Cancer
- 5.2.6. Respiratory/Lung Cancer
- 5.2.7. Other Cancer Types
- 5.3. Market Analysis, Insights and Forecast - by End User
- 5.3.1. Hospitals
- 5.3.2. Specialty Clinics
- 5.3.3. Cancer and Radiation Therapy Centers
- 5.4. Market Analysis, Insights and Forecast - by Region
- 5.4.1. North America
- 5.4.2. Europe
- 5.4.3. Asia Pacific
- 5.4.4. Middle East and Africa
- 5.4.5. South America
- 5.1. Market Analysis, Insights and Forecast - by Therapy Type
- 6. North America Cancer Treatment Industry Analysis, Insights and Forecast, 2019-2031
- 6.1. Market Analysis, Insights and Forecast - by Therapy Type
- 6.1.1. Chemotherapy
- 6.1.2. Targeted Therapy
- 6.1.3. Immunotherapy
- 6.1.4. Hormonal Therapy
- 6.1.5. Other Treatment Types
- 6.2. Market Analysis, Insights and Forecast - by Cancer Type
- 6.2.1. Blood Cancer
- 6.2.2. Breast Cancer
- 6.2.3. Prostate Cancer
- 6.2.4. Gastrointestinal Cancer
- 6.2.5. Gynaecologic Cancer
- 6.2.6. Respiratory/Lung Cancer
- 6.2.7. Other Cancer Types
- 6.3. Market Analysis, Insights and Forecast - by End User
- 6.3.1. Hospitals
- 6.3.2. Specialty Clinics
- 6.3.3. Cancer and Radiation Therapy Centers
- 6.1. Market Analysis, Insights and Forecast - by Therapy Type
- 7. Europe Cancer Treatment Industry Analysis, Insights and Forecast, 2019-2031
- 7.1. Market Analysis, Insights and Forecast - by Therapy Type
- 7.1.1. Chemotherapy
- 7.1.2. Targeted Therapy
- 7.1.3. Immunotherapy
- 7.1.4. Hormonal Therapy
- 7.1.5. Other Treatment Types
- 7.2. Market Analysis, Insights and Forecast - by Cancer Type
- 7.2.1. Blood Cancer
- 7.2.2. Breast Cancer
- 7.2.3. Prostate Cancer
- 7.2.4. Gastrointestinal Cancer
- 7.2.5. Gynaecologic Cancer
- 7.2.6. Respiratory/Lung Cancer
- 7.2.7. Other Cancer Types
- 7.3. Market Analysis, Insights and Forecast - by End User
- 7.3.1. Hospitals
- 7.3.2. Specialty Clinics
- 7.3.3. Cancer and Radiation Therapy Centers
- 7.1. Market Analysis, Insights and Forecast - by Therapy Type
- 8. Asia Pacific Cancer Treatment Industry Analysis, Insights and Forecast, 2019-2031
- 8.1. Market Analysis, Insights and Forecast - by Therapy Type
- 8.1.1. Chemotherapy
- 8.1.2. Targeted Therapy
- 8.1.3. Immunotherapy
- 8.1.4. Hormonal Therapy
- 8.1.5. Other Treatment Types
- 8.2. Market Analysis, Insights and Forecast - by Cancer Type
- 8.2.1. Blood Cancer
- 8.2.2. Breast Cancer
- 8.2.3. Prostate Cancer
- 8.2.4. Gastrointestinal Cancer
- 8.2.5. Gynaecologic Cancer
- 8.2.6. Respiratory/Lung Cancer
- 8.2.7. Other Cancer Types
- 8.3. Market Analysis, Insights and Forecast - by End User
- 8.3.1. Hospitals
- 8.3.2. Specialty Clinics
- 8.3.3. Cancer and Radiation Therapy Centers
- 8.1. Market Analysis, Insights and Forecast - by Therapy Type
- 9. Middle East and Africa Cancer Treatment Industry Analysis, Insights and Forecast, 2019-2031
- 9.1. Market Analysis, Insights and Forecast - by Therapy Type
- 9.1.1. Chemotherapy
- 9.1.2. Targeted Therapy
- 9.1.3. Immunotherapy
- 9.1.4. Hormonal Therapy
- 9.1.5. Other Treatment Types
- 9.2. Market Analysis, Insights and Forecast - by Cancer Type
- 9.2.1. Blood Cancer
- 9.2.2. Breast Cancer
- 9.2.3. Prostate Cancer
- 9.2.4. Gastrointestinal Cancer
- 9.2.5. Gynaecologic Cancer
- 9.2.6. Respiratory/Lung Cancer
- 9.2.7. Other Cancer Types
- 9.3. Market Analysis, Insights and Forecast - by End User
- 9.3.1. Hospitals
- 9.3.2. Specialty Clinics
- 9.3.3. Cancer and Radiation Therapy Centers
- 9.1. Market Analysis, Insights and Forecast - by Therapy Type
- 10. South America Cancer Treatment Industry Analysis, Insights and Forecast, 2019-2031
- 10.1. Market Analysis, Insights and Forecast - by Therapy Type
- 10.1.1. Chemotherapy
- 10.1.2. Targeted Therapy
- 10.1.3. Immunotherapy
- 10.1.4. Hormonal Therapy
- 10.1.5. Other Treatment Types
- 10.2. Market Analysis, Insights and Forecast - by Cancer Type
- 10.2.1. Blood Cancer
- 10.2.2. Breast Cancer
- 10.2.3. Prostate Cancer
- 10.2.4. Gastrointestinal Cancer
- 10.2.5. Gynaecologic Cancer
- 10.2.6. Respiratory/Lung Cancer
- 10.2.7. Other Cancer Types
- 10.3. Market Analysis, Insights and Forecast - by End User
- 10.3.1. Hospitals
- 10.3.2. Specialty Clinics
- 10.3.3. Cancer and Radiation Therapy Centers
- 10.1. Market Analysis, Insights and Forecast - by Therapy Type
- 11. North America Cancer Treatment Industry Analysis, Insights and Forecast, 2019-2031
- 11.1. Market Analysis, Insights and Forecast - By Country/Sub-region
- 11.1.1 United States
- 11.1.2 Canada
- 11.1.3 Mexico
- 12. Europe Cancer Treatment Industry Analysis, Insights and Forecast, 2019-2031
- 12.1. Market Analysis, Insights and Forecast - By Country/Sub-region
- 12.1.1 Germany
- 12.1.2 United Kingdom
- 12.1.3 France
- 12.1.4 Italy
- 12.1.5 Spain
- 12.1.6 Rest of Europe
- 13. Asia Pacific Cancer Treatment Industry Analysis, Insights and Forecast, 2019-2031
- 13.1. Market Analysis, Insights and Forecast - By Country/Sub-region
- 13.1.1 China
- 13.1.2 Japan
- 13.1.3 India
- 13.1.4 Australia
- 13.1.5 South Korea
- 13.1.6 Rest of Asia Pacific
- 14. Middle East and Africa Cancer Treatment Industry Analysis, Insights and Forecast, 2019-2031
- 14.1. Market Analysis, Insights and Forecast - By Country/Sub-region
- 14.1.1 GCC
- 14.1.2 South Africa
- 14.1.3 Rest of Middle East and Africa
- 15. South America Cancer Treatment Industry Analysis, Insights and Forecast, 2019-2031
- 15.1. Market Analysis, Insights and Forecast - By Country/Sub-region
- 15.1.1 Brazil
- 15.1.2 Argentina
- 15.1.3 Rest of South America
- 16. Competitive Analysis
- 16.1. Global Market Share Analysis 2024
- 16.2. Company Profiles
- 16.2.1 F Hoffmann-La Roche AG
- 16.2.1.1. Overview
- 16.2.1.2. Products
- 16.2.1.3. SWOT Analysis
- 16.2.1.4. Recent Developments
- 16.2.1.5. Financials (Based on Availability)
- 16.2.2 Celldex Therapeutics Inc
- 16.2.2.1. Overview
- 16.2.2.2. Products
- 16.2.2.3. SWOT Analysis
- 16.2.2.4. Recent Developments
- 16.2.2.5. Financials (Based on Availability)
- 16.2.3 Gilead Sciences Inc (Kite Pharma)
- 16.2.3.1. Overview
- 16.2.3.2. Products
- 16.2.3.3. SWOT Analysis
- 16.2.3.4. Recent Developments
- 16.2.3.5. Financials (Based on Availability)
- 16.2.4 Bayer AG
- 16.2.4.1. Overview
- 16.2.4.2. Products
- 16.2.4.3. SWOT Analysis
- 16.2.4.4. Recent Developments
- 16.2.4.5. Financials (Based on Availability)
- 16.2.5 Astellas Pharma Inc
- 16.2.5.1. Overview
- 16.2.5.2. Products
- 16.2.5.3. SWOT Analysis
- 16.2.5.4. Recent Developments
- 16.2.5.5. Financials (Based on Availability)
- 16.2.6 Novartis AG
- 16.2.6.1. Overview
- 16.2.6.2. Products
- 16.2.6.3. SWOT Analysis
- 16.2.6.4. Recent Developments
- 16.2.6.5. Financials (Based on Availability)
- 16.2.7 Amgen Inc
- 16.2.7.1. Overview
- 16.2.7.2. Products
- 16.2.7.3. SWOT Analysis
- 16.2.7.4. Recent Developments
- 16.2.7.5. Financials (Based on Availability)
- 16.2.8 Merck & Co Inc
- 16.2.8.1. Overview
- 16.2.8.2. Products
- 16.2.8.3. SWOT Analysis
- 16.2.8.4. Recent Developments
- 16.2.8.5. Financials (Based on Availability)
- 16.2.9 Takeda Pharmaceutical Company Limited
- 16.2.9.1. Overview
- 16.2.9.2. Products
- 16.2.9.3. SWOT Analysis
- 16.2.9.4. Recent Developments
- 16.2.9.5. Financials (Based on Availability)
- 16.2.10 AstraZeneca
- 16.2.10.1. Overview
- 16.2.10.2. Products
- 16.2.10.3. SWOT Analysis
- 16.2.10.4. Recent Developments
- 16.2.10.5. Financials (Based on Availability)
- 16.2.11 Abbvie Inc
- 16.2.11.1. Overview
- 16.2.11.2. Products
- 16.2.11.3. SWOT Analysis
- 16.2.11.4. Recent Developments
- 16.2.11.5. Financials (Based on Availability)
- 16.2.12 GSK PLC
- 16.2.12.1. Overview
- 16.2.12.2. Products
- 16.2.12.3. SWOT Analysis
- 16.2.12.4. Recent Developments
- 16.2.12.5. Financials (Based on Availability)
- 16.2.13 Lilly
- 16.2.13.1. Overview
- 16.2.13.2. Products
- 16.2.13.3. SWOT Analysis
- 16.2.13.4. Recent Developments
- 16.2.13.5. Financials (Based on Availability)
- 16.2.14 Bristol Myers Squibb Company
- 16.2.14.1. Overview
- 16.2.14.2. Products
- 16.2.14.3. SWOT Analysis
- 16.2.14.4. Recent Developments
- 16.2.14.5. Financials (Based on Availability)
- 16.2.15 Johnson & Johnson Services Inc
- 16.2.15.1. Overview
- 16.2.15.2. Products
- 16.2.15.3. SWOT Analysis
- 16.2.15.4. Recent Developments
- 16.2.15.5. Financials (Based on Availability)
- 16.2.16 Alaunos Therapeutics Inc
- 16.2.16.1. Overview
- 16.2.16.2. Products
- 16.2.16.3. SWOT Analysis
- 16.2.16.4. Recent Developments
- 16.2.16.5. Financials (Based on Availability)
- 16.2.17 Pfizer Inc
- 16.2.17.1. Overview
- 16.2.17.2. Products
- 16.2.17.3. SWOT Analysis
- 16.2.17.4. Recent Developments
- 16.2.17.5. Financials (Based on Availability)
- 16.2.1 F Hoffmann-La Roche AG
List of Figures
- Figure 1: Global Cancer Treatment Industry Revenue Breakdown (Million, %) by Region 2024 & 2032
- Figure 2: Global Cancer Treatment Industry Volume Breakdown (K Unit, %) by Region 2024 & 2032
- Figure 3: North America Cancer Treatment Industry Revenue (Million), by Country 2024 & 2032
- Figure 4: North America Cancer Treatment Industry Volume (K Unit), by Country 2024 & 2032
- Figure 5: North America Cancer Treatment Industry Revenue Share (%), by Country 2024 & 2032
- Figure 6: North America Cancer Treatment Industry Volume Share (%), by Country 2024 & 2032
- Figure 7: Europe Cancer Treatment Industry Revenue (Million), by Country 2024 & 2032
- Figure 8: Europe Cancer Treatment Industry Volume (K Unit), by Country 2024 & 2032
- Figure 9: Europe Cancer Treatment Industry Revenue Share (%), by Country 2024 & 2032
- Figure 10: Europe Cancer Treatment Industry Volume Share (%), by Country 2024 & 2032
- Figure 11: Asia Pacific Cancer Treatment Industry Revenue (Million), by Country 2024 & 2032
- Figure 12: Asia Pacific Cancer Treatment Industry Volume (K Unit), by Country 2024 & 2032
- Figure 13: Asia Pacific Cancer Treatment Industry Revenue Share (%), by Country 2024 & 2032
- Figure 14: Asia Pacific Cancer Treatment Industry Volume Share (%), by Country 2024 & 2032
- Figure 15: Middle East and Africa Cancer Treatment Industry Revenue (Million), by Country 2024 & 2032
- Figure 16: Middle East and Africa Cancer Treatment Industry Volume (K Unit), by Country 2024 & 2032
- Figure 17: Middle East and Africa Cancer Treatment Industry Revenue Share (%), by Country 2024 & 2032
- Figure 18: Middle East and Africa Cancer Treatment Industry Volume Share (%), by Country 2024 & 2032
- Figure 19: South America Cancer Treatment Industry Revenue (Million), by Country 2024 & 2032
- Figure 20: South America Cancer Treatment Industry Volume (K Unit), by Country 2024 & 2032
- Figure 21: South America Cancer Treatment Industry Revenue Share (%), by Country 2024 & 2032
- Figure 22: South America Cancer Treatment Industry Volume Share (%), by Country 2024 & 2032
- Figure 23: North America Cancer Treatment Industry Revenue (Million), by Therapy Type 2024 & 2032
- Figure 24: North America Cancer Treatment Industry Volume (K Unit), by Therapy Type 2024 & 2032
- Figure 25: North America Cancer Treatment Industry Revenue Share (%), by Therapy Type 2024 & 2032
- Figure 26: North America Cancer Treatment Industry Volume Share (%), by Therapy Type 2024 & 2032
- Figure 27: North America Cancer Treatment Industry Revenue (Million), by Cancer Type 2024 & 2032
- Figure 28: North America Cancer Treatment Industry Volume (K Unit), by Cancer Type 2024 & 2032
- Figure 29: North America Cancer Treatment Industry Revenue Share (%), by Cancer Type 2024 & 2032
- Figure 30: North America Cancer Treatment Industry Volume Share (%), by Cancer Type 2024 & 2032
- Figure 31: North America Cancer Treatment Industry Revenue (Million), by End User 2024 & 2032
- Figure 32: North America Cancer Treatment Industry Volume (K Unit), by End User 2024 & 2032
- Figure 33: North America Cancer Treatment Industry Revenue Share (%), by End User 2024 & 2032
- Figure 34: North America Cancer Treatment Industry Volume Share (%), by End User 2024 & 2032
- Figure 35: North America Cancer Treatment Industry Revenue (Million), by Country 2024 & 2032
- Figure 36: North America Cancer Treatment Industry Volume (K Unit), by Country 2024 & 2032
- Figure 37: North America Cancer Treatment Industry Revenue Share (%), by Country 2024 & 2032
- Figure 38: North America Cancer Treatment Industry Volume Share (%), by Country 2024 & 2032
- Figure 39: Europe Cancer Treatment Industry Revenue (Million), by Therapy Type 2024 & 2032
- Figure 40: Europe Cancer Treatment Industry Volume (K Unit), by Therapy Type 2024 & 2032
- Figure 41: Europe Cancer Treatment Industry Revenue Share (%), by Therapy Type 2024 & 2032
- Figure 42: Europe Cancer Treatment Industry Volume Share (%), by Therapy Type 2024 & 2032
- Figure 43: Europe Cancer Treatment Industry Revenue (Million), by Cancer Type 2024 & 2032
- Figure 44: Europe Cancer Treatment Industry Volume (K Unit), by Cancer Type 2024 & 2032
- Figure 45: Europe Cancer Treatment Industry Revenue Share (%), by Cancer Type 2024 & 2032
- Figure 46: Europe Cancer Treatment Industry Volume Share (%), by Cancer Type 2024 & 2032
- Figure 47: Europe Cancer Treatment Industry Revenue (Million), by End User 2024 & 2032
- Figure 48: Europe Cancer Treatment Industry Volume (K Unit), by End User 2024 & 2032
- Figure 49: Europe Cancer Treatment Industry Revenue Share (%), by End User 2024 & 2032
- Figure 50: Europe Cancer Treatment Industry Volume Share (%), by End User 2024 & 2032
- Figure 51: Europe Cancer Treatment Industry Revenue (Million), by Country 2024 & 2032
- Figure 52: Europe Cancer Treatment Industry Volume (K Unit), by Country 2024 & 2032
- Figure 53: Europe Cancer Treatment Industry Revenue Share (%), by Country 2024 & 2032
- Figure 54: Europe Cancer Treatment Industry Volume Share (%), by Country 2024 & 2032
- Figure 55: Asia Pacific Cancer Treatment Industry Revenue (Million), by Therapy Type 2024 & 2032
- Figure 56: Asia Pacific Cancer Treatment Industry Volume (K Unit), by Therapy Type 2024 & 2032
- Figure 57: Asia Pacific Cancer Treatment Industry Revenue Share (%), by Therapy Type 2024 & 2032
- Figure 58: Asia Pacific Cancer Treatment Industry Volume Share (%), by Therapy Type 2024 & 2032
- Figure 59: Asia Pacific Cancer Treatment Industry Revenue (Million), by Cancer Type 2024 & 2032
- Figure 60: Asia Pacific Cancer Treatment Industry Volume (K Unit), by Cancer Type 2024 & 2032
- Figure 61: Asia Pacific Cancer Treatment Industry Revenue Share (%), by Cancer Type 2024 & 2032
- Figure 62: Asia Pacific Cancer Treatment Industry Volume Share (%), by Cancer Type 2024 & 2032
- Figure 63: Asia Pacific Cancer Treatment Industry Revenue (Million), by End User 2024 & 2032
- Figure 64: Asia Pacific Cancer Treatment Industry Volume (K Unit), by End User 2024 & 2032
- Figure 65: Asia Pacific Cancer Treatment Industry Revenue Share (%), by End User 2024 & 2032
- Figure 66: Asia Pacific Cancer Treatment Industry Volume Share (%), by End User 2024 & 2032
- Figure 67: Asia Pacific Cancer Treatment Industry Revenue (Million), by Country 2024 & 2032
- Figure 68: Asia Pacific Cancer Treatment Industry Volume (K Unit), by Country 2024 & 2032
- Figure 69: Asia Pacific Cancer Treatment Industry Revenue Share (%), by Country 2024 & 2032
- Figure 70: Asia Pacific Cancer Treatment Industry Volume Share (%), by Country 2024 & 2032
- Figure 71: Middle East and Africa Cancer Treatment Industry Revenue (Million), by Therapy Type 2024 & 2032
- Figure 72: Middle East and Africa Cancer Treatment Industry Volume (K Unit), by Therapy Type 2024 & 2032
- Figure 73: Middle East and Africa Cancer Treatment Industry Revenue Share (%), by Therapy Type 2024 & 2032
- Figure 74: Middle East and Africa Cancer Treatment Industry Volume Share (%), by Therapy Type 2024 & 2032
- Figure 75: Middle East and Africa Cancer Treatment Industry Revenue (Million), by Cancer Type 2024 & 2032
- Figure 76: Middle East and Africa Cancer Treatment Industry Volume (K Unit), by Cancer Type 2024 & 2032
- Figure 77: Middle East and Africa Cancer Treatment Industry Revenue Share (%), by Cancer Type 2024 & 2032
- Figure 78: Middle East and Africa Cancer Treatment Industry Volume Share (%), by Cancer Type 2024 & 2032
- Figure 79: Middle East and Africa Cancer Treatment Industry Revenue (Million), by End User 2024 & 2032
- Figure 80: Middle East and Africa Cancer Treatment Industry Volume (K Unit), by End User 2024 & 2032
- Figure 81: Middle East and Africa Cancer Treatment Industry Revenue Share (%), by End User 2024 & 2032
- Figure 82: Middle East and Africa Cancer Treatment Industry Volume Share (%), by End User 2024 & 2032
- Figure 83: Middle East and Africa Cancer Treatment Industry Revenue (Million), by Country 2024 & 2032
- Figure 84: Middle East and Africa Cancer Treatment Industry Volume (K Unit), by Country 2024 & 2032
- Figure 85: Middle East and Africa Cancer Treatment Industry Revenue Share (%), by Country 2024 & 2032
- Figure 86: Middle East and Africa Cancer Treatment Industry Volume Share (%), by Country 2024 & 2032
- Figure 87: South America Cancer Treatment Industry Revenue (Million), by Therapy Type 2024 & 2032
- Figure 88: South America Cancer Treatment Industry Volume (K Unit), by Therapy Type 2024 & 2032
- Figure 89: South America Cancer Treatment Industry Revenue Share (%), by Therapy Type 2024 & 2032
- Figure 90: South America Cancer Treatment Industry Volume Share (%), by Therapy Type 2024 & 2032
- Figure 91: South America Cancer Treatment Industry Revenue (Million), by Cancer Type 2024 & 2032
- Figure 92: South America Cancer Treatment Industry Volume (K Unit), by Cancer Type 2024 & 2032
- Figure 93: South America Cancer Treatment Industry Revenue Share (%), by Cancer Type 2024 & 2032
- Figure 94: South America Cancer Treatment Industry Volume Share (%), by Cancer Type 2024 & 2032
- Figure 95: South America Cancer Treatment Industry Revenue (Million), by End User 2024 & 2032
- Figure 96: South America Cancer Treatment Industry Volume (K Unit), by End User 2024 & 2032
- Figure 97: South America Cancer Treatment Industry Revenue Share (%), by End User 2024 & 2032
- Figure 98: South America Cancer Treatment Industry Volume Share (%), by End User 2024 & 2032
- Figure 99: South America Cancer Treatment Industry Revenue (Million), by Country 2024 & 2032
- Figure 100: South America Cancer Treatment Industry Volume (K Unit), by Country 2024 & 2032
- Figure 101: South America Cancer Treatment Industry Revenue Share (%), by Country 2024 & 2032
- Figure 102: South America Cancer Treatment Industry Volume Share (%), by Country 2024 & 2032
List of Tables
- Table 1: Global Cancer Treatment Industry Revenue Million Forecast, by Region 2019 & 2032
- Table 2: Global Cancer Treatment Industry Volume K Unit Forecast, by Region 2019 & 2032
- Table 3: Global Cancer Treatment Industry Revenue Million Forecast, by Therapy Type 2019 & 2032
- Table 4: Global Cancer Treatment Industry Volume K Unit Forecast, by Therapy Type 2019 & 2032
- Table 5: Global Cancer Treatment Industry Revenue Million Forecast, by Cancer Type 2019 & 2032
- Table 6: Global Cancer Treatment Industry Volume K Unit Forecast, by Cancer Type 2019 & 2032
- Table 7: Global Cancer Treatment Industry Revenue Million Forecast, by End User 2019 & 2032
- Table 8: Global Cancer Treatment Industry Volume K Unit Forecast, by End User 2019 & 2032
- Table 9: Global Cancer Treatment Industry Revenue Million Forecast, by Region 2019 & 2032
- Table 10: Global Cancer Treatment Industry Volume K Unit Forecast, by Region 2019 & 2032
- Table 11: Global Cancer Treatment Industry Revenue Million Forecast, by Country 2019 & 2032
- Table 12: Global Cancer Treatment Industry Volume K Unit Forecast, by Country 2019 & 2032
- Table 13: United States Cancer Treatment Industry Revenue (Million) Forecast, by Application 2019 & 2032
- Table 14: United States Cancer Treatment Industry Volume (K Unit) Forecast, by Application 2019 & 2032
- Table 15: Canada Cancer Treatment Industry Revenue (Million) Forecast, by Application 2019 & 2032
- Table 16: Canada Cancer Treatment Industry Volume (K Unit) Forecast, by Application 2019 & 2032
- Table 17: Mexico Cancer Treatment Industry Revenue (Million) Forecast, by Application 2019 & 2032
- Table 18: Mexico Cancer Treatment Industry Volume (K Unit) Forecast, by Application 2019 & 2032
- Table 19: Global Cancer Treatment Industry Revenue Million Forecast, by Country 2019 & 2032
- Table 20: Global Cancer Treatment Industry Volume K Unit Forecast, by Country 2019 & 2032
- Table 21: Germany Cancer Treatment Industry Revenue (Million) Forecast, by Application 2019 & 2032
- Table 22: Germany Cancer Treatment Industry Volume (K Unit) Forecast, by Application 2019 & 2032
- Table 23: United Kingdom Cancer Treatment Industry Revenue (Million) Forecast, by Application 2019 & 2032
- Table 24: United Kingdom Cancer Treatment Industry Volume (K Unit) Forecast, by Application 2019 & 2032
- Table 25: France Cancer Treatment Industry Revenue (Million) Forecast, by Application 2019 & 2032
- Table 26: France Cancer Treatment Industry Volume (K Unit) Forecast, by Application 2019 & 2032
- Table 27: Italy Cancer Treatment Industry Revenue (Million) Forecast, by Application 2019 & 2032
- Table 28: Italy Cancer Treatment Industry Volume (K Unit) Forecast, by Application 2019 & 2032
- Table 29: Spain Cancer Treatment Industry Revenue (Million) Forecast, by Application 2019 & 2032
- Table 30: Spain Cancer Treatment Industry Volume (K Unit) Forecast, by Application 2019 & 2032
- Table 31: Rest of Europe Cancer Treatment Industry Revenue (Million) Forecast, by Application 2019 & 2032
- Table 32: Rest of Europe Cancer Treatment Industry Volume (K Unit) Forecast, by Application 2019 & 2032
- Table 33: Global Cancer Treatment Industry Revenue Million Forecast, by Country 2019 & 2032
- Table 34: Global Cancer Treatment Industry Volume K Unit Forecast, by Country 2019 & 2032
- Table 35: China Cancer Treatment Industry Revenue (Million) Forecast, by Application 2019 & 2032
- Table 36: China Cancer Treatment Industry Volume (K Unit) Forecast, by Application 2019 & 2032
- Table 37: Japan Cancer Treatment Industry Revenue (Million) Forecast, by Application 2019 & 2032
- Table 38: Japan Cancer Treatment Industry Volume (K Unit) Forecast, by Application 2019 & 2032
- Table 39: India Cancer Treatment Industry Revenue (Million) Forecast, by Application 2019 & 2032
- Table 40: India Cancer Treatment Industry Volume (K Unit) Forecast, by Application 2019 & 2032
- Table 41: Australia Cancer Treatment Industry Revenue (Million) Forecast, by Application 2019 & 2032
- Table 42: Australia Cancer Treatment Industry Volume (K Unit) Forecast, by Application 2019 & 2032
- Table 43: South Korea Cancer Treatment Industry Revenue (Million) Forecast, by Application 2019 & 2032
- Table 44: South Korea Cancer Treatment Industry Volume (K Unit) Forecast, by Application 2019 & 2032
- Table 45: Rest of Asia Pacific Cancer Treatment Industry Revenue (Million) Forecast, by Application 2019 & 2032
- Table 46: Rest of Asia Pacific Cancer Treatment Industry Volume (K Unit) Forecast, by Application 2019 & 2032
- Table 47: Global Cancer Treatment Industry Revenue Million Forecast, by Country 2019 & 2032
- Table 48: Global Cancer Treatment Industry Volume K Unit Forecast, by Country 2019 & 2032
- Table 49: GCC Cancer Treatment Industry Revenue (Million) Forecast, by Application 2019 & 2032
- Table 50: GCC Cancer Treatment Industry Volume (K Unit) Forecast, by Application 2019 & 2032
- Table 51: South Africa Cancer Treatment Industry Revenue (Million) Forecast, by Application 2019 & 2032
- Table 52: South Africa Cancer Treatment Industry Volume (K Unit) Forecast, by Application 2019 & 2032
- Table 53: Rest of Middle East and Africa Cancer Treatment Industry Revenue (Million) Forecast, by Application 2019 & 2032
- Table 54: Rest of Middle East and Africa Cancer Treatment Industry Volume (K Unit) Forecast, by Application 2019 & 2032
- Table 55: Global Cancer Treatment Industry Revenue Million Forecast, by Country 2019 & 2032
- Table 56: Global Cancer Treatment Industry Volume K Unit Forecast, by Country 2019 & 2032
- Table 57: Brazil Cancer Treatment Industry Revenue (Million) Forecast, by Application 2019 & 2032
- Table 58: Brazil Cancer Treatment Industry Volume (K Unit) Forecast, by Application 2019 & 2032
- Table 59: Argentina Cancer Treatment Industry Revenue (Million) Forecast, by Application 2019 & 2032
- Table 60: Argentina Cancer Treatment Industry Volume (K Unit) Forecast, by Application 2019 & 2032
- Table 61: Rest of South America Cancer Treatment Industry Revenue (Million) Forecast, by Application 2019 & 2032
- Table 62: Rest of South America Cancer Treatment Industry Volume (K Unit) Forecast, by Application 2019 & 2032
- Table 63: Global Cancer Treatment Industry Revenue Million Forecast, by Therapy Type 2019 & 2032
- Table 64: Global Cancer Treatment Industry Volume K Unit Forecast, by Therapy Type 2019 & 2032
- Table 65: Global Cancer Treatment Industry Revenue Million Forecast, by Cancer Type 2019 & 2032
- Table 66: Global Cancer Treatment Industry Volume K Unit Forecast, by Cancer Type 2019 & 2032
- Table 67: Global Cancer Treatment Industry Revenue Million Forecast, by End User 2019 & 2032
- Table 68: Global Cancer Treatment Industry Volume K Unit Forecast, by End User 2019 & 2032
- Table 69: Global Cancer Treatment Industry Revenue Million Forecast, by Country 2019 & 2032
- Table 70: Global Cancer Treatment Industry Volume K Unit Forecast, by Country 2019 & 2032
- Table 71: United States Cancer Treatment Industry Revenue (Million) Forecast, by Application 2019 & 2032
- Table 72: United States Cancer Treatment Industry Volume (K Unit) Forecast, by Application 2019 & 2032
- Table 73: Canada Cancer Treatment Industry Revenue (Million) Forecast, by Application 2019 & 2032
- Table 74: Canada Cancer Treatment Industry Volume (K Unit) Forecast, by Application 2019 & 2032
- Table 75: Mexico Cancer Treatment Industry Revenue (Million) Forecast, by Application 2019 & 2032
- Table 76: Mexico Cancer Treatment Industry Volume (K Unit) Forecast, by Application 2019 & 2032
- Table 77: Global Cancer Treatment Industry Revenue Million Forecast, by Therapy Type 2019 & 2032
- Table 78: Global Cancer Treatment Industry Volume K Unit Forecast, by Therapy Type 2019 & 2032
- Table 79: Global Cancer Treatment Industry Revenue Million Forecast, by Cancer Type 2019 & 2032
- Table 80: Global Cancer Treatment Industry Volume K Unit Forecast, by Cancer Type 2019 & 2032
- Table 81: Global Cancer Treatment Industry Revenue Million Forecast, by End User 2019 & 2032
- Table 82: Global Cancer Treatment Industry Volume K Unit Forecast, by End User 2019 & 2032
- Table 83: Global Cancer Treatment Industry Revenue Million Forecast, by Country 2019 & 2032
- Table 84: Global Cancer Treatment Industry Volume K Unit Forecast, by Country 2019 & 2032
- Table 85: Germany Cancer Treatment Industry Revenue (Million) Forecast, by Application 2019 & 2032
- Table 86: Germany Cancer Treatment Industry Volume (K Unit) Forecast, by Application 2019 & 2032
- Table 87: United Kingdom Cancer Treatment Industry Revenue (Million) Forecast, by Application 2019 & 2032
- Table 88: United Kingdom Cancer Treatment Industry Volume (K Unit) Forecast, by Application 2019 & 2032
- Table 89: France Cancer Treatment Industry Revenue (Million) Forecast, by Application 2019 & 2032
- Table 90: France Cancer Treatment Industry Volume (K Unit) Forecast, by Application 2019 & 2032
- Table 91: Italy Cancer Treatment Industry Revenue (Million) Forecast, by Application 2019 & 2032
- Table 92: Italy Cancer Treatment Industry Volume (K Unit) Forecast, by Application 2019 & 2032
- Table 93: Spain Cancer Treatment Industry Revenue (Million) Forecast, by Application 2019 & 2032
- Table 94: Spain Cancer Treatment Industry Volume (K Unit) Forecast, by Application 2019 & 2032
- Table 95: Rest of Europe Cancer Treatment Industry Revenue (Million) Forecast, by Application 2019 & 2032
- Table 96: Rest of Europe Cancer Treatment Industry Volume (K Unit) Forecast, by Application 2019 & 2032
- Table 97: Global Cancer Treatment Industry Revenue Million Forecast, by Therapy Type 2019 & 2032
- Table 98: Global Cancer Treatment Industry Volume K Unit Forecast, by Therapy Type 2019 & 2032
- Table 99: Global Cancer Treatment Industry Revenue Million Forecast, by Cancer Type 2019 & 2032
- Table 100: Global Cancer Treatment Industry Volume K Unit Forecast, by Cancer Type 2019 & 2032
- Table 101: Global Cancer Treatment Industry Revenue Million Forecast, by End User 2019 & 2032
- Table 102: Global Cancer Treatment Industry Volume K Unit Forecast, by End User 2019 & 2032
- Table 103: Global Cancer Treatment Industry Revenue Million Forecast, by Country 2019 & 2032
- Table 104: Global Cancer Treatment Industry Volume K Unit Forecast, by Country 2019 & 2032
- Table 105: China Cancer Treatment Industry Revenue (Million) Forecast, by Application 2019 & 2032
- Table 106: China Cancer Treatment Industry Volume (K Unit) Forecast, by Application 2019 & 2032
- Table 107: Japan Cancer Treatment Industry Revenue (Million) Forecast, by Application 2019 & 2032
- Table 108: Japan Cancer Treatment Industry Volume (K Unit) Forecast, by Application 2019 & 2032
- Table 109: India Cancer Treatment Industry Revenue (Million) Forecast, by Application 2019 & 2032
- Table 110: India Cancer Treatment Industry Volume (K Unit) Forecast, by Application 2019 & 2032
- Table 111: Australia Cancer Treatment Industry Revenue (Million) Forecast, by Application 2019 & 2032
- Table 112: Australia Cancer Treatment Industry Volume (K Unit) Forecast, by Application 2019 & 2032
- Table 113: South Korea Cancer Treatment Industry Revenue (Million) Forecast, by Application 2019 & 2032
- Table 114: South Korea Cancer Treatment Industry Volume (K Unit) Forecast, by Application 2019 & 2032
- Table 115: Rest of Asia Pacific Cancer Treatment Industry Revenue (Million) Forecast, by Application 2019 & 2032
- Table 116: Rest of Asia Pacific Cancer Treatment Industry Volume (K Unit) Forecast, by Application 2019 & 2032
- Table 117: Global Cancer Treatment Industry Revenue Million Forecast, by Therapy Type 2019 & 2032
- Table 118: Global Cancer Treatment Industry Volume K Unit Forecast, by Therapy Type 2019 & 2032
- Table 119: Global Cancer Treatment Industry Revenue Million Forecast, by Cancer Type 2019 & 2032
- Table 120: Global Cancer Treatment Industry Volume K Unit Forecast, by Cancer Type 2019 & 2032
- Table 121: Global Cancer Treatment Industry Revenue Million Forecast, by End User 2019 & 2032
- Table 122: Global Cancer Treatment Industry Volume K Unit Forecast, by End User 2019 & 2032
- Table 123: Global Cancer Treatment Industry Revenue Million Forecast, by Country 2019 & 2032
- Table 124: Global Cancer Treatment Industry Volume K Unit Forecast, by Country 2019 & 2032
- Table 125: GCC Cancer Treatment Industry Revenue (Million) Forecast, by Application 2019 & 2032
- Table 126: GCC Cancer Treatment Industry Volume (K Unit) Forecast, by Application 2019 & 2032
- Table 127: South Africa Cancer Treatment Industry Revenue (Million) Forecast, by Application 2019 & 2032
- Table 128: South Africa Cancer Treatment Industry Volume (K Unit) Forecast, by Application 2019 & 2032
- Table 129: Rest of Middle East and Africa Cancer Treatment Industry Revenue (Million) Forecast, by Application 2019 & 2032
- Table 130: Rest of Middle East and Africa Cancer Treatment Industry Volume (K Unit) Forecast, by Application 2019 & 2032
- Table 131: Global Cancer Treatment Industry Revenue Million Forecast, by Therapy Type 2019 & 2032
- Table 132: Global Cancer Treatment Industry Volume K Unit Forecast, by Therapy Type 2019 & 2032
- Table 133: Global Cancer Treatment Industry Revenue Million Forecast, by Cancer Type 2019 & 2032
- Table 134: Global Cancer Treatment Industry Volume K Unit Forecast, by Cancer Type 2019 & 2032
- Table 135: Global Cancer Treatment Industry Revenue Million Forecast, by End User 2019 & 2032
- Table 136: Global Cancer Treatment Industry Volume K Unit Forecast, by End User 2019 & 2032
- Table 137: Global Cancer Treatment Industry Revenue Million Forecast, by Country 2019 & 2032
- Table 138: Global Cancer Treatment Industry Volume K Unit Forecast, by Country 2019 & 2032
- Table 139: Brazil Cancer Treatment Industry Revenue (Million) Forecast, by Application 2019 & 2032
- Table 140: Brazil Cancer Treatment Industry Volume (K Unit) Forecast, by Application 2019 & 2032
- Table 141: Argentina Cancer Treatment Industry Revenue (Million) Forecast, by Application 2019 & 2032
- Table 142: Argentina Cancer Treatment Industry Volume (K Unit) Forecast, by Application 2019 & 2032
- Table 143: Rest of South America Cancer Treatment Industry Revenue (Million) Forecast, by Application 2019 & 2032
- Table 144: Rest of South America Cancer Treatment Industry Volume (K Unit) Forecast, by Application 2019 & 2032
Frequently Asked Questions
1. What is the projected Compound Annual Growth Rate (CAGR) of the Cancer Treatment Industry?
The projected CAGR is approximately 10.64%.
2. Which companies are prominent players in the Cancer Treatment Industry?
Key companies in the market include F Hoffmann-La Roche AG, Celldex Therapeutics Inc , Gilead Sciences Inc (Kite Pharma), Bayer AG, Astellas Pharma Inc, Novartis AG, Amgen Inc, Merck & Co Inc, Takeda Pharmaceutical Company Limited, AstraZeneca, Abbvie Inc, GSK PLC, Lilly, Bristol Myers Squibb Company, Johnson & Johnson Services Inc, Alaunos Therapeutics Inc, Pfizer Inc.
3. What are the main segments of the Cancer Treatment Industry?
The market segments include Therapy Type, Cancer Type, End User.
4. Can you provide details about the market size?
The market size is estimated to be USD 220.24 Million as of 2022.
5. What are some drivers contributing to market growth?
Increasing Patient Assistance Programs (PAPs) and Rising Demand for Personalized Medicine; Growing Government Initiatives for Cancer Awareness; Rising Prevalence of Cancer Worldwide; Strong R&D Initiatives from Key Players.
6. What are the notable trends driving market growth?
The Targeted Therapy Segment is Expected to Witness Significant Growth during the the Forecast Period.
7. Are there any restraints impacting market growth?
Fluctuation in Reimbursement Policies; High Cost of Cancer Therapies.
8. Can you provide examples of recent developments in the market?
In May 2023, Genmab A/S received USFDA approval for its T-cell engaging bispecific antibody, EPKINLY (epcoritamab-bysp), which was intended for the treatment of relapsed or refractory (R/R) diffuse large B-cell lymphoma (DLBCL) in adult patients.
9. What pricing options are available for accessing the report?
Pricing options include single-user, multi-user, and enterprise licenses priced at USD 4750, USD 5250, and USD 8750 respectively.
10. Is the market size provided in terms of value or volume?
The market size is provided in terms of value, measured in Million and volume, measured in K Unit.
11. Are there any specific market keywords associated with the report?
Yes, the market keyword associated with the report is "Cancer Treatment Industry," which aids in identifying and referencing the specific market segment covered.
12. How do I determine which pricing option suits my needs best?
The pricing options vary based on user requirements and access needs. Individual users may opt for single-user licenses, while businesses requiring broader access may choose multi-user or enterprise licenses for cost-effective access to the report.
13. Are there any additional resources or data provided in the Cancer Treatment Industry report?
While the report offers comprehensive insights, it's advisable to review the specific contents or supplementary materials provided to ascertain if additional resources or data are available.
14. How can I stay updated on further developments or reports in the Cancer Treatment Industry?
To stay informed about further developments, trends, and reports in the Cancer Treatment Industry, consider subscribing to industry newsletters, following relevant companies and organizations, or regularly checking reputable industry news sources and publications.
Methodology
Step 1 - Identification of Relevant Samples Size from Population Database


Step 2 - Approaches for Defining Global Market Size (Value, Volume* & Price*)

Note*: In applicable scenarios
Step 3 - Data Sources
Primary Research
- Web Analytics
- Survey Reports
- Research Institute
- Latest Research Reports
- Opinion Leaders
Secondary Research
- Annual Reports
- White Paper
- Latest Press Release
- Industry Association
- Paid Database
- Investor Presentations

Step 4 - Data Triangulation
Involves using different sources of information in order to increase the validity of a study
These sources are likely to be stakeholders in a program - participants, other researchers, program staff, other community members, and so on.
Then we put all data in single framework & apply various statistical tools to find out the dynamic on the market.
During the analysis stage, feedback from the stakeholder groups would be compared to determine areas of agreement as well as areas of divergence


