
Key Insights
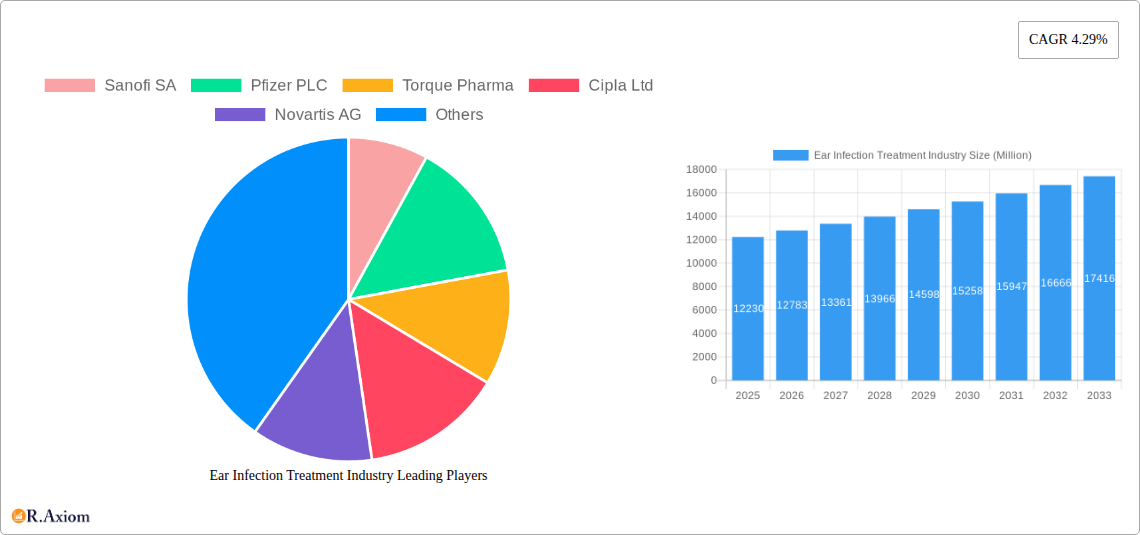
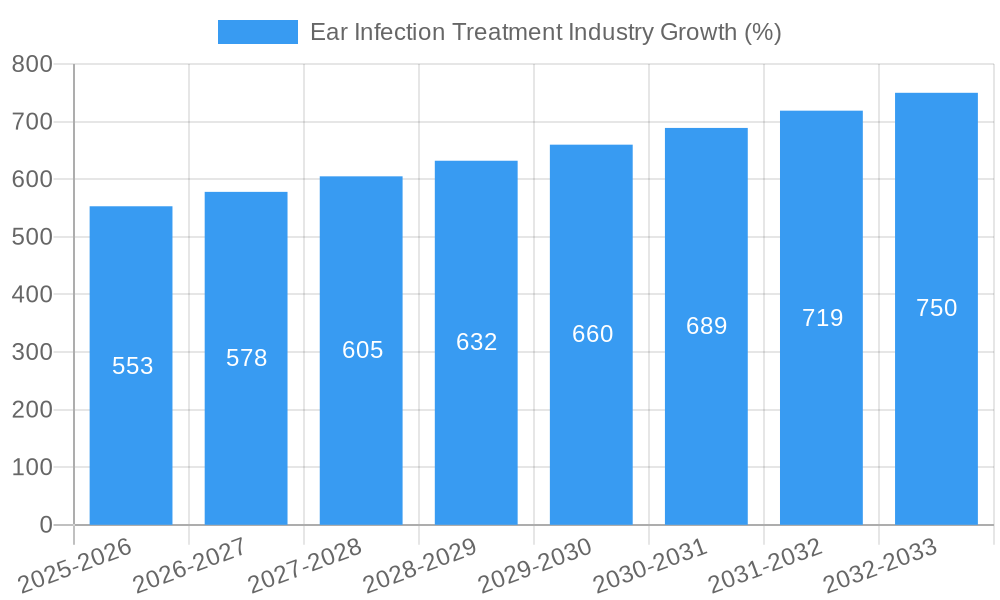
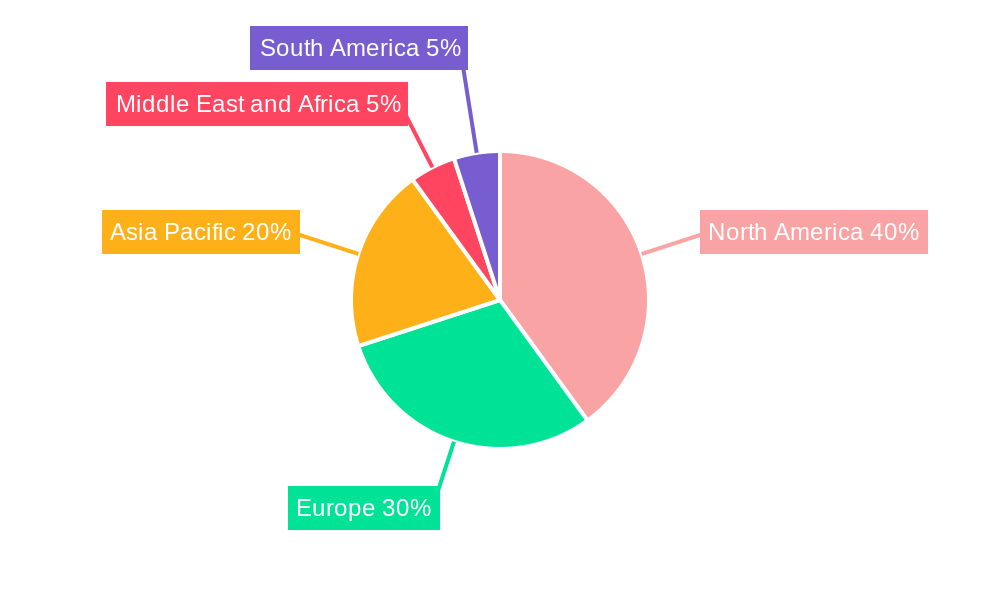
The global ear infection treatment market, valued at $12.23 billion in 2025, is projected to experience robust growth, driven by rising prevalence of ear infections, particularly among children, and an aging population susceptible to chronic otitis media. The market's Compound Annual Growth Rate (CAGR) of 4.29% from 2019-2024 suggests continued expansion through 2033. Key drivers include increased awareness of ear infection symptoms and improved diagnostic capabilities, leading to earlier intervention and treatment. The market is segmented by infection cause (viral, bacterial), treatment type (medication, surgery), and infection location (inner, middle, outer ear). The availability of advanced treatments like targeted antibiotics and minimally invasive surgical procedures contributes significantly to market growth. However, factors such as the development of antibiotic resistance and the high cost of certain therapies, particularly advanced surgical interventions, present challenges to market expansion. Competition among major pharmaceutical and medical device companies, including Sanofi SA, Pfizer PLC, and Johnson & Johnson, is intense, with ongoing research and development efforts focused on innovative treatment modalities. Geographic variations in healthcare infrastructure and access to quality healthcare also impact market growth, with North America and Europe expected to maintain significant market share due to higher healthcare expenditure and advanced medical technology. The Asia-Pacific region is expected to witness substantial growth, fueled by rising disposable incomes and improved healthcare access.
The forecast period (2025-2033) anticipates continued market expansion, primarily driven by advancements in diagnostics and therapeutics. Emerging markets, particularly in developing economies, offer significant untapped potential. Growth strategies for market participants will likely focus on developing novel therapeutics, improving access to treatment in underserved regions, and addressing the challenge of antibiotic resistance. The continued rise in chronic ear infections associated with aging populations will contribute substantially to long-term market growth. However, maintaining affordable access to effective treatments will be crucial for ensuring sustainable market expansion and positive health outcomes globally.
This comprehensive report provides an in-depth analysis of the Ear Infection Treatment industry, covering market size, segmentation, growth drivers, challenges, competitive landscape, and future outlook. The study period spans from 2019 to 2033, with 2025 serving as the base and estimated year. The forecast period is 2025-2033, and the historical period is 2019-2024. The report analyzes key players such as Sanofi SA, Pfizer PLC, Torque Pharma, Cipla Ltd, Novartis AG, Grace Medical, Medtronic PLC, GSK plc, Otonomy Inc, Johnson & Johnson, Olympus Corporation, and American Diagnostic Corporation, across segments categorized by cause (Viral Infection, Bacterial Infection), type (Medication, Surgery), and infection type (Inner Ear Infection, Middle Ear Infection, Outer Ear Infection). The report projects a market value exceeding xx Million by 2033.
Ear Infection Treatment Industry Market Concentration & Innovation
The Ear Infection Treatment market exhibits a moderately concentrated landscape, with a few major players holding significant market share. Sanofi SA, Pfizer PLC, and Johnson & Johnson are among the dominant companies, accounting for an estimated xx% of the global market in 2025. Market share dynamics are influenced by factors including R&D investments, product innovation, and strategic partnerships. The industry is characterized by continuous innovation driven by the need for more effective and less invasive treatments. Regulatory frameworks, particularly those concerning drug approvals and safety standards, play a crucial role in shaping market dynamics. The availability of substitute treatments, including homeopathic remedies and traditional medicine, presents a degree of competitive pressure. End-user trends, such as increased awareness of ear infection symptoms and the growing preference for minimally invasive procedures, are impacting market growth. M&A activities have been moderate in recent years, with deal values ranging from xx Million to xx Million. Significant M&A transactions have focused on expanding product portfolios and geographic reach. Future innovation will likely focus on targeted therapies, personalized medicine, and the development of novel drug delivery systems.
Ear Infection Treatment Industry Industry Trends & Insights
The global Ear Infection Treatment market is experiencing steady growth, driven by factors such as rising prevalence of ear infections, increasing healthcare expenditure, and technological advancements in diagnosis and treatment. The market is projected to register a CAGR of xx% during the forecast period (2025-2033). Market penetration of advanced diagnostic tools and minimally invasive surgical techniques is on the rise. Consumer preferences are shifting towards less invasive, faster recovery treatments. Technological disruptions are evident in the emergence of novel diagnostic techniques and the development of targeted therapies. Competitive dynamics are intense, with companies striving for market leadership through product differentiation, strategic partnerships, and geographic expansion. The increasing adoption of telemedicine and remote patient monitoring is expected to further contribute to market growth. However, pricing pressure and the rising cost of healthcare remain significant challenges.
Dominant Markets & Segments in Ear Infection Treatment Industry
The North American region dominates the Ear Infection Treatment market, driven by factors such as high healthcare expenditure, advanced healthcare infrastructure, and increased prevalence of ear infections. Within this region, the United States holds the largest market share.
Key Drivers in North America:
- High healthcare expenditure per capita
- Well-developed healthcare infrastructure
- Advanced diagnostic and treatment facilities
- High prevalence of ear infections among children and adults
Market Dominance Analysis: The dominance of North America is primarily due to factors outlined above. Other developed regions, such as Europe and Japan, also exhibit substantial market size but at a lower growth rate compared to developing regions. Developing markets in Asia and Latin America are demonstrating accelerated growth due to rising disposable incomes, expanding healthcare infrastructure, and increasing awareness of ear infection treatments.
Segment Analysis: The Middle Ear Infection segment holds the largest market share, followed by Outer Ear Infection and Inner Ear Infection. Within treatment types, medication currently dominates, with anticipated growth in minimally invasive surgical procedures due to increasing technological advancements. Bacterial infections account for a larger market share compared to viral infections, but both segments are witnessing significant growth.
Ear Infection Treatment Industry Product Developments
Recent product innovations focus on improved drug delivery systems for more targeted and effective treatment of ear infections. New diagnostic tools are improving the accuracy and speed of diagnosis, leading to timely treatment interventions. The development of minimally invasive surgical techniques, combined with advanced imaging technologies, are enabling faster recovery times and reducing patient discomfort. The focus is on delivering products that are safer, more efficient, and more readily accessible to patients across diverse geographic locations and healthcare settings.
Report Scope & Segmentation Analysis
This report segments the Ear Infection Treatment market based on cause (Viral Infection, Bacterial Infection), type (Medication, Surgery), and infection type (Inner Ear Infection, Middle Ear Infection, Outer Ear Infection). Each segment is analyzed comprehensively with projections for market size, growth rate, and competitive dynamics. For example, the medication segment is experiencing steady growth due to the prevalence of bacterial ear infections. The surgical segment, while smaller, is anticipated to grow due to innovations in minimally invasive procedures. The Middle Ear Infection segment is the largest due to its high prevalence. Market sizes for each segment are estimated at xx Million in 2025, with varying growth rates projected over the forecast period.
Key Drivers of Ear Infection Treatment Industry Growth
The Ear Infection Treatment market is fueled by several key factors: the rising prevalence of ear infections globally, particularly among children; advancements in diagnostic and treatment technologies, such as improved antibiotics and minimally invasive surgical techniques; increasing healthcare expenditure and insurance coverage; and growing awareness and education about ear infections among the general population. Regulatory approvals of new drugs and medical devices are also a major contributing factor.
Challenges in the Ear Infection Treatment Industry Sector
Significant challenges include the rising antibiotic resistance, leading to treatment inefficiencies and the need for alternative treatment options. The high cost of advanced diagnostic tools and surgical procedures can limit accessibility in lower-income countries. Regulatory hurdles and stringent approval processes can delay the launch of new products. Supply chain disruptions can lead to shortages of critical medicines and medical devices. Intense competition among existing players and the emergence of new players also presents a challenge for market penetration and growth.
Emerging Opportunities in Ear Infection Treatment Industry
The development of novel antibiotics and antiviral agents that are effective against resistant strains is a significant opportunity. The expansion of telemedicine and remote patient monitoring offers opportunities for improved access to care, particularly in underserved areas. Personalized medicine approaches, focusing on tailored treatments based on individual patient characteristics, are emerging as promising avenues. The development of point-of-care diagnostics for rapid and accurate diagnosis holds significant promise.
Leading Players in the Ear Infection Treatment Industry Market
- Sanofi SA
- Pfizer PLC
- Torque Pharma
- Cipla Ltd
- Novartis AG
- Grace Medical
- Medtronic PLC
- GSK plc
- Otonomy Inc
- Johnson & Johnson
- Olympus Corporation
- American Diagnostic Corporation
Key Developments in Ear Infection Treatment Industry Industry
November 2022: The Denver Health and Hospital Authority launched the "RELAX" clinical trial to evaluate shorter antibiotic durations for children with acute otitis media (AOM). This highlights a shift towards more judicious antibiotic use and potentially reducing antibiotic resistance.
June 2021: Olympus Australia's partnership with InterMed Medical enhanced the distribution of ENT products in Australia and New Zealand, increasing market reach and potentially accelerating product adoption in these regions.
Strategic Outlook for Ear Infection Treatment Industry Market
The Ear Infection Treatment market is poised for continued growth, driven by technological advancements, the increasing prevalence of ear infections, and growing healthcare expenditure. Future market potential lies in the development of innovative treatments that address antibiotic resistance, improved diagnostic tools for earlier and more accurate diagnosis, and increased access to care in underserved areas. Companies focusing on research and development of novel therapies and adopting strategic partnerships will be best positioned to capitalize on emerging opportunities.
Ear Infection Treatment Industry Segmentation
-
1. Infection
- 1.1. Inner Ear Infection
- 1.2. Middle Ear Infection
- 1.3. Outer Ear Infection
-
2. Cause
- 2.1. Viral Infection
- 2.2. Bacterial Infection
-
3. Type
-
3.1. Medication
- 3.1.1. Antibiotics
- 3.1.2. Analgesics
- 3.1.3. AntiViral
- 3.2. Surgery
-
3.1. Medication
Ear Infection Treatment Industry Segmentation By Geography
-
1. North America
- 1.1. United States
- 1.2. Canada
- 1.3. Mexico
-
2. Europe
- 2.1. Germany
- 2.2. United Kingdom
- 2.3. France
- 2.4. Italy
- 2.5. Spain
- 2.6. Rest of Europe
-
3. Asia Pacific
- 3.1. China
- 3.2. Japan
- 3.3. India
- 3.4. Australia
- 3.5. South Korea
- 3.6. Rest of Asia Pacific
-
4. Middle East and Africa
- 4.1. GCC
- 4.2. South Africa
- 4.3. Rest of Middle East and Africa
-
5. South America
- 5.1. Brazil
- 5.2. Argentina
- 5.3. Rest of South America
Ear Infection Treatment Industry REPORT HIGHLIGHTS
| Aspects | Details |
|---|---|
| Study Period | 2019-2033 |
| Base Year | 2024 |
| Estimated Year | 2025 |
| Forecast Period | 2025-2033 |
| Historical Period | 2019-2024 |
| Growth Rate | CAGR of 4.29% from 2019-2033 |
| Segmentation |
|
Table of Contents
- 1. Introduction
- 1.1. Research Scope
- 1.2. Market Segmentation
- 1.3. Research Methodology
- 1.4. Definitions and Assumptions
- 2. Executive Summary
- 2.1. Introduction
- 3. Market Dynamics
- 3.1. Introduction
- 3.2. Market Drivers
- 3.2.1. Rising Prevalence of Ear Infections; Increase In Research and Development in the Field of Ear Infections
- 3.3. Market Restrains
- 3.3.1. High Costs and Complications Related to Surgical Procedures
- 3.4. Market Trends
- 3.4.1. The Middle Ear Infection Segment is Expected to Show a High Growth Rate During the Forecast Period
- 4. Market Factor Analysis
- 4.1. Porters Five Forces
- 4.2. Supply/Value Chain
- 4.3. PESTEL analysis
- 4.4. Market Entropy
- 4.5. Patent/Trademark Analysis
- 5. Global Ear Infection Treatment Industry Analysis, Insights and Forecast, 2019-2031
- 5.1. Market Analysis, Insights and Forecast - by Infection
- 5.1.1. Inner Ear Infection
- 5.1.2. Middle Ear Infection
- 5.1.3. Outer Ear Infection
- 5.2. Market Analysis, Insights and Forecast - by Cause
- 5.2.1. Viral Infection
- 5.2.2. Bacterial Infection
- 5.3. Market Analysis, Insights and Forecast - by Type
- 5.3.1. Medication
- 5.3.1.1. Antibiotics
- 5.3.1.2. Analgesics
- 5.3.1.3. AntiViral
- 5.3.2. Surgery
- 5.3.1. Medication
- 5.4. Market Analysis, Insights and Forecast - by Region
- 5.4.1. North America
- 5.4.2. Europe
- 5.4.3. Asia Pacific
- 5.4.4. Middle East and Africa
- 5.4.5. South America
- 5.1. Market Analysis, Insights and Forecast - by Infection
- 6. North America Ear Infection Treatment Industry Analysis, Insights and Forecast, 2019-2031
- 6.1. Market Analysis, Insights and Forecast - by Infection
- 6.1.1. Inner Ear Infection
- 6.1.2. Middle Ear Infection
- 6.1.3. Outer Ear Infection
- 6.2. Market Analysis, Insights and Forecast - by Cause
- 6.2.1. Viral Infection
- 6.2.2. Bacterial Infection
- 6.3. Market Analysis, Insights and Forecast - by Type
- 6.3.1. Medication
- 6.3.1.1. Antibiotics
- 6.3.1.2. Analgesics
- 6.3.1.3. AntiViral
- 6.3.2. Surgery
- 6.3.1. Medication
- 6.1. Market Analysis, Insights and Forecast - by Infection
- 7. Europe Ear Infection Treatment Industry Analysis, Insights and Forecast, 2019-2031
- 7.1. Market Analysis, Insights and Forecast - by Infection
- 7.1.1. Inner Ear Infection
- 7.1.2. Middle Ear Infection
- 7.1.3. Outer Ear Infection
- 7.2. Market Analysis, Insights and Forecast - by Cause
- 7.2.1. Viral Infection
- 7.2.2. Bacterial Infection
- 7.3. Market Analysis, Insights and Forecast - by Type
- 7.3.1. Medication
- 7.3.1.1. Antibiotics
- 7.3.1.2. Analgesics
- 7.3.1.3. AntiViral
- 7.3.2. Surgery
- 7.3.1. Medication
- 7.1. Market Analysis, Insights and Forecast - by Infection
- 8. Asia Pacific Ear Infection Treatment Industry Analysis, Insights and Forecast, 2019-2031
- 8.1. Market Analysis, Insights and Forecast - by Infection
- 8.1.1. Inner Ear Infection
- 8.1.2. Middle Ear Infection
- 8.1.3. Outer Ear Infection
- 8.2. Market Analysis, Insights and Forecast - by Cause
- 8.2.1. Viral Infection
- 8.2.2. Bacterial Infection
- 8.3. Market Analysis, Insights and Forecast - by Type
- 8.3.1. Medication
- 8.3.1.1. Antibiotics
- 8.3.1.2. Analgesics
- 8.3.1.3. AntiViral
- 8.3.2. Surgery
- 8.3.1. Medication
- 8.1. Market Analysis, Insights and Forecast - by Infection
- 9. Middle East and Africa Ear Infection Treatment Industry Analysis, Insights and Forecast, 2019-2031
- 9.1. Market Analysis, Insights and Forecast - by Infection
- 9.1.1. Inner Ear Infection
- 9.1.2. Middle Ear Infection
- 9.1.3. Outer Ear Infection
- 9.2. Market Analysis, Insights and Forecast - by Cause
- 9.2.1. Viral Infection
- 9.2.2. Bacterial Infection
- 9.3. Market Analysis, Insights and Forecast - by Type
- 9.3.1. Medication
- 9.3.1.1. Antibiotics
- 9.3.1.2. Analgesics
- 9.3.1.3. AntiViral
- 9.3.2. Surgery
- 9.3.1. Medication
- 9.1. Market Analysis, Insights and Forecast - by Infection
- 10. South America Ear Infection Treatment Industry Analysis, Insights and Forecast, 2019-2031
- 10.1. Market Analysis, Insights and Forecast - by Infection
- 10.1.1. Inner Ear Infection
- 10.1.2. Middle Ear Infection
- 10.1.3. Outer Ear Infection
- 10.2. Market Analysis, Insights and Forecast - by Cause
- 10.2.1. Viral Infection
- 10.2.2. Bacterial Infection
- 10.3. Market Analysis, Insights and Forecast - by Type
- 10.3.1. Medication
- 10.3.1.1. Antibiotics
- 10.3.1.2. Analgesics
- 10.3.1.3. AntiViral
- 10.3.2. Surgery
- 10.3.1. Medication
- 10.1. Market Analysis, Insights and Forecast - by Infection
- 11. North America Ear Infection Treatment Industry Analysis, Insights and Forecast, 2019-2031
- 11.1. Market Analysis, Insights and Forecast - By Country/Sub-region
- 11.1.1 United States
- 11.1.2 Canada
- 11.1.3 Mexico
- 12. Europe Ear Infection Treatment Industry Analysis, Insights and Forecast, 2019-2031
- 12.1. Market Analysis, Insights and Forecast - By Country/Sub-region
- 12.1.1 Germany
- 12.1.2 United Kingdom
- 12.1.3 France
- 12.1.4 Italy
- 12.1.5 Spain
- 12.1.6 Rest of Europe
- 13. Asia Pacific Ear Infection Treatment Industry Analysis, Insights and Forecast, 2019-2031
- 13.1. Market Analysis, Insights and Forecast - By Country/Sub-region
- 13.1.1 China
- 13.1.2 Japan
- 13.1.3 India
- 13.1.4 Australia
- 13.1.5 South Korea
- 13.1.6 Rest of Asia Pacific
- 14. Middle East and Africa Ear Infection Treatment Industry Analysis, Insights and Forecast, 2019-2031
- 14.1. Market Analysis, Insights and Forecast - By Country/Sub-region
- 14.1.1 GCC
- 14.1.2 South Africa
- 14.1.3 Rest of Middle East and Africa
- 15. South America Ear Infection Treatment Industry Analysis, Insights and Forecast, 2019-2031
- 15.1. Market Analysis, Insights and Forecast - By Country/Sub-region
- 15.1.1 Brazil
- 15.1.2 Argentina
- 15.1.3 Rest of South America
- 16. Competitive Analysis
- 16.1. Global Market Share Analysis 2024
- 16.2. Company Profiles
- 16.2.1 Sanofi SA
- 16.2.1.1. Overview
- 16.2.1.2. Products
- 16.2.1.3. SWOT Analysis
- 16.2.1.4. Recent Developments
- 16.2.1.5. Financials (Based on Availability)
- 16.2.2 Pfizer PLC
- 16.2.2.1. Overview
- 16.2.2.2. Products
- 16.2.2.3. SWOT Analysis
- 16.2.2.4. Recent Developments
- 16.2.2.5. Financials (Based on Availability)
- 16.2.3 Torque Pharma
- 16.2.3.1. Overview
- 16.2.3.2. Products
- 16.2.3.3. SWOT Analysis
- 16.2.3.4. Recent Developments
- 16.2.3.5. Financials (Based on Availability)
- 16.2.4 Cipla Ltd
- 16.2.4.1. Overview
- 16.2.4.2. Products
- 16.2.4.3. SWOT Analysis
- 16.2.4.4. Recent Developments
- 16.2.4.5. Financials (Based on Availability)
- 16.2.5 Novartis AG
- 16.2.5.1. Overview
- 16.2.5.2. Products
- 16.2.5.3. SWOT Analysis
- 16.2.5.4. Recent Developments
- 16.2.5.5. Financials (Based on Availability)
- 16.2.6 Grace Medical
- 16.2.6.1. Overview
- 16.2.6.2. Products
- 16.2.6.3. SWOT Analysis
- 16.2.6.4. Recent Developments
- 16.2.6.5. Financials (Based on Availability)
- 16.2.7 Medtronic PLC
- 16.2.7.1. Overview
- 16.2.7.2. Products
- 16.2.7.3. SWOT Analysis
- 16.2.7.4. Recent Developments
- 16.2.7.5. Financials (Based on Availability)
- 16.2.8 GSK plc
- 16.2.8.1. Overview
- 16.2.8.2. Products
- 16.2.8.3. SWOT Analysis
- 16.2.8.4. Recent Developments
- 16.2.8.5. Financials (Based on Availability)
- 16.2.9 Otonomy Inc
- 16.2.9.1. Overview
- 16.2.9.2. Products
- 16.2.9.3. SWOT Analysis
- 16.2.9.4. Recent Developments
- 16.2.9.5. Financials (Based on Availability)
- 16.2.10 Johnson & Johnson
- 16.2.10.1. Overview
- 16.2.10.2. Products
- 16.2.10.3. SWOT Analysis
- 16.2.10.4. Recent Developments
- 16.2.10.5. Financials (Based on Availability)
- 16.2.11 Olympus Corporation
- 16.2.11.1. Overview
- 16.2.11.2. Products
- 16.2.11.3. SWOT Analysis
- 16.2.11.4. Recent Developments
- 16.2.11.5. Financials (Based on Availability)
- 16.2.12 American Diagnostic Corporation
- 16.2.12.1. Overview
- 16.2.12.2. Products
- 16.2.12.3. SWOT Analysis
- 16.2.12.4. Recent Developments
- 16.2.12.5. Financials (Based on Availability)
- 16.2.1 Sanofi SA
List of Figures
- Figure 1: Global Ear Infection Treatment Industry Revenue Breakdown (Million, %) by Region 2024 & 2032
- Figure 2: Global Ear Infection Treatment Industry Volume Breakdown (K Unit, %) by Region 2024 & 2032
- Figure 3: North America Ear Infection Treatment Industry Revenue (Million), by Country 2024 & 2032
- Figure 4: North America Ear Infection Treatment Industry Volume (K Unit), by Country 2024 & 2032
- Figure 5: North America Ear Infection Treatment Industry Revenue Share (%), by Country 2024 & 2032
- Figure 6: North America Ear Infection Treatment Industry Volume Share (%), by Country 2024 & 2032
- Figure 7: Europe Ear Infection Treatment Industry Revenue (Million), by Country 2024 & 2032
- Figure 8: Europe Ear Infection Treatment Industry Volume (K Unit), by Country 2024 & 2032
- Figure 9: Europe Ear Infection Treatment Industry Revenue Share (%), by Country 2024 & 2032
- Figure 10: Europe Ear Infection Treatment Industry Volume Share (%), by Country 2024 & 2032
- Figure 11: Asia Pacific Ear Infection Treatment Industry Revenue (Million), by Country 2024 & 2032
- Figure 12: Asia Pacific Ear Infection Treatment Industry Volume (K Unit), by Country 2024 & 2032
- Figure 13: Asia Pacific Ear Infection Treatment Industry Revenue Share (%), by Country 2024 & 2032
- Figure 14: Asia Pacific Ear Infection Treatment Industry Volume Share (%), by Country 2024 & 2032
- Figure 15: Middle East and Africa Ear Infection Treatment Industry Revenue (Million), by Country 2024 & 2032
- Figure 16: Middle East and Africa Ear Infection Treatment Industry Volume (K Unit), by Country 2024 & 2032
- Figure 17: Middle East and Africa Ear Infection Treatment Industry Revenue Share (%), by Country 2024 & 2032
- Figure 18: Middle East and Africa Ear Infection Treatment Industry Volume Share (%), by Country 2024 & 2032
- Figure 19: South America Ear Infection Treatment Industry Revenue (Million), by Country 2024 & 2032
- Figure 20: South America Ear Infection Treatment Industry Volume (K Unit), by Country 2024 & 2032
- Figure 21: South America Ear Infection Treatment Industry Revenue Share (%), by Country 2024 & 2032
- Figure 22: South America Ear Infection Treatment Industry Volume Share (%), by Country 2024 & 2032
- Figure 23: North America Ear Infection Treatment Industry Revenue (Million), by Infection 2024 & 2032
- Figure 24: North America Ear Infection Treatment Industry Volume (K Unit), by Infection 2024 & 2032
- Figure 25: North America Ear Infection Treatment Industry Revenue Share (%), by Infection 2024 & 2032
- Figure 26: North America Ear Infection Treatment Industry Volume Share (%), by Infection 2024 & 2032
- Figure 27: North America Ear Infection Treatment Industry Revenue (Million), by Cause 2024 & 2032
- Figure 28: North America Ear Infection Treatment Industry Volume (K Unit), by Cause 2024 & 2032
- Figure 29: North America Ear Infection Treatment Industry Revenue Share (%), by Cause 2024 & 2032
- Figure 30: North America Ear Infection Treatment Industry Volume Share (%), by Cause 2024 & 2032
- Figure 31: North America Ear Infection Treatment Industry Revenue (Million), by Type 2024 & 2032
- Figure 32: North America Ear Infection Treatment Industry Volume (K Unit), by Type 2024 & 2032
- Figure 33: North America Ear Infection Treatment Industry Revenue Share (%), by Type 2024 & 2032
- Figure 34: North America Ear Infection Treatment Industry Volume Share (%), by Type 2024 & 2032
- Figure 35: North America Ear Infection Treatment Industry Revenue (Million), by Country 2024 & 2032
- Figure 36: North America Ear Infection Treatment Industry Volume (K Unit), by Country 2024 & 2032
- Figure 37: North America Ear Infection Treatment Industry Revenue Share (%), by Country 2024 & 2032
- Figure 38: North America Ear Infection Treatment Industry Volume Share (%), by Country 2024 & 2032
- Figure 39: Europe Ear Infection Treatment Industry Revenue (Million), by Infection 2024 & 2032
- Figure 40: Europe Ear Infection Treatment Industry Volume (K Unit), by Infection 2024 & 2032
- Figure 41: Europe Ear Infection Treatment Industry Revenue Share (%), by Infection 2024 & 2032
- Figure 42: Europe Ear Infection Treatment Industry Volume Share (%), by Infection 2024 & 2032
- Figure 43: Europe Ear Infection Treatment Industry Revenue (Million), by Cause 2024 & 2032
- Figure 44: Europe Ear Infection Treatment Industry Volume (K Unit), by Cause 2024 & 2032
- Figure 45: Europe Ear Infection Treatment Industry Revenue Share (%), by Cause 2024 & 2032
- Figure 46: Europe Ear Infection Treatment Industry Volume Share (%), by Cause 2024 & 2032
- Figure 47: Europe Ear Infection Treatment Industry Revenue (Million), by Type 2024 & 2032
- Figure 48: Europe Ear Infection Treatment Industry Volume (K Unit), by Type 2024 & 2032
- Figure 49: Europe Ear Infection Treatment Industry Revenue Share (%), by Type 2024 & 2032
- Figure 50: Europe Ear Infection Treatment Industry Volume Share (%), by Type 2024 & 2032
- Figure 51: Europe Ear Infection Treatment Industry Revenue (Million), by Country 2024 & 2032
- Figure 52: Europe Ear Infection Treatment Industry Volume (K Unit), by Country 2024 & 2032
- Figure 53: Europe Ear Infection Treatment Industry Revenue Share (%), by Country 2024 & 2032
- Figure 54: Europe Ear Infection Treatment Industry Volume Share (%), by Country 2024 & 2032
- Figure 55: Asia Pacific Ear Infection Treatment Industry Revenue (Million), by Infection 2024 & 2032
- Figure 56: Asia Pacific Ear Infection Treatment Industry Volume (K Unit), by Infection 2024 & 2032
- Figure 57: Asia Pacific Ear Infection Treatment Industry Revenue Share (%), by Infection 2024 & 2032
- Figure 58: Asia Pacific Ear Infection Treatment Industry Volume Share (%), by Infection 2024 & 2032
- Figure 59: Asia Pacific Ear Infection Treatment Industry Revenue (Million), by Cause 2024 & 2032
- Figure 60: Asia Pacific Ear Infection Treatment Industry Volume (K Unit), by Cause 2024 & 2032
- Figure 61: Asia Pacific Ear Infection Treatment Industry Revenue Share (%), by Cause 2024 & 2032
- Figure 62: Asia Pacific Ear Infection Treatment Industry Volume Share (%), by Cause 2024 & 2032
- Figure 63: Asia Pacific Ear Infection Treatment Industry Revenue (Million), by Type 2024 & 2032
- Figure 64: Asia Pacific Ear Infection Treatment Industry Volume (K Unit), by Type 2024 & 2032
- Figure 65: Asia Pacific Ear Infection Treatment Industry Revenue Share (%), by Type 2024 & 2032
- Figure 66: Asia Pacific Ear Infection Treatment Industry Volume Share (%), by Type 2024 & 2032
- Figure 67: Asia Pacific Ear Infection Treatment Industry Revenue (Million), by Country 2024 & 2032
- Figure 68: Asia Pacific Ear Infection Treatment Industry Volume (K Unit), by Country 2024 & 2032
- Figure 69: Asia Pacific Ear Infection Treatment Industry Revenue Share (%), by Country 2024 & 2032
- Figure 70: Asia Pacific Ear Infection Treatment Industry Volume Share (%), by Country 2024 & 2032
- Figure 71: Middle East and Africa Ear Infection Treatment Industry Revenue (Million), by Infection 2024 & 2032
- Figure 72: Middle East and Africa Ear Infection Treatment Industry Volume (K Unit), by Infection 2024 & 2032
- Figure 73: Middle East and Africa Ear Infection Treatment Industry Revenue Share (%), by Infection 2024 & 2032
- Figure 74: Middle East and Africa Ear Infection Treatment Industry Volume Share (%), by Infection 2024 & 2032
- Figure 75: Middle East and Africa Ear Infection Treatment Industry Revenue (Million), by Cause 2024 & 2032
- Figure 76: Middle East and Africa Ear Infection Treatment Industry Volume (K Unit), by Cause 2024 & 2032
- Figure 77: Middle East and Africa Ear Infection Treatment Industry Revenue Share (%), by Cause 2024 & 2032
- Figure 78: Middle East and Africa Ear Infection Treatment Industry Volume Share (%), by Cause 2024 & 2032
- Figure 79: Middle East and Africa Ear Infection Treatment Industry Revenue (Million), by Type 2024 & 2032
- Figure 80: Middle East and Africa Ear Infection Treatment Industry Volume (K Unit), by Type 2024 & 2032
- Figure 81: Middle East and Africa Ear Infection Treatment Industry Revenue Share (%), by Type 2024 & 2032
- Figure 82: Middle East and Africa Ear Infection Treatment Industry Volume Share (%), by Type 2024 & 2032
- Figure 83: Middle East and Africa Ear Infection Treatment Industry Revenue (Million), by Country 2024 & 2032
- Figure 84: Middle East and Africa Ear Infection Treatment Industry Volume (K Unit), by Country 2024 & 2032
- Figure 85: Middle East and Africa Ear Infection Treatment Industry Revenue Share (%), by Country 2024 & 2032
- Figure 86: Middle East and Africa Ear Infection Treatment Industry Volume Share (%), by Country 2024 & 2032
- Figure 87: South America Ear Infection Treatment Industry Revenue (Million), by Infection 2024 & 2032
- Figure 88: South America Ear Infection Treatment Industry Volume (K Unit), by Infection 2024 & 2032
- Figure 89: South America Ear Infection Treatment Industry Revenue Share (%), by Infection 2024 & 2032
- Figure 90: South America Ear Infection Treatment Industry Volume Share (%), by Infection 2024 & 2032
- Figure 91: South America Ear Infection Treatment Industry Revenue (Million), by Cause 2024 & 2032
- Figure 92: South America Ear Infection Treatment Industry Volume (K Unit), by Cause 2024 & 2032
- Figure 93: South America Ear Infection Treatment Industry Revenue Share (%), by Cause 2024 & 2032
- Figure 94: South America Ear Infection Treatment Industry Volume Share (%), by Cause 2024 & 2032
- Figure 95: South America Ear Infection Treatment Industry Revenue (Million), by Type 2024 & 2032
- Figure 96: South America Ear Infection Treatment Industry Volume (K Unit), by Type 2024 & 2032
- Figure 97: South America Ear Infection Treatment Industry Revenue Share (%), by Type 2024 & 2032
- Figure 98: South America Ear Infection Treatment Industry Volume Share (%), by Type 2024 & 2032
- Figure 99: South America Ear Infection Treatment Industry Revenue (Million), by Country 2024 & 2032
- Figure 100: South America Ear Infection Treatment Industry Volume (K Unit), by Country 2024 & 2032
- Figure 101: South America Ear Infection Treatment Industry Revenue Share (%), by Country 2024 & 2032
- Figure 102: South America Ear Infection Treatment Industry Volume Share (%), by Country 2024 & 2032
List of Tables
- Table 1: Global Ear Infection Treatment Industry Revenue Million Forecast, by Region 2019 & 2032
- Table 2: Global Ear Infection Treatment Industry Volume K Unit Forecast, by Region 2019 & 2032
- Table 3: Global Ear Infection Treatment Industry Revenue Million Forecast, by Infection 2019 & 2032
- Table 4: Global Ear Infection Treatment Industry Volume K Unit Forecast, by Infection 2019 & 2032
- Table 5: Global Ear Infection Treatment Industry Revenue Million Forecast, by Cause 2019 & 2032
- Table 6: Global Ear Infection Treatment Industry Volume K Unit Forecast, by Cause 2019 & 2032
- Table 7: Global Ear Infection Treatment Industry Revenue Million Forecast, by Type 2019 & 2032
- Table 8: Global Ear Infection Treatment Industry Volume K Unit Forecast, by Type 2019 & 2032
- Table 9: Global Ear Infection Treatment Industry Revenue Million Forecast, by Region 2019 & 2032
- Table 10: Global Ear Infection Treatment Industry Volume K Unit Forecast, by Region 2019 & 2032
- Table 11: Global Ear Infection Treatment Industry Revenue Million Forecast, by Country 2019 & 2032
- Table 12: Global Ear Infection Treatment Industry Volume K Unit Forecast, by Country 2019 & 2032
- Table 13: United States Ear Infection Treatment Industry Revenue (Million) Forecast, by Application 2019 & 2032
- Table 14: United States Ear Infection Treatment Industry Volume (K Unit) Forecast, by Application 2019 & 2032
- Table 15: Canada Ear Infection Treatment Industry Revenue (Million) Forecast, by Application 2019 & 2032
- Table 16: Canada Ear Infection Treatment Industry Volume (K Unit) Forecast, by Application 2019 & 2032
- Table 17: Mexico Ear Infection Treatment Industry Revenue (Million) Forecast, by Application 2019 & 2032
- Table 18: Mexico Ear Infection Treatment Industry Volume (K Unit) Forecast, by Application 2019 & 2032
- Table 19: Global Ear Infection Treatment Industry Revenue Million Forecast, by Country 2019 & 2032
- Table 20: Global Ear Infection Treatment Industry Volume K Unit Forecast, by Country 2019 & 2032
- Table 21: Germany Ear Infection Treatment Industry Revenue (Million) Forecast, by Application 2019 & 2032
- Table 22: Germany Ear Infection Treatment Industry Volume (K Unit) Forecast, by Application 2019 & 2032
- Table 23: United Kingdom Ear Infection Treatment Industry Revenue (Million) Forecast, by Application 2019 & 2032
- Table 24: United Kingdom Ear Infection Treatment Industry Volume (K Unit) Forecast, by Application 2019 & 2032
- Table 25: France Ear Infection Treatment Industry Revenue (Million) Forecast, by Application 2019 & 2032
- Table 26: France Ear Infection Treatment Industry Volume (K Unit) Forecast, by Application 2019 & 2032
- Table 27: Italy Ear Infection Treatment Industry Revenue (Million) Forecast, by Application 2019 & 2032
- Table 28: Italy Ear Infection Treatment Industry Volume (K Unit) Forecast, by Application 2019 & 2032
- Table 29: Spain Ear Infection Treatment Industry Revenue (Million) Forecast, by Application 2019 & 2032
- Table 30: Spain Ear Infection Treatment Industry Volume (K Unit) Forecast, by Application 2019 & 2032
- Table 31: Rest of Europe Ear Infection Treatment Industry Revenue (Million) Forecast, by Application 2019 & 2032
- Table 32: Rest of Europe Ear Infection Treatment Industry Volume (K Unit) Forecast, by Application 2019 & 2032
- Table 33: Global Ear Infection Treatment Industry Revenue Million Forecast, by Country 2019 & 2032
- Table 34: Global Ear Infection Treatment Industry Volume K Unit Forecast, by Country 2019 & 2032
- Table 35: China Ear Infection Treatment Industry Revenue (Million) Forecast, by Application 2019 & 2032
- Table 36: China Ear Infection Treatment Industry Volume (K Unit) Forecast, by Application 2019 & 2032
- Table 37: Japan Ear Infection Treatment Industry Revenue (Million) Forecast, by Application 2019 & 2032
- Table 38: Japan Ear Infection Treatment Industry Volume (K Unit) Forecast, by Application 2019 & 2032
- Table 39: India Ear Infection Treatment Industry Revenue (Million) Forecast, by Application 2019 & 2032
- Table 40: India Ear Infection Treatment Industry Volume (K Unit) Forecast, by Application 2019 & 2032
- Table 41: Australia Ear Infection Treatment Industry Revenue (Million) Forecast, by Application 2019 & 2032
- Table 42: Australia Ear Infection Treatment Industry Volume (K Unit) Forecast, by Application 2019 & 2032
- Table 43: South Korea Ear Infection Treatment Industry Revenue (Million) Forecast, by Application 2019 & 2032
- Table 44: South Korea Ear Infection Treatment Industry Volume (K Unit) Forecast, by Application 2019 & 2032
- Table 45: Rest of Asia Pacific Ear Infection Treatment Industry Revenue (Million) Forecast, by Application 2019 & 2032
- Table 46: Rest of Asia Pacific Ear Infection Treatment Industry Volume (K Unit) Forecast, by Application 2019 & 2032
- Table 47: Global Ear Infection Treatment Industry Revenue Million Forecast, by Country 2019 & 2032
- Table 48: Global Ear Infection Treatment Industry Volume K Unit Forecast, by Country 2019 & 2032
- Table 49: GCC Ear Infection Treatment Industry Revenue (Million) Forecast, by Application 2019 & 2032
- Table 50: GCC Ear Infection Treatment Industry Volume (K Unit) Forecast, by Application 2019 & 2032
- Table 51: South Africa Ear Infection Treatment Industry Revenue (Million) Forecast, by Application 2019 & 2032
- Table 52: South Africa Ear Infection Treatment Industry Volume (K Unit) Forecast, by Application 2019 & 2032
- Table 53: Rest of Middle East and Africa Ear Infection Treatment Industry Revenue (Million) Forecast, by Application 2019 & 2032
- Table 54: Rest of Middle East and Africa Ear Infection Treatment Industry Volume (K Unit) Forecast, by Application 2019 & 2032
- Table 55: Global Ear Infection Treatment Industry Revenue Million Forecast, by Country 2019 & 2032
- Table 56: Global Ear Infection Treatment Industry Volume K Unit Forecast, by Country 2019 & 2032
- Table 57: Brazil Ear Infection Treatment Industry Revenue (Million) Forecast, by Application 2019 & 2032
- Table 58: Brazil Ear Infection Treatment Industry Volume (K Unit) Forecast, by Application 2019 & 2032
- Table 59: Argentina Ear Infection Treatment Industry Revenue (Million) Forecast, by Application 2019 & 2032
- Table 60: Argentina Ear Infection Treatment Industry Volume (K Unit) Forecast, by Application 2019 & 2032
- Table 61: Rest of South America Ear Infection Treatment Industry Revenue (Million) Forecast, by Application 2019 & 2032
- Table 62: Rest of South America Ear Infection Treatment Industry Volume (K Unit) Forecast, by Application 2019 & 2032
- Table 63: Global Ear Infection Treatment Industry Revenue Million Forecast, by Infection 2019 & 2032
- Table 64: Global Ear Infection Treatment Industry Volume K Unit Forecast, by Infection 2019 & 2032
- Table 65: Global Ear Infection Treatment Industry Revenue Million Forecast, by Cause 2019 & 2032
- Table 66: Global Ear Infection Treatment Industry Volume K Unit Forecast, by Cause 2019 & 2032
- Table 67: Global Ear Infection Treatment Industry Revenue Million Forecast, by Type 2019 & 2032
- Table 68: Global Ear Infection Treatment Industry Volume K Unit Forecast, by Type 2019 & 2032
- Table 69: Global Ear Infection Treatment Industry Revenue Million Forecast, by Country 2019 & 2032
- Table 70: Global Ear Infection Treatment Industry Volume K Unit Forecast, by Country 2019 & 2032
- Table 71: United States Ear Infection Treatment Industry Revenue (Million) Forecast, by Application 2019 & 2032
- Table 72: United States Ear Infection Treatment Industry Volume (K Unit) Forecast, by Application 2019 & 2032
- Table 73: Canada Ear Infection Treatment Industry Revenue (Million) Forecast, by Application 2019 & 2032
- Table 74: Canada Ear Infection Treatment Industry Volume (K Unit) Forecast, by Application 2019 & 2032
- Table 75: Mexico Ear Infection Treatment Industry Revenue (Million) Forecast, by Application 2019 & 2032
- Table 76: Mexico Ear Infection Treatment Industry Volume (K Unit) Forecast, by Application 2019 & 2032
- Table 77: Global Ear Infection Treatment Industry Revenue Million Forecast, by Infection 2019 & 2032
- Table 78: Global Ear Infection Treatment Industry Volume K Unit Forecast, by Infection 2019 & 2032
- Table 79: Global Ear Infection Treatment Industry Revenue Million Forecast, by Cause 2019 & 2032
- Table 80: Global Ear Infection Treatment Industry Volume K Unit Forecast, by Cause 2019 & 2032
- Table 81: Global Ear Infection Treatment Industry Revenue Million Forecast, by Type 2019 & 2032
- Table 82: Global Ear Infection Treatment Industry Volume K Unit Forecast, by Type 2019 & 2032
- Table 83: Global Ear Infection Treatment Industry Revenue Million Forecast, by Country 2019 & 2032
- Table 84: Global Ear Infection Treatment Industry Volume K Unit Forecast, by Country 2019 & 2032
- Table 85: Germany Ear Infection Treatment Industry Revenue (Million) Forecast, by Application 2019 & 2032
- Table 86: Germany Ear Infection Treatment Industry Volume (K Unit) Forecast, by Application 2019 & 2032
- Table 87: United Kingdom Ear Infection Treatment Industry Revenue (Million) Forecast, by Application 2019 & 2032
- Table 88: United Kingdom Ear Infection Treatment Industry Volume (K Unit) Forecast, by Application 2019 & 2032
- Table 89: France Ear Infection Treatment Industry Revenue (Million) Forecast, by Application 2019 & 2032
- Table 90: France Ear Infection Treatment Industry Volume (K Unit) Forecast, by Application 2019 & 2032
- Table 91: Italy Ear Infection Treatment Industry Revenue (Million) Forecast, by Application 2019 & 2032
- Table 92: Italy Ear Infection Treatment Industry Volume (K Unit) Forecast, by Application 2019 & 2032
- Table 93: Spain Ear Infection Treatment Industry Revenue (Million) Forecast, by Application 2019 & 2032
- Table 94: Spain Ear Infection Treatment Industry Volume (K Unit) Forecast, by Application 2019 & 2032
- Table 95: Rest of Europe Ear Infection Treatment Industry Revenue (Million) Forecast, by Application 2019 & 2032
- Table 96: Rest of Europe Ear Infection Treatment Industry Volume (K Unit) Forecast, by Application 2019 & 2032
- Table 97: Global Ear Infection Treatment Industry Revenue Million Forecast, by Infection 2019 & 2032
- Table 98: Global Ear Infection Treatment Industry Volume K Unit Forecast, by Infection 2019 & 2032
- Table 99: Global Ear Infection Treatment Industry Revenue Million Forecast, by Cause 2019 & 2032
- Table 100: Global Ear Infection Treatment Industry Volume K Unit Forecast, by Cause 2019 & 2032
- Table 101: Global Ear Infection Treatment Industry Revenue Million Forecast, by Type 2019 & 2032
- Table 102: Global Ear Infection Treatment Industry Volume K Unit Forecast, by Type 2019 & 2032
- Table 103: Global Ear Infection Treatment Industry Revenue Million Forecast, by Country 2019 & 2032
- Table 104: Global Ear Infection Treatment Industry Volume K Unit Forecast, by Country 2019 & 2032
- Table 105: China Ear Infection Treatment Industry Revenue (Million) Forecast, by Application 2019 & 2032
- Table 106: China Ear Infection Treatment Industry Volume (K Unit) Forecast, by Application 2019 & 2032
- Table 107: Japan Ear Infection Treatment Industry Revenue (Million) Forecast, by Application 2019 & 2032
- Table 108: Japan Ear Infection Treatment Industry Volume (K Unit) Forecast, by Application 2019 & 2032
- Table 109: India Ear Infection Treatment Industry Revenue (Million) Forecast, by Application 2019 & 2032
- Table 110: India Ear Infection Treatment Industry Volume (K Unit) Forecast, by Application 2019 & 2032
- Table 111: Australia Ear Infection Treatment Industry Revenue (Million) Forecast, by Application 2019 & 2032
- Table 112: Australia Ear Infection Treatment Industry Volume (K Unit) Forecast, by Application 2019 & 2032
- Table 113: South Korea Ear Infection Treatment Industry Revenue (Million) Forecast, by Application 2019 & 2032
- Table 114: South Korea Ear Infection Treatment Industry Volume (K Unit) Forecast, by Application 2019 & 2032
- Table 115: Rest of Asia Pacific Ear Infection Treatment Industry Revenue (Million) Forecast, by Application 2019 & 2032
- Table 116: Rest of Asia Pacific Ear Infection Treatment Industry Volume (K Unit) Forecast, by Application 2019 & 2032
- Table 117: Global Ear Infection Treatment Industry Revenue Million Forecast, by Infection 2019 & 2032
- Table 118: Global Ear Infection Treatment Industry Volume K Unit Forecast, by Infection 2019 & 2032
- Table 119: Global Ear Infection Treatment Industry Revenue Million Forecast, by Cause 2019 & 2032
- Table 120: Global Ear Infection Treatment Industry Volume K Unit Forecast, by Cause 2019 & 2032
- Table 121: Global Ear Infection Treatment Industry Revenue Million Forecast, by Type 2019 & 2032
- Table 122: Global Ear Infection Treatment Industry Volume K Unit Forecast, by Type 2019 & 2032
- Table 123: Global Ear Infection Treatment Industry Revenue Million Forecast, by Country 2019 & 2032
- Table 124: Global Ear Infection Treatment Industry Volume K Unit Forecast, by Country 2019 & 2032
- Table 125: GCC Ear Infection Treatment Industry Revenue (Million) Forecast, by Application 2019 & 2032
- Table 126: GCC Ear Infection Treatment Industry Volume (K Unit) Forecast, by Application 2019 & 2032
- Table 127: South Africa Ear Infection Treatment Industry Revenue (Million) Forecast, by Application 2019 & 2032
- Table 128: South Africa Ear Infection Treatment Industry Volume (K Unit) Forecast, by Application 2019 & 2032
- Table 129: Rest of Middle East and Africa Ear Infection Treatment Industry Revenue (Million) Forecast, by Application 2019 & 2032
- Table 130: Rest of Middle East and Africa Ear Infection Treatment Industry Volume (K Unit) Forecast, by Application 2019 & 2032
- Table 131: Global Ear Infection Treatment Industry Revenue Million Forecast, by Infection 2019 & 2032
- Table 132: Global Ear Infection Treatment Industry Volume K Unit Forecast, by Infection 2019 & 2032
- Table 133: Global Ear Infection Treatment Industry Revenue Million Forecast, by Cause 2019 & 2032
- Table 134: Global Ear Infection Treatment Industry Volume K Unit Forecast, by Cause 2019 & 2032
- Table 135: Global Ear Infection Treatment Industry Revenue Million Forecast, by Type 2019 & 2032
- Table 136: Global Ear Infection Treatment Industry Volume K Unit Forecast, by Type 2019 & 2032
- Table 137: Global Ear Infection Treatment Industry Revenue Million Forecast, by Country 2019 & 2032
- Table 138: Global Ear Infection Treatment Industry Volume K Unit Forecast, by Country 2019 & 2032
- Table 139: Brazil Ear Infection Treatment Industry Revenue (Million) Forecast, by Application 2019 & 2032
- Table 140: Brazil Ear Infection Treatment Industry Volume (K Unit) Forecast, by Application 2019 & 2032
- Table 141: Argentina Ear Infection Treatment Industry Revenue (Million) Forecast, by Application 2019 & 2032
- Table 142: Argentina Ear Infection Treatment Industry Volume (K Unit) Forecast, by Application 2019 & 2032
- Table 143: Rest of South America Ear Infection Treatment Industry Revenue (Million) Forecast, by Application 2019 & 2032
- Table 144: Rest of South America Ear Infection Treatment Industry Volume (K Unit) Forecast, by Application 2019 & 2032
Frequently Asked Questions
1. What is the projected Compound Annual Growth Rate (CAGR) of the Ear Infection Treatment Industry?
The projected CAGR is approximately 4.29%.
2. Which companies are prominent players in the Ear Infection Treatment Industry?
Key companies in the market include Sanofi SA, Pfizer PLC, Torque Pharma, Cipla Ltd, Novartis AG, Grace Medical, Medtronic PLC, GSK plc, Otonomy Inc, Johnson & Johnson, Olympus Corporation, American Diagnostic Corporation.
3. What are the main segments of the Ear Infection Treatment Industry?
The market segments include Infection, Cause, Type.
4. Can you provide details about the market size?
The market size is estimated to be USD 12.23 Million as of 2022.
5. What are some drivers contributing to market growth?
Rising Prevalence of Ear Infections; Increase In Research and Development in the Field of Ear Infections.
6. What are the notable trends driving market growth?
The Middle Ear Infection Segment is Expected to Show a High Growth Rate During the Forecast Period.
7. Are there any restraints impacting market growth?
High Costs and Complications Related to Surgical Procedures.
8. Can you provide examples of recent developments in the market?
November 2022: The Denver Health and Hospital Authority started a clinical trial study under the title "RELAX: Reducing Length of Antibiotics for Children With Ear Infections (RELAX)". The aim of the study is to evaluate the effectiveness and implementation outcomes of two low-cost interventions of different intensities to increase the prescribing of recommended short antibiotic durations for acute otitis media (AOM) in children 2 years of age and older.
9. What pricing options are available for accessing the report?
Pricing options include single-user, multi-user, and enterprise licenses priced at USD 4750, USD 5250, and USD 8750 respectively.
10. Is the market size provided in terms of value or volume?
The market size is provided in terms of value, measured in Million and volume, measured in K Unit.
11. Are there any specific market keywords associated with the report?
Yes, the market keyword associated with the report is "Ear Infection Treatment Industry," which aids in identifying and referencing the specific market segment covered.
12. How do I determine which pricing option suits my needs best?
The pricing options vary based on user requirements and access needs. Individual users may opt for single-user licenses, while businesses requiring broader access may choose multi-user or enterprise licenses for cost-effective access to the report.
13. Are there any additional resources or data provided in the Ear Infection Treatment Industry report?
While the report offers comprehensive insights, it's advisable to review the specific contents or supplementary materials provided to ascertain if additional resources or data are available.
14. How can I stay updated on further developments or reports in the Ear Infection Treatment Industry?
To stay informed about further developments, trends, and reports in the Ear Infection Treatment Industry, consider subscribing to industry newsletters, following relevant companies and organizations, or regularly checking reputable industry news sources and publications.
Methodology
Step 1 - Identification of Relevant Samples Size from Population Database


Step 2 - Approaches for Defining Global Market Size (Value, Volume* & Price*)

Note*: In applicable scenarios
Step 3 - Data Sources
Primary Research
- Web Analytics
- Survey Reports
- Research Institute
- Latest Research Reports
- Opinion Leaders
Secondary Research
- Annual Reports
- White Paper
- Latest Press Release
- Industry Association
- Paid Database
- Investor Presentations

Step 4 - Data Triangulation
Involves using different sources of information in order to increase the validity of a study
These sources are likely to be stakeholders in a program - participants, other researchers, program staff, other community members, and so on.
Then we put all data in single framework & apply various statistical tools to find out the dynamic on the market.
During the analysis stage, feedback from the stakeholder groups would be compared to determine areas of agreement as well as areas of divergence


