
Key Insights
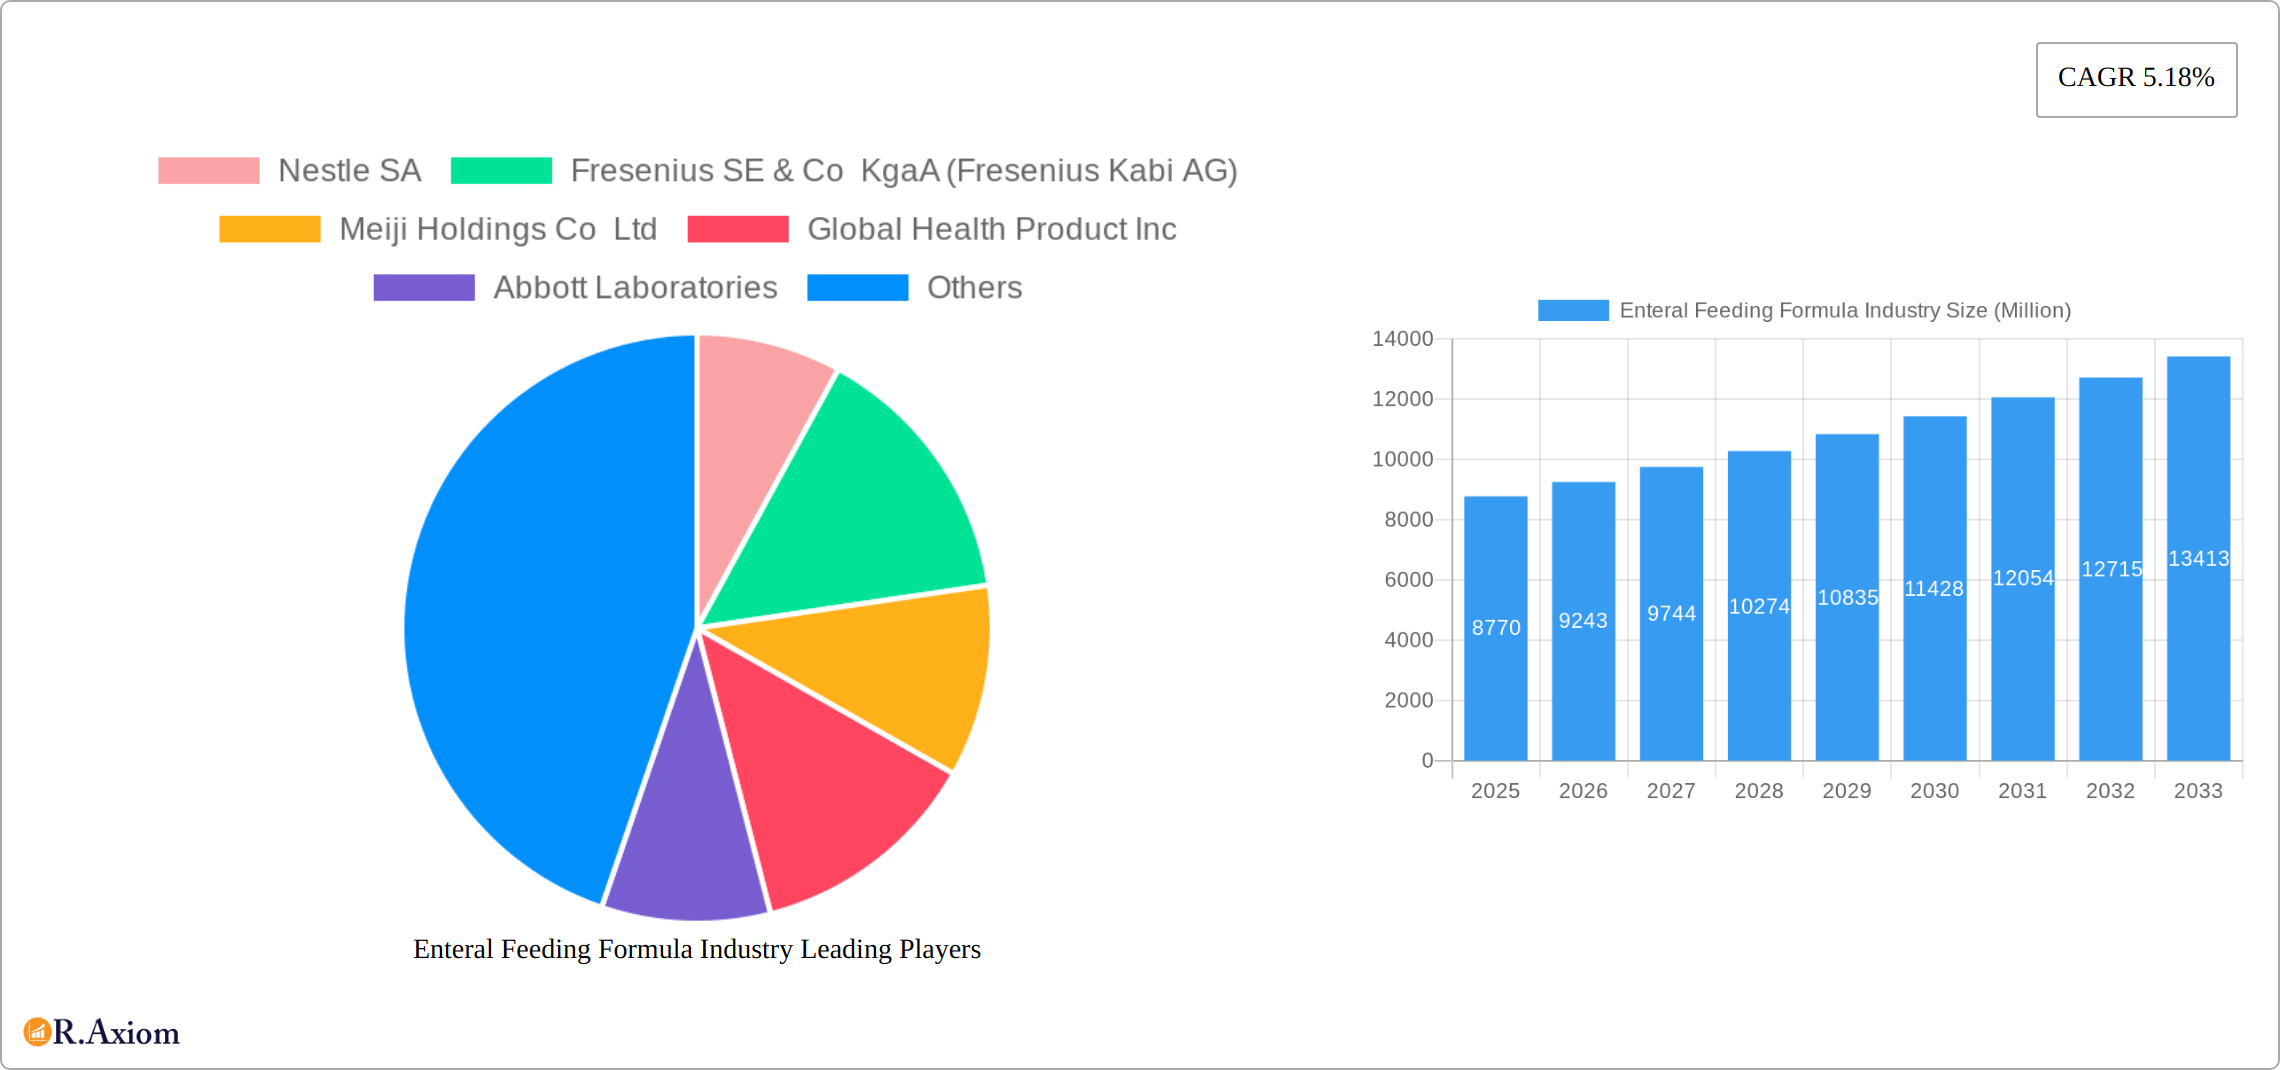
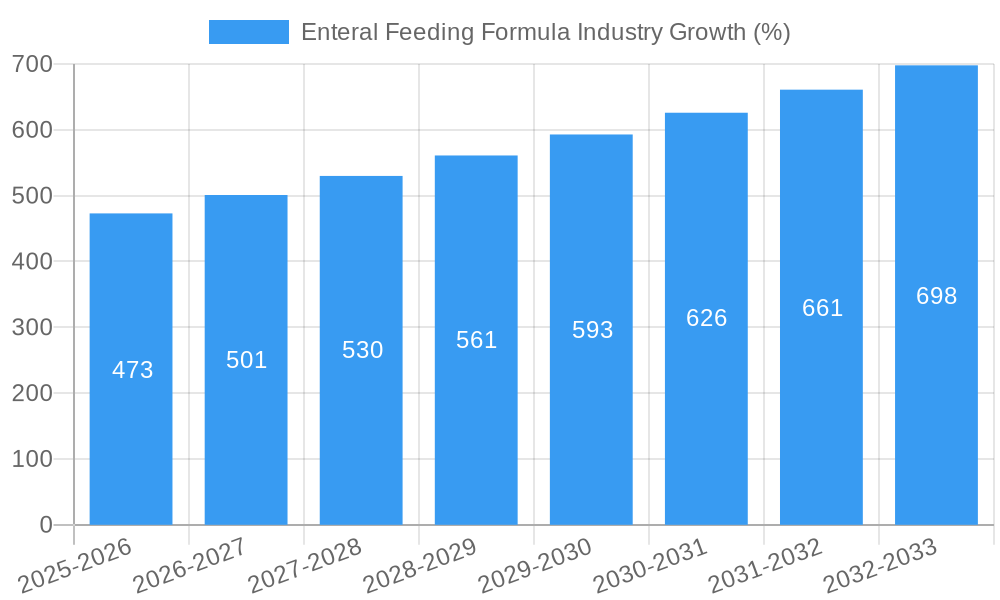
The global enteral feeding formula market, valued at $8.77 billion in 2025, is projected to experience robust growth, driven by a compound annual growth rate (CAGR) of 5.18% from 2025 to 2033. This expansion is fueled by several key factors. The rising prevalence of chronic diseases like cancer, neurological disorders, and diabetes necessitates increased reliance on enteral nutrition, significantly boosting market demand. An aging global population, with its associated higher incidence of age-related health issues requiring specialized nutritional support, further contributes to market growth. Technological advancements in formula composition, leading to improved patient outcomes and reduced complications, also play a vital role. The increasing preference for home healthcare settings, coupled with the growing awareness among consumers regarding the benefits of enteral nutrition, further fuels market expansion across various regions. Product diversification, including the development of disease-specific formulas catering to niche needs, adds another layer to the market's growth trajectory.
Competition within the enteral feeding formula market is intense, with major players like Nestlé, Fresenius Kabi, Abbott Laboratories, and Danone vying for market share. However, the market also presents opportunities for smaller, specialized companies focused on innovative formulations and targeted applications. Despite the positive outlook, certain challenges exist, including stringent regulatory approvals, high manufacturing costs, and potential reimbursement hurdles for enteral feeding therapies in some healthcare systems. Nevertheless, the long-term market prospects remain promising, especially in developing economies experiencing rapid healthcare infrastructure development and increased healthcare expenditure. The continued focus on innovation, personalized nutrition, and improved accessibility is expected to drive further growth in the years to come. Geographic expansion, particularly in Asia-Pacific and MEA regions, offers significant growth opportunities due to rising healthcare spending and an increase in chronic diseases.
Enteral Feeding Formula Industry: A Comprehensive Market Report (2019-2033)
This comprehensive report provides a detailed analysis of the global enteral feeding formula industry, covering market size, segmentation, growth drivers, challenges, and key players. The study period spans from 2019 to 2033, with 2025 as the base and estimated year. This report is crucial for industry stakeholders, investors, and anyone seeking a deep understanding of this vital healthcare sector. The report utilizes data from 2019-2024 (historical period) to project the market's trajectory from 2025-2033 (forecast period). Market values are expressed in Millions of USD.
Enteral Feeding Formula Industry Market Concentration & Innovation
The enteral feeding formula market exhibits moderate concentration, with several multinational corporations dominating a significant portion of the global revenue. Key players such as Nestlé SA, Fresenius SE & Co KgaA (Fresenius Kabi AG), Abbott Laboratories, and Danone SA (Nutricia) are prominent examples. However, a dynamic landscape is emerging, with smaller, specialized companies and regional players increasingly contributing, driven by a focus on innovation and addressing unmet needs within specific therapeutic areas. This competitive environment is fostering a continuous evolution of product offerings and market strategies.
Several key factors influence market concentration:
- High R&D Investment: Leading companies invest substantially in research and development, creating innovative formulas tailored to specific diseases and individual patient requirements. This commitment to innovation is crucial for maintaining a competitive edge.
- Stringent Regulatory Landscape: The stringent regulatory environment for medical food products acts as a significant barrier to entry for new players, protecting the established market share of larger corporations.
- Robust Distribution Networks: Established players benefit from extensive and well-established distribution networks, providing them with a considerable competitive advantage in terms of market reach and accessibility.
- Strategic Mergers & Acquisitions (M&A): Market dynamics are significantly shaped by consolidation through mergers and acquisitions, particularly those within the multi-million dollar range observed in recent years. For example, the acquisition of Company X by Company Y in 2022 (for xx Million USD) demonstrably altered the market share distribution.
Innovation within the industry is propelled by:
- Advancements in Nutrition Science: The continuous advancement of nutrition science fuels the development of specialized formulas designed to address specific nutritional deficiencies and disease states, leading to more targeted and effective therapeutic interventions.
- Technological Improvements: Ongoing improvements in manufacturing processes, packaging technologies, and delivery systems enhance product quality, convenience, and overall patient experience. This is leading to more efficient and user-friendly products.
- Patient-Centric Product Development: A growing emphasis is placed on developing products that prioritize palatability, ease of administration, and improved patient outcomes, thus enhancing patient adherence and satisfaction.
Enteral Feeding Formula Industry Industry Trends & Insights
The global enteral feeding formula market is experiencing robust growth, driven by several key factors. The increasing prevalence of chronic diseases like diabetes, oncology, and neurological disorders fuels demand for specialized formulas. Technological advancements have led to the development of innovative formulations, including those with improved palatability and nutrient profiles. The aging global population also contributes to market expansion, as older adults are more prone to needing enteral nutrition. Further contributing to growth is the increasing awareness among healthcare professionals and consumers regarding the benefits of enteral nutrition. Market penetration is estimated to reach xx% by 2033. CAGR for the forecast period (2025-2033) is projected at xx%. Competition is intensifying with both established players and new entrants focusing on product differentiation and expanding distribution channels. The rise of personalized nutrition and the demand for convenient, ready-to-use formulas are also shaping market trends. These factors collectively indicate a high growth trajectory for the coming decade, reaching an estimated market value of xx Million USD by 2033.
Dominant Markets & Segments in Enteral Feeding Formula Industry
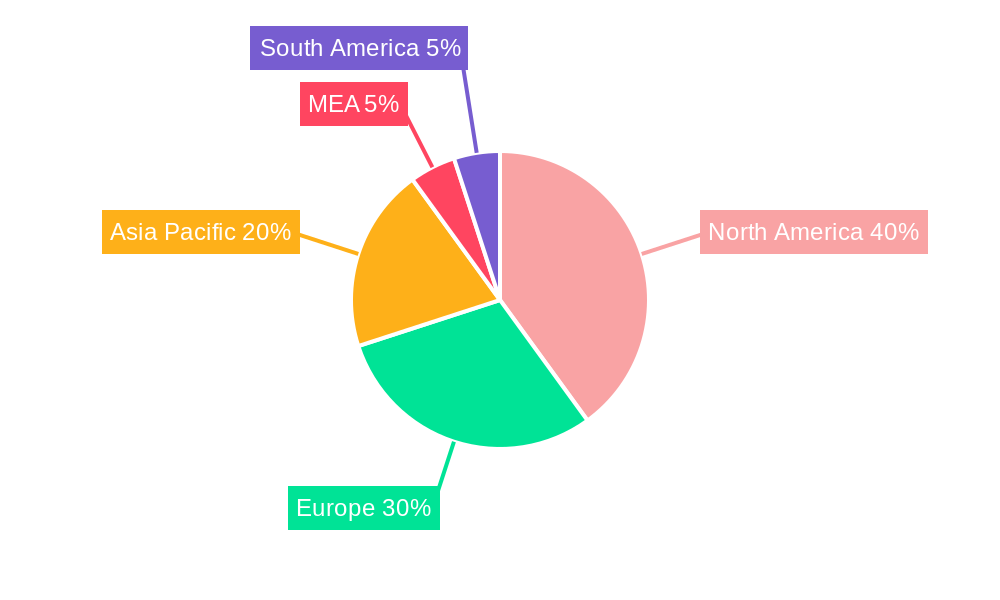
The enteral feeding formula market exhibits regional variations in growth. North America currently holds a dominant position, driven by high healthcare expenditure and a large aging population. However, Asia-Pacific is expected to witness the fastest growth rate during the forecast period, fuelled by rising healthcare awareness, increasing disposable incomes, and a growing prevalence of chronic diseases.
Key Drivers:
By Product: Disease-specific formulas are a rapidly growing segment, driven by the rising incidence of chronic illnesses. Standard formulas remain a significant market share, catering to general nutritional needs.
By Application: Oncology and critical care are high-growth application segments, reflecting the increasing demand for specialized nutritional support in these areas.
By End User: Hospitals remain the largest end-user segment, but the home care segment is experiencing strong growth, driven by a preference for at-home care and advancements in home-based enteral feeding systems.
By Distribution Channel: Hospitals are the primary distribution channel, but retail and online pharmacies are emerging as important channels, improving product accessibility.
Dominance Analysis: While North America currently leads in market value, the Asia-Pacific region's strong growth trajectory, underpinned by factors such as increasing healthcare expenditure and rising prevalence of chronic diseases, suggests it will gain significant market share in the coming years. This is further supported by the growing adoption of advanced medical technologies and the expansion of healthcare infrastructure in the region.
Enteral Feeding Formula Industry Product Developments
Recent innovations focus on improved palatability, enhanced nutrient density, and specialized formulations for specific diseases. The market is witnessing a shift towards ready-to-use, convenient formats and plant-based options. Technological advancements in formula design and manufacturing processes are enhancing product stability, shelf-life, and overall quality. This includes the development of formulas with improved digestibility and absorption, catering to patients with specific nutritional needs. These improvements are driving market growth and catering to the increasing demand for customized nutritional solutions.
Report Scope & Segmentation Analysis
This report provides a comprehensive analysis of the enteral feeding formula market, segmented by:
By Product: Standard Formulas (market size xx Million USD in 2025, projected growth xx%), Disease-specific Formulas (market size xx Million USD in 2025, projected growth xx%).
By Application: Oncology (market size xx Million USD in 2025, projected growth xx%), Neurology (market size xx Million USD in 2025, projected growth xx%), Critical Care (market size xx Million USD in 2025, projected growth xx%), Diabetes (market size xx Million USD in 2025, projected growth xx%), Gastroenterology (market size xx Million USD in 2025, projected growth xx%), Other Applications (market size xx Million USD in 2025, projected growth xx%).
By End User: Hospital (market size xx Million USD in 2025, projected growth xx%), Home Care Agencies and Hospices (market size xx Million USD in 2025, projected growth xx%), Other End Users (market size xx Million USD in 2025, projected growth xx%).
By Distribution Channel: Hospitals (market size xx Million USD in 2025, projected growth xx%), Retail Pharmacies (market size xx Million USD in 2025, projected growth xx%), Online Pharmacies (market size xx Million USD in 2025, projected growth xx%).
Key Drivers of Enteral Feeding Formula Industry Growth
Several factors are driving market growth, including:
- Rising prevalence of chronic diseases: The increasing incidence of conditions requiring specialized nutritional support is a major driver.
- Aging global population: Older adults are more susceptible to malnutrition and require enteral feeding.
- Technological advancements: Innovations in formula design and delivery systems are improving product quality and convenience.
- Increased healthcare expenditure: Growing investments in healthcare infrastructure and services are fueling market expansion.
Challenges in the Enteral Feeding Formula Industry Sector
The industry faces challenges such as:
- Stringent regulatory requirements: Meeting regulatory standards adds to the cost and complexity of product development and launch.
- Supply chain disruptions: Global events can impact the availability of raw materials and packaging.
- Intense competition: The market is characterized by fierce competition among established players and new entrants.
- Price sensitivity: Healthcare payers are often sensitive to pricing, impacting profitability. This can lead to challenges in sustaining profitability, especially for specialized formulas.
Emerging Opportunities in Enteral Feeding Formula Industry
Opportunities exist in:
- Personalized nutrition: Tailored formulas catering to individual patient needs are gaining traction.
- Plant-based formulations: Demand for plant-based options is growing, aligning with evolving consumer preferences.
- Advanced delivery systems: Innovations in delivery systems are enhancing convenience and efficacy.
- Expansion into emerging markets: Developing economies present significant growth potential.
Leading Players in the Enteral Feeding Formula Industry Market
- Nestle SA
- Fresenius SE & Co KgaA (Fresenius Kabi AG)
- Meiji Holdings Co Ltd
- Global Health Product Inc
- Abbott Laboratories
- Danone SA (Nutricia)
- Functional Formularies
- Hormel Foods Corporation
- B Braun Melsungen AG
- Victus Inc
- Reckitt Benckiser Group plc (Mead Johnson)
- Kate Farms
Key Developments in Enteral Feeding Formula Industry Industry
- September 2022: Kate Farms raised USD 75 Million in a Series C funding round, boosting its R&D and market expansion efforts. This significant investment highlights investor confidence in the plant-based enteral nutrition segment and Kate Farms' potential for growth.
- September 2022: Kate Farms launched Adult Standard 1.4, a high-calorie formula, expanding its product portfolio and catering to a wider range of patient needs. The launch of a chocolate-flavored option demonstrates a focus on improved palatability and patient acceptance.
Strategic Outlook for Enteral Feeding Formula Industry Market
The enteral feeding formula market is poised for continued growth, driven by several factors. These include the increasing prevalence of chronic diseases, an aging global population, and ongoing technological advancements in formula design and delivery systems. Opportunities abound in personalized nutrition, plant-based products, and expanding into new markets, presenting considerable potential for both established players and new entrants. Companies that can effectively address the challenges of regulatory hurdles and price sensitivity while successfully innovating will be best positioned to capitalize on this market's potential for substantial growth in the coming years.
Enteral Feeding Formula Industry Segmentation
-
1. Product
- 1.1. Standard Formulas
- 1.2. Disease-specific Formulas
-
2. Application
- 2.1. Oncology
- 2.2. Neurology
- 2.3. Critical Care
- 2.4. Diabetes
- 2.5. Gastroenterology
- 2.6. Other Applications
-
3. End User
- 3.1. Hospital
- 3.2. Home Care Agencies and Hospices
- 3.3. Other End Users
-
4. Distributuion Channel
- 4.1. Hospitals
- 4.2. Retail Pharmacies
- 4.3. Online Pharmacies
Enteral Feeding Formula Industry Segmentation By Geography
-
1. North America
- 1.1. United States
- 1.2. Canada
- 1.3. Mexico
-
2. Europe
- 2.1. Germany
- 2.2. United Kingdom
- 2.3. France
- 2.4. Italy
- 2.5. Spain
- 2.6. Rest of Europe
-
3. Asia Pacific
- 3.1. China
- 3.2. Japan
- 3.3. India
- 3.4. Australia
- 3.5. South Korea
- 3.6. Rest of Asia Pacific
-
4. Middle East and Africa
- 4.1. GCC
- 4.2. South Africa
- 4.3. Rest of Middle East and Africa
-
5. South America
- 5.1. Brazil
- 5.2. Argentina
- 5.3. Rest of South America
Enteral Feeding Formula Industry REPORT HIGHLIGHTS
| Aspects | Details |
|---|---|
| Study Period | 2019-2033 |
| Base Year | 2024 |
| Estimated Year | 2025 |
| Forecast Period | 2025-2033 |
| Historical Period | 2019-2024 |
| Growth Rate | CAGR of 5.18% from 2019-2033 |
| Segmentation |
|
Table of Contents
- 1. Introduction
- 1.1. Research Scope
- 1.2. Market Segmentation
- 1.3. Research Methodology
- 1.4. Definitions and Assumptions
- 2. Executive Summary
- 2.1. Introduction
- 3. Market Dynamics
- 3.1. Introduction
- 3.2. Market Drivers
- 3.2.1. Increasing Prevalence of Metabolic and Chronic Diseases; Increasing Spending on Patient Care; Growing Geriatric Population
- 3.3. Market Restrains
- 3.3.1. Complications Associated with Enteral Nutrition; High Cost and Low Adherence Rates in Developing Countries
- 3.4. Market Trends
- 3.4.1. Oncology Segment is Expected to Hold a Significant Market Share in the Enteral Feeding Formulas Market
- 4. Market Factor Analysis
- 4.1. Porters Five Forces
- 4.2. Supply/Value Chain
- 4.3. PESTEL analysis
- 4.4. Market Entropy
- 4.5. Patent/Trademark Analysis
- 5. Global Enteral Feeding Formula Industry Analysis, Insights and Forecast, 2019-2031
- 5.1. Market Analysis, Insights and Forecast - by Product
- 5.1.1. Standard Formulas
- 5.1.2. Disease-specific Formulas
- 5.2. Market Analysis, Insights and Forecast - by Application
- 5.2.1. Oncology
- 5.2.2. Neurology
- 5.2.3. Critical Care
- 5.2.4. Diabetes
- 5.2.5. Gastroenterology
- 5.2.6. Other Applications
- 5.3. Market Analysis, Insights and Forecast - by End User
- 5.3.1. Hospital
- 5.3.2. Home Care Agencies and Hospices
- 5.3.3. Other End Users
- 5.4. Market Analysis, Insights and Forecast - by Distributuion Channel
- 5.4.1. Hospitals
- 5.4.2. Retail Pharmacies
- 5.4.3. Online Pharmacies
- 5.5. Market Analysis, Insights and Forecast - by Region
- 5.5.1. North America
- 5.5.2. Europe
- 5.5.3. Asia Pacific
- 5.5.4. Middle East and Africa
- 5.5.5. South America
- 5.1. Market Analysis, Insights and Forecast - by Product
- 6. North America Enteral Feeding Formula Industry Analysis, Insights and Forecast, 2019-2031
- 6.1. Market Analysis, Insights and Forecast - by Product
- 6.1.1. Standard Formulas
- 6.1.2. Disease-specific Formulas
- 6.2. Market Analysis, Insights and Forecast - by Application
- 6.2.1. Oncology
- 6.2.2. Neurology
- 6.2.3. Critical Care
- 6.2.4. Diabetes
- 6.2.5. Gastroenterology
- 6.2.6. Other Applications
- 6.3. Market Analysis, Insights and Forecast - by End User
- 6.3.1. Hospital
- 6.3.2. Home Care Agencies and Hospices
- 6.3.3. Other End Users
- 6.4. Market Analysis, Insights and Forecast - by Distributuion Channel
- 6.4.1. Hospitals
- 6.4.2. Retail Pharmacies
- 6.4.3. Online Pharmacies
- 6.1. Market Analysis, Insights and Forecast - by Product
- 7. Europe Enteral Feeding Formula Industry Analysis, Insights and Forecast, 2019-2031
- 7.1. Market Analysis, Insights and Forecast - by Product
- 7.1.1. Standard Formulas
- 7.1.2. Disease-specific Formulas
- 7.2. Market Analysis, Insights and Forecast - by Application
- 7.2.1. Oncology
- 7.2.2. Neurology
- 7.2.3. Critical Care
- 7.2.4. Diabetes
- 7.2.5. Gastroenterology
- 7.2.6. Other Applications
- 7.3. Market Analysis, Insights and Forecast - by End User
- 7.3.1. Hospital
- 7.3.2. Home Care Agencies and Hospices
- 7.3.3. Other End Users
- 7.4. Market Analysis, Insights and Forecast - by Distributuion Channel
- 7.4.1. Hospitals
- 7.4.2. Retail Pharmacies
- 7.4.3. Online Pharmacies
- 7.1. Market Analysis, Insights and Forecast - by Product
- 8. Asia Pacific Enteral Feeding Formula Industry Analysis, Insights and Forecast, 2019-2031
- 8.1. Market Analysis, Insights and Forecast - by Product
- 8.1.1. Standard Formulas
- 8.1.2. Disease-specific Formulas
- 8.2. Market Analysis, Insights and Forecast - by Application
- 8.2.1. Oncology
- 8.2.2. Neurology
- 8.2.3. Critical Care
- 8.2.4. Diabetes
- 8.2.5. Gastroenterology
- 8.2.6. Other Applications
- 8.3. Market Analysis, Insights and Forecast - by End User
- 8.3.1. Hospital
- 8.3.2. Home Care Agencies and Hospices
- 8.3.3. Other End Users
- 8.4. Market Analysis, Insights and Forecast - by Distributuion Channel
- 8.4.1. Hospitals
- 8.4.2. Retail Pharmacies
- 8.4.3. Online Pharmacies
- 8.1. Market Analysis, Insights and Forecast - by Product
- 9. Middle East and Africa Enteral Feeding Formula Industry Analysis, Insights and Forecast, 2019-2031
- 9.1. Market Analysis, Insights and Forecast - by Product
- 9.1.1. Standard Formulas
- 9.1.2. Disease-specific Formulas
- 9.2. Market Analysis, Insights and Forecast - by Application
- 9.2.1. Oncology
- 9.2.2. Neurology
- 9.2.3. Critical Care
- 9.2.4. Diabetes
- 9.2.5. Gastroenterology
- 9.2.6. Other Applications
- 9.3. Market Analysis, Insights and Forecast - by End User
- 9.3.1. Hospital
- 9.3.2. Home Care Agencies and Hospices
- 9.3.3. Other End Users
- 9.4. Market Analysis, Insights and Forecast - by Distributuion Channel
- 9.4.1. Hospitals
- 9.4.2. Retail Pharmacies
- 9.4.3. Online Pharmacies
- 9.1. Market Analysis, Insights and Forecast - by Product
- 10. South America Enteral Feeding Formula Industry Analysis, Insights and Forecast, 2019-2031
- 10.1. Market Analysis, Insights and Forecast - by Product
- 10.1.1. Standard Formulas
- 10.1.2. Disease-specific Formulas
- 10.2. Market Analysis, Insights and Forecast - by Application
- 10.2.1. Oncology
- 10.2.2. Neurology
- 10.2.3. Critical Care
- 10.2.4. Diabetes
- 10.2.5. Gastroenterology
- 10.2.6. Other Applications
- 10.3. Market Analysis, Insights and Forecast - by End User
- 10.3.1. Hospital
- 10.3.2. Home Care Agencies and Hospices
- 10.3.3. Other End Users
- 10.4. Market Analysis, Insights and Forecast - by Distributuion Channel
- 10.4.1. Hospitals
- 10.4.2. Retail Pharmacies
- 10.4.3. Online Pharmacies
- 10.1. Market Analysis, Insights and Forecast - by Product
- 11. North America Enteral Feeding Formula Industry Analysis, Insights and Forecast, 2019-2031
- 11.1. Market Analysis, Insights and Forecast - By Country/Sub-region
- 11.1.1 United States
- 11.1.2 Canada
- 11.1.3 Mexico
- 12. South America Enteral Feeding Formula Industry Analysis, Insights and Forecast, 2019-2031
- 12.1. Market Analysis, Insights and Forecast - By Country/Sub-region
- 12.1.1 Brazil
- 12.1.2 Mexico
- 12.1.3 Rest of South America
- 13. Europe Enteral Feeding Formula Industry Analysis, Insights and Forecast, 2019-2031
- 13.1. Market Analysis, Insights and Forecast - By Country/Sub-region
- 13.1.1 United Kingdom
- 13.1.2 Germany
- 13.1.3 France
- 13.1.4 Italy
- 13.1.5 Spain
- 13.1.6 Russia
- 13.1.7 Rest of Europe
- 14. Asia Pacific Enteral Feeding Formula Industry Analysis, Insights and Forecast, 2019-2031
- 14.1. Market Analysis, Insights and Forecast - By Country/Sub-region
- 14.1.1 China
- 14.1.2 Japan
- 14.1.3 India
- 14.1.4 South Korea
- 14.1.5 Taiwan
- 14.1.6 Australia
- 14.1.7 Rest of Asia-Pacific
- 15. MEA Enteral Feeding Formula Industry Analysis, Insights and Forecast, 2019-2031
- 15.1. Market Analysis, Insights and Forecast - By Country/Sub-region
- 15.1.1 Middle East
- 15.1.2 Africa
- 16. Competitive Analysis
- 16.1. Global Market Share Analysis 2024
- 16.2. Company Profiles
- 16.2.1 Nestle SA
- 16.2.1.1. Overview
- 16.2.1.2. Products
- 16.2.1.3. SWOT Analysis
- 16.2.1.4. Recent Developments
- 16.2.1.5. Financials (Based on Availability)
- 16.2.2 Fresenius SE & Co KgaA (Fresenius Kabi AG)
- 16.2.2.1. Overview
- 16.2.2.2. Products
- 16.2.2.3. SWOT Analysis
- 16.2.2.4. Recent Developments
- 16.2.2.5. Financials (Based on Availability)
- 16.2.3 Meiji Holdings Co Ltd
- 16.2.3.1. Overview
- 16.2.3.2. Products
- 16.2.3.3. SWOT Analysis
- 16.2.3.4. Recent Developments
- 16.2.3.5. Financials (Based on Availability)
- 16.2.4 Global Health Product Inc
- 16.2.4.1. Overview
- 16.2.4.2. Products
- 16.2.4.3. SWOT Analysis
- 16.2.4.4. Recent Developments
- 16.2.4.5. Financials (Based on Availability)
- 16.2.5 Abbott Laboratories
- 16.2.5.1. Overview
- 16.2.5.2. Products
- 16.2.5.3. SWOT Analysis
- 16.2.5.4. Recent Developments
- 16.2.5.5. Financials (Based on Availability)
- 16.2.6 Danone SA (Nutricia)
- 16.2.6.1. Overview
- 16.2.6.2. Products
- 16.2.6.3. SWOT Analysis
- 16.2.6.4. Recent Developments
- 16.2.6.5. Financials (Based on Availability)
- 16.2.7 Functional Formularies*List Not Exhaustive
- 16.2.7.1. Overview
- 16.2.7.2. Products
- 16.2.7.3. SWOT Analysis
- 16.2.7.4. Recent Developments
- 16.2.7.5. Financials (Based on Availability)
- 16.2.8 Hormel Foods Corporation
- 16.2.8.1. Overview
- 16.2.8.2. Products
- 16.2.8.3. SWOT Analysis
- 16.2.8.4. Recent Developments
- 16.2.8.5. Financials (Based on Availability)
- 16.2.9 B Braun Melsungen AG
- 16.2.9.1. Overview
- 16.2.9.2. Products
- 16.2.9.3. SWOT Analysis
- 16.2.9.4. Recent Developments
- 16.2.9.5. Financials (Based on Availability)
- 16.2.10 Victus Inc
- 16.2.10.1. Overview
- 16.2.10.2. Products
- 16.2.10.3. SWOT Analysis
- 16.2.10.4. Recent Developments
- 16.2.10.5. Financials (Based on Availability)
- 16.2.11 Reckitt Benckiser Group plc (Mead Johnson)
- 16.2.11.1. Overview
- 16.2.11.2. Products
- 16.2.11.3. SWOT Analysis
- 16.2.11.4. Recent Developments
- 16.2.11.5. Financials (Based on Availability)
- 16.2.12 Kate Farms
- 16.2.12.1. Overview
- 16.2.12.2. Products
- 16.2.12.3. SWOT Analysis
- 16.2.12.4. Recent Developments
- 16.2.12.5. Financials (Based on Availability)
- 16.2.1 Nestle SA
List of Figures
- Figure 1: Global Enteral Feeding Formula Industry Revenue Breakdown (Million, %) by Region 2024 & 2032
- Figure 2: North America Enteral Feeding Formula Industry Revenue (Million), by Country 2024 & 2032
- Figure 3: North America Enteral Feeding Formula Industry Revenue Share (%), by Country 2024 & 2032
- Figure 4: South America Enteral Feeding Formula Industry Revenue (Million), by Country 2024 & 2032
- Figure 5: South America Enteral Feeding Formula Industry Revenue Share (%), by Country 2024 & 2032
- Figure 6: Europe Enteral Feeding Formula Industry Revenue (Million), by Country 2024 & 2032
- Figure 7: Europe Enteral Feeding Formula Industry Revenue Share (%), by Country 2024 & 2032
- Figure 8: Asia Pacific Enteral Feeding Formula Industry Revenue (Million), by Country 2024 & 2032
- Figure 9: Asia Pacific Enteral Feeding Formula Industry Revenue Share (%), by Country 2024 & 2032
- Figure 10: MEA Enteral Feeding Formula Industry Revenue (Million), by Country 2024 & 2032
- Figure 11: MEA Enteral Feeding Formula Industry Revenue Share (%), by Country 2024 & 2032
- Figure 12: North America Enteral Feeding Formula Industry Revenue (Million), by Product 2024 & 2032
- Figure 13: North America Enteral Feeding Formula Industry Revenue Share (%), by Product 2024 & 2032
- Figure 14: North America Enteral Feeding Formula Industry Revenue (Million), by Application 2024 & 2032
- Figure 15: North America Enteral Feeding Formula Industry Revenue Share (%), by Application 2024 & 2032
- Figure 16: North America Enteral Feeding Formula Industry Revenue (Million), by End User 2024 & 2032
- Figure 17: North America Enteral Feeding Formula Industry Revenue Share (%), by End User 2024 & 2032
- Figure 18: North America Enteral Feeding Formula Industry Revenue (Million), by Distributuion Channel 2024 & 2032
- Figure 19: North America Enteral Feeding Formula Industry Revenue Share (%), by Distributuion Channel 2024 & 2032
- Figure 20: North America Enteral Feeding Formula Industry Revenue (Million), by Country 2024 & 2032
- Figure 21: North America Enteral Feeding Formula Industry Revenue Share (%), by Country 2024 & 2032
- Figure 22: Europe Enteral Feeding Formula Industry Revenue (Million), by Product 2024 & 2032
- Figure 23: Europe Enteral Feeding Formula Industry Revenue Share (%), by Product 2024 & 2032
- Figure 24: Europe Enteral Feeding Formula Industry Revenue (Million), by Application 2024 & 2032
- Figure 25: Europe Enteral Feeding Formula Industry Revenue Share (%), by Application 2024 & 2032
- Figure 26: Europe Enteral Feeding Formula Industry Revenue (Million), by End User 2024 & 2032
- Figure 27: Europe Enteral Feeding Formula Industry Revenue Share (%), by End User 2024 & 2032
- Figure 28: Europe Enteral Feeding Formula Industry Revenue (Million), by Distributuion Channel 2024 & 2032
- Figure 29: Europe Enteral Feeding Formula Industry Revenue Share (%), by Distributuion Channel 2024 & 2032
- Figure 30: Europe Enteral Feeding Formula Industry Revenue (Million), by Country 2024 & 2032
- Figure 31: Europe Enteral Feeding Formula Industry Revenue Share (%), by Country 2024 & 2032
- Figure 32: Asia Pacific Enteral Feeding Formula Industry Revenue (Million), by Product 2024 & 2032
- Figure 33: Asia Pacific Enteral Feeding Formula Industry Revenue Share (%), by Product 2024 & 2032
- Figure 34: Asia Pacific Enteral Feeding Formula Industry Revenue (Million), by Application 2024 & 2032
- Figure 35: Asia Pacific Enteral Feeding Formula Industry Revenue Share (%), by Application 2024 & 2032
- Figure 36: Asia Pacific Enteral Feeding Formula Industry Revenue (Million), by End User 2024 & 2032
- Figure 37: Asia Pacific Enteral Feeding Formula Industry Revenue Share (%), by End User 2024 & 2032
- Figure 38: Asia Pacific Enteral Feeding Formula Industry Revenue (Million), by Distributuion Channel 2024 & 2032
- Figure 39: Asia Pacific Enteral Feeding Formula Industry Revenue Share (%), by Distributuion Channel 2024 & 2032
- Figure 40: Asia Pacific Enteral Feeding Formula Industry Revenue (Million), by Country 2024 & 2032
- Figure 41: Asia Pacific Enteral Feeding Formula Industry Revenue Share (%), by Country 2024 & 2032
- Figure 42: Middle East and Africa Enteral Feeding Formula Industry Revenue (Million), by Product 2024 & 2032
- Figure 43: Middle East and Africa Enteral Feeding Formula Industry Revenue Share (%), by Product 2024 & 2032
- Figure 44: Middle East and Africa Enteral Feeding Formula Industry Revenue (Million), by Application 2024 & 2032
- Figure 45: Middle East and Africa Enteral Feeding Formula Industry Revenue Share (%), by Application 2024 & 2032
- Figure 46: Middle East and Africa Enteral Feeding Formula Industry Revenue (Million), by End User 2024 & 2032
- Figure 47: Middle East and Africa Enteral Feeding Formula Industry Revenue Share (%), by End User 2024 & 2032
- Figure 48: Middle East and Africa Enteral Feeding Formula Industry Revenue (Million), by Distributuion Channel 2024 & 2032
- Figure 49: Middle East and Africa Enteral Feeding Formula Industry Revenue Share (%), by Distributuion Channel 2024 & 2032
- Figure 50: Middle East and Africa Enteral Feeding Formula Industry Revenue (Million), by Country 2024 & 2032
- Figure 51: Middle East and Africa Enteral Feeding Formula Industry Revenue Share (%), by Country 2024 & 2032
- Figure 52: South America Enteral Feeding Formula Industry Revenue (Million), by Product 2024 & 2032
- Figure 53: South America Enteral Feeding Formula Industry Revenue Share (%), by Product 2024 & 2032
- Figure 54: South America Enteral Feeding Formula Industry Revenue (Million), by Application 2024 & 2032
- Figure 55: South America Enteral Feeding Formula Industry Revenue Share (%), by Application 2024 & 2032
- Figure 56: South America Enteral Feeding Formula Industry Revenue (Million), by End User 2024 & 2032
- Figure 57: South America Enteral Feeding Formula Industry Revenue Share (%), by End User 2024 & 2032
- Figure 58: South America Enteral Feeding Formula Industry Revenue (Million), by Distributuion Channel 2024 & 2032
- Figure 59: South America Enteral Feeding Formula Industry Revenue Share (%), by Distributuion Channel 2024 & 2032
- Figure 60: South America Enteral Feeding Formula Industry Revenue (Million), by Country 2024 & 2032
- Figure 61: South America Enteral Feeding Formula Industry Revenue Share (%), by Country 2024 & 2032
List of Tables
- Table 1: Global Enteral Feeding Formula Industry Revenue Million Forecast, by Region 2019 & 2032
- Table 2: Global Enteral Feeding Formula Industry Revenue Million Forecast, by Product 2019 & 2032
- Table 3: Global Enteral Feeding Formula Industry Revenue Million Forecast, by Application 2019 & 2032
- Table 4: Global Enteral Feeding Formula Industry Revenue Million Forecast, by End User 2019 & 2032
- Table 5: Global Enteral Feeding Formula Industry Revenue Million Forecast, by Distributuion Channel 2019 & 2032
- Table 6: Global Enteral Feeding Formula Industry Revenue Million Forecast, by Region 2019 & 2032
- Table 7: Global Enteral Feeding Formula Industry Revenue Million Forecast, by Country 2019 & 2032
- Table 8: United States Enteral Feeding Formula Industry Revenue (Million) Forecast, by Application 2019 & 2032
- Table 9: Canada Enteral Feeding Formula Industry Revenue (Million) Forecast, by Application 2019 & 2032
- Table 10: Mexico Enteral Feeding Formula Industry Revenue (Million) Forecast, by Application 2019 & 2032
- Table 11: Global Enteral Feeding Formula Industry Revenue Million Forecast, by Country 2019 & 2032
- Table 12: Brazil Enteral Feeding Formula Industry Revenue (Million) Forecast, by Application 2019 & 2032
- Table 13: Mexico Enteral Feeding Formula Industry Revenue (Million) Forecast, by Application 2019 & 2032
- Table 14: Rest of South America Enteral Feeding Formula Industry Revenue (Million) Forecast, by Application 2019 & 2032
- Table 15: Global Enteral Feeding Formula Industry Revenue Million Forecast, by Country 2019 & 2032
- Table 16: United Kingdom Enteral Feeding Formula Industry Revenue (Million) Forecast, by Application 2019 & 2032
- Table 17: Germany Enteral Feeding Formula Industry Revenue (Million) Forecast, by Application 2019 & 2032
- Table 18: France Enteral Feeding Formula Industry Revenue (Million) Forecast, by Application 2019 & 2032
- Table 19: Italy Enteral Feeding Formula Industry Revenue (Million) Forecast, by Application 2019 & 2032
- Table 20: Spain Enteral Feeding Formula Industry Revenue (Million) Forecast, by Application 2019 & 2032
- Table 21: Russia Enteral Feeding Formula Industry Revenue (Million) Forecast, by Application 2019 & 2032
- Table 22: Rest of Europe Enteral Feeding Formula Industry Revenue (Million) Forecast, by Application 2019 & 2032
- Table 23: Global Enteral Feeding Formula Industry Revenue Million Forecast, by Country 2019 & 2032
- Table 24: China Enteral Feeding Formula Industry Revenue (Million) Forecast, by Application 2019 & 2032
- Table 25: Japan Enteral Feeding Formula Industry Revenue (Million) Forecast, by Application 2019 & 2032
- Table 26: India Enteral Feeding Formula Industry Revenue (Million) Forecast, by Application 2019 & 2032
- Table 27: South Korea Enteral Feeding Formula Industry Revenue (Million) Forecast, by Application 2019 & 2032
- Table 28: Taiwan Enteral Feeding Formula Industry Revenue (Million) Forecast, by Application 2019 & 2032
- Table 29: Australia Enteral Feeding Formula Industry Revenue (Million) Forecast, by Application 2019 & 2032
- Table 30: Rest of Asia-Pacific Enteral Feeding Formula Industry Revenue (Million) Forecast, by Application 2019 & 2032
- Table 31: Global Enteral Feeding Formula Industry Revenue Million Forecast, by Country 2019 & 2032
- Table 32: Middle East Enteral Feeding Formula Industry Revenue (Million) Forecast, by Application 2019 & 2032
- Table 33: Africa Enteral Feeding Formula Industry Revenue (Million) Forecast, by Application 2019 & 2032
- Table 34: Global Enteral Feeding Formula Industry Revenue Million Forecast, by Product 2019 & 2032
- Table 35: Global Enteral Feeding Formula Industry Revenue Million Forecast, by Application 2019 & 2032
- Table 36: Global Enteral Feeding Formula Industry Revenue Million Forecast, by End User 2019 & 2032
- Table 37: Global Enteral Feeding Formula Industry Revenue Million Forecast, by Distributuion Channel 2019 & 2032
- Table 38: Global Enteral Feeding Formula Industry Revenue Million Forecast, by Country 2019 & 2032
- Table 39: United States Enteral Feeding Formula Industry Revenue (Million) Forecast, by Application 2019 & 2032
- Table 40: Canada Enteral Feeding Formula Industry Revenue (Million) Forecast, by Application 2019 & 2032
- Table 41: Mexico Enteral Feeding Formula Industry Revenue (Million) Forecast, by Application 2019 & 2032
- Table 42: Global Enteral Feeding Formula Industry Revenue Million Forecast, by Product 2019 & 2032
- Table 43: Global Enteral Feeding Formula Industry Revenue Million Forecast, by Application 2019 & 2032
- Table 44: Global Enteral Feeding Formula Industry Revenue Million Forecast, by End User 2019 & 2032
- Table 45: Global Enteral Feeding Formula Industry Revenue Million Forecast, by Distributuion Channel 2019 & 2032
- Table 46: Global Enteral Feeding Formula Industry Revenue Million Forecast, by Country 2019 & 2032
- Table 47: Germany Enteral Feeding Formula Industry Revenue (Million) Forecast, by Application 2019 & 2032
- Table 48: United Kingdom Enteral Feeding Formula Industry Revenue (Million) Forecast, by Application 2019 & 2032
- Table 49: France Enteral Feeding Formula Industry Revenue (Million) Forecast, by Application 2019 & 2032
- Table 50: Italy Enteral Feeding Formula Industry Revenue (Million) Forecast, by Application 2019 & 2032
- Table 51: Spain Enteral Feeding Formula Industry Revenue (Million) Forecast, by Application 2019 & 2032
- Table 52: Rest of Europe Enteral Feeding Formula Industry Revenue (Million) Forecast, by Application 2019 & 2032
- Table 53: Global Enteral Feeding Formula Industry Revenue Million Forecast, by Product 2019 & 2032
- Table 54: Global Enteral Feeding Formula Industry Revenue Million Forecast, by Application 2019 & 2032
- Table 55: Global Enteral Feeding Formula Industry Revenue Million Forecast, by End User 2019 & 2032
- Table 56: Global Enteral Feeding Formula Industry Revenue Million Forecast, by Distributuion Channel 2019 & 2032
- Table 57: Global Enteral Feeding Formula Industry Revenue Million Forecast, by Country 2019 & 2032
- Table 58: China Enteral Feeding Formula Industry Revenue (Million) Forecast, by Application 2019 & 2032
- Table 59: Japan Enteral Feeding Formula Industry Revenue (Million) Forecast, by Application 2019 & 2032
- Table 60: India Enteral Feeding Formula Industry Revenue (Million) Forecast, by Application 2019 & 2032
- Table 61: Australia Enteral Feeding Formula Industry Revenue (Million) Forecast, by Application 2019 & 2032
- Table 62: South Korea Enteral Feeding Formula Industry Revenue (Million) Forecast, by Application 2019 & 2032
- Table 63: Rest of Asia Pacific Enteral Feeding Formula Industry Revenue (Million) Forecast, by Application 2019 & 2032
- Table 64: Global Enteral Feeding Formula Industry Revenue Million Forecast, by Product 2019 & 2032
- Table 65: Global Enteral Feeding Formula Industry Revenue Million Forecast, by Application 2019 & 2032
- Table 66: Global Enteral Feeding Formula Industry Revenue Million Forecast, by End User 2019 & 2032
- Table 67: Global Enteral Feeding Formula Industry Revenue Million Forecast, by Distributuion Channel 2019 & 2032
- Table 68: Global Enteral Feeding Formula Industry Revenue Million Forecast, by Country 2019 & 2032
- Table 69: GCC Enteral Feeding Formula Industry Revenue (Million) Forecast, by Application 2019 & 2032
- Table 70: South Africa Enteral Feeding Formula Industry Revenue (Million) Forecast, by Application 2019 & 2032
- Table 71: Rest of Middle East and Africa Enteral Feeding Formula Industry Revenue (Million) Forecast, by Application 2019 & 2032
- Table 72: Global Enteral Feeding Formula Industry Revenue Million Forecast, by Product 2019 & 2032
- Table 73: Global Enteral Feeding Formula Industry Revenue Million Forecast, by Application 2019 & 2032
- Table 74: Global Enteral Feeding Formula Industry Revenue Million Forecast, by End User 2019 & 2032
- Table 75: Global Enteral Feeding Formula Industry Revenue Million Forecast, by Distributuion Channel 2019 & 2032
- Table 76: Global Enteral Feeding Formula Industry Revenue Million Forecast, by Country 2019 & 2032
- Table 77: Brazil Enteral Feeding Formula Industry Revenue (Million) Forecast, by Application 2019 & 2032
- Table 78: Argentina Enteral Feeding Formula Industry Revenue (Million) Forecast, by Application 2019 & 2032
- Table 79: Rest of South America Enteral Feeding Formula Industry Revenue (Million) Forecast, by Application 2019 & 2032
Frequently Asked Questions
1. What is the projected Compound Annual Growth Rate (CAGR) of the Enteral Feeding Formula Industry?
The projected CAGR is approximately 5.18%.
2. Which companies are prominent players in the Enteral Feeding Formula Industry?
Key companies in the market include Nestle SA, Fresenius SE & Co KgaA (Fresenius Kabi AG), Meiji Holdings Co Ltd, Global Health Product Inc, Abbott Laboratories, Danone SA (Nutricia), Functional Formularies*List Not Exhaustive, Hormel Foods Corporation, B Braun Melsungen AG, Victus Inc, Reckitt Benckiser Group plc (Mead Johnson), Kate Farms.
3. What are the main segments of the Enteral Feeding Formula Industry?
The market segments include Product, Application, End User, Distributuion Channel.
4. Can you provide details about the market size?
The market size is estimated to be USD 8.77 Million as of 2022.
5. What are some drivers contributing to market growth?
Increasing Prevalence of Metabolic and Chronic Diseases; Increasing Spending on Patient Care; Growing Geriatric Population.
6. What are the notable trends driving market growth?
Oncology Segment is Expected to Hold a Significant Market Share in the Enteral Feeding Formulas Market.
7. Are there any restraints impacting market growth?
Complications Associated with Enteral Nutrition; High Cost and Low Adherence Rates in Developing Countries.
8. Can you provide examples of recent developments in the market?
September 2022: Kate Farms raised USD 75 million in a Series C funding round led by life-science investor Novo Holdings. With this, Kate Farms will be able to increase its efforts in developing plant-based clinical nutrition research, product innovation, and development into more channels.
9. What pricing options are available for accessing the report?
Pricing options include single-user, multi-user, and enterprise licenses priced at USD 4750, USD 5250, and USD 8750 respectively.
10. Is the market size provided in terms of value or volume?
The market size is provided in terms of value, measured in Million.
11. Are there any specific market keywords associated with the report?
Yes, the market keyword associated with the report is "Enteral Feeding Formula Industry," which aids in identifying and referencing the specific market segment covered.
12. How do I determine which pricing option suits my needs best?
The pricing options vary based on user requirements and access needs. Individual users may opt for single-user licenses, while businesses requiring broader access may choose multi-user or enterprise licenses for cost-effective access to the report.
13. Are there any additional resources or data provided in the Enteral Feeding Formula Industry report?
While the report offers comprehensive insights, it's advisable to review the specific contents or supplementary materials provided to ascertain if additional resources or data are available.
14. How can I stay updated on further developments or reports in the Enteral Feeding Formula Industry?
To stay informed about further developments, trends, and reports in the Enteral Feeding Formula Industry, consider subscribing to industry newsletters, following relevant companies and organizations, or regularly checking reputable industry news sources and publications.
Methodology
Step 1 - Identification of Relevant Samples Size from Population Database


Step 2 - Approaches for Defining Global Market Size (Value, Volume* & Price*)

Note*: In applicable scenarios
Step 3 - Data Sources
Primary Research
- Web Analytics
- Survey Reports
- Research Institute
- Latest Research Reports
- Opinion Leaders
Secondary Research
- Annual Reports
- White Paper
- Latest Press Release
- Industry Association
- Paid Database
- Investor Presentations

Step 4 - Data Triangulation
Involves using different sources of information in order to increase the validity of a study
These sources are likely to be stakeholders in a program - participants, other researchers, program staff, other community members, and so on.
Then we put all data in single framework & apply various statistical tools to find out the dynamic on the market.
During the analysis stage, feedback from the stakeholder groups would be compared to determine areas of agreement as well as areas of divergence


