
Key Insights
The fumed silica market, valued at approximately $XX million in 2025, is projected to experience robust growth, exhibiting a compound annual growth rate (CAGR) of 4.83% from 2025 to 2033. This expansion is driven by several key factors. The increasing demand for high-performance materials in diverse sectors like construction, automotive, and electronics fuels the need for fumed silica's unique rheological and reinforcing properties. Growth in the Asia-Pacific region, particularly in China and India, significantly contributes to the overall market expansion due to rapid industrialization and infrastructure development. The rising adoption of fumed silica in advanced applications such as silicone rubber, plastics, and coatings further bolsters market growth. Furthermore, ongoing research and development efforts are focused on enhancing the properties of fumed silica to cater to specialized applications, leading to innovative product offerings and expanding market opportunities. The hydrophilic and hydrophobic variants cater to different needs, with hydrophilic fumed silica finding significant applications in food and beverage industries due to its ability to enhance product texture and viscosity.
However, the market faces certain challenges. Price fluctuations in raw materials, coupled with stringent environmental regulations, could pose constraints on market growth. The competitive landscape is marked by the presence of several established players, including Heraeus Holding, Evonik Industries AG, and Cabot Corporation, alongside emerging regional players, leading to intense competition. This necessitates continuous innovation and strategic partnerships to maintain a competitive edge. Nevertheless, the overall market outlook remains positive, driven by burgeoning demand in key applications and geographical regions, promising a sustained period of expansion throughout the forecast period. Further segmentation analysis into specific applications within each region will reveal more granular insights into growth potential and market share distribution.
This comprehensive report provides an in-depth analysis of the global fumed silica market, offering invaluable insights for industry stakeholders, investors, and strategic decision-makers. Covering the period from 2019 to 2033, with a base year of 2025, this report meticulously examines market trends, competitive dynamics, and future growth prospects. The report is enriched with detailed segmentation analysis, including type (hydrophilic and hydrophobic fumed silica) and application (silicone rubber, plastics and composites, food and beverages, paints and coatings, adhesives and sealants, and other applications), providing a granular understanding of the market landscape.
Fumed Silica Market Concentration & Innovation
The fumed silica market exhibits a moderately concentrated structure, with key players such as Heraeus Holding, Evonik Industries AG, Cabot Corporation, and Wacker Chemie AG holding significant market share. However, the presence of several regional and specialty players fosters competition. Market share dynamics are influenced by factors like technological innovation, pricing strategies, and geographic expansion. The market is characterized by ongoing innovation, with companies focusing on developing new grades of fumed silica with enhanced properties such as improved dispersion, rheology control, and surface modifications to cater to specific applications.
- Market Concentration: The top 5 players account for approximately xx% of the global market share (2024).
- Innovation Drivers: Demand for high-performance materials, stricter regulatory compliance, and the need for cost-effective solutions drive innovation.
- Regulatory Frameworks: Regulations related to material safety and environmental impact influence product development and market access.
- Product Substitutes: While limited, alternative materials like precipitated silica are present, posing a niche competitive threat.
- End-User Trends: Growing demand from automotive, construction, and electronics industries is driving market growth.
- M&A Activities: Recent years have witnessed several strategic mergers and acquisitions (M&A) deals in the fumed silica market, valued at approximately xx Million USD cumulatively in the period 2019-2024. These deals aimed to expand product portfolios and geographic reach.
Fumed Silica Market Industry Trends & Insights
The global fumed silica market is experiencing robust growth, fueled by increasing demand across diverse end-use industries. While precise CAGR figures require specific data referencing, the market demonstrated significant expansion during the historical period (2019-2024) and is projected to maintain a healthy growth trajectory during the forecast period (2025-2033). This growth is propelled by several key factors. Technological advancements, including the development of specialized fumed silica grades with enhanced properties like improved dispersibility, rheology control, and tailored surface functionalities, are significantly impacting market expansion. Furthermore, the rising consumer preference for high-performance and sustainable materials is a major driver. The competitive landscape remains dynamic, with established players and emerging companies actively vying for market share through strategic initiatives such as product differentiation, strategic partnerships, mergers and acquisitions, and capacity expansion. While market penetration is currently highest in developed regions, developing economies present substantial untapped growth potential, offering attractive opportunities for market expansion.
Dominant Markets & Segments in Fumed Silica Market
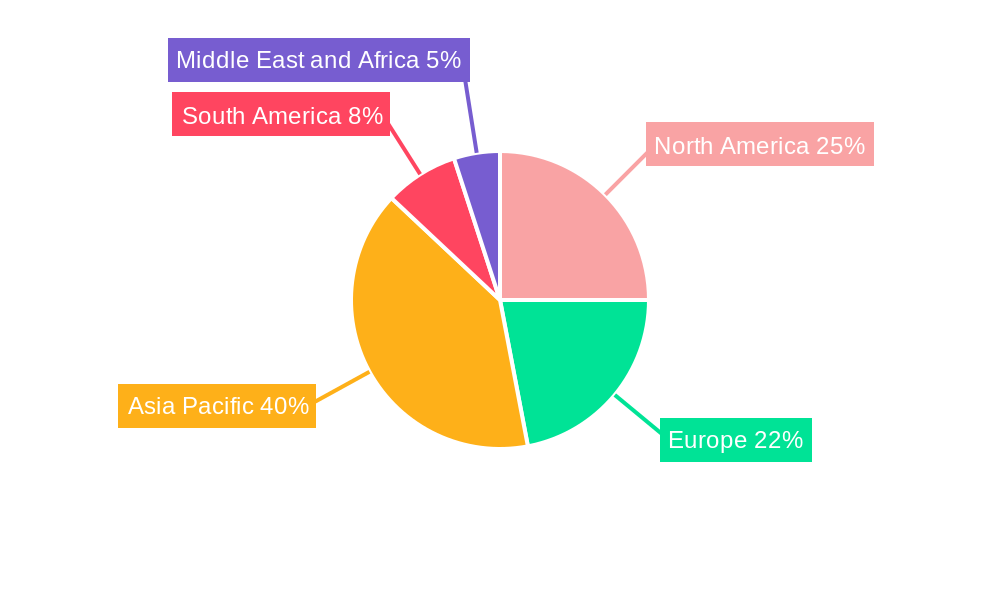
The Asia Pacific region dominates the global fumed silica market due to rapid industrialization, expanding construction activities, and burgeoning automotive and electronics sectors. Within this region, China and India are leading national markets.
Key Drivers of Regional Dominance:
- Asia Pacific: Rapid industrialization, burgeoning construction sector, rising automotive production, and growing demand for consumer goods.
- North America: Strong presence of key players, high technological advancements, and stringent regulations driving adoption of high-performance materials.
- Europe: Mature market with stable demand from various sectors.
Dominant Segments:
- Type: Hydrophobic fumed silica commands a larger market share than hydrophilic fumed silica due to its wider application scope, particularly in high-performance applications.
- Application: The paints and coatings segment holds a significant share, driven by the use of fumed silica as a rheological additive and matting agent. The plastics and composites segment is also witnessing strong growth.
Detailed dominance analysis reveals a complex interplay of factors including economic policies, infrastructure development, and consumer preferences, contributing to regional and segmental variations in market growth and share.
Fumed Silica Market Product Developments
Recent product innovations in the fumed silica market are focused on creating grades with highly tailored surface properties, optimized dispersibility, and enhanced rheological control. These advancements directly address the increasing demand for high-performance materials in diverse applications, including high-strength composites, advanced adhesives, sealants, and specialized coatings. A notable trend is the growing emphasis on environmentally friendly fumed silica production processes, reflecting the industry's increasing commitment to sustainability. This includes exploring and implementing processes that minimize waste, reduce energy consumption, and utilize more sustainable raw materials. Technological advancements are continuously improving process efficiency and facilitating the creation of novel fumed silica-based materials with enhanced functionalities and performance characteristics.
Report Scope & Segmentation Analysis
This report provides a detailed segmentation analysis of the fumed silica market across various parameters.
By Type:
- Hydrophilic Fumed Silica: This segment is projected to grow at a CAGR of xx% during the forecast period, driven by its use in various applications. The market is relatively competitive, with several established and emerging players.
- Hydrophobic Fumed Silica: This segment is projected to exhibit a CAGR of xx% during the forecast period, owing to its superior performance characteristics in specific applications. The market is characterized by high competition and continuous product innovation.
By Application:
- Silicone Rubber: Growth is driven by the expanding silicone rubber market.
- Plastics and Composites (Unsaturated Polyester Resin): Strong growth is expected due to its use as a reinforcing agent.
- Food and Beverages: Growth is driven by its use as an anticaking agent and thickener.
- Paints and Coatings (Including Inks): A significant share due to its use as a rheological additive and matting agent.
- Adhesives and Sealants: Growth is driven by its use in enhancing adhesive properties.
- Other Applications (Pharmaceutical, Personal Care, and Chemicals and Fertilizers): This segment is projected to grow at xx% CAGR due to rising demand for advanced materials.
Key Drivers of Fumed Silica Market Growth
Several factors drive the growth of the fumed silica market. Technological advancements leading to improved product performance and versatility are key. Growing demand from key end-use sectors like construction, automotive, and electronics also contribute significantly. Favorable economic conditions in several regions stimulate market expansion, while supportive government policies promoting industrial growth further enhance market dynamics. Furthermore, the increasing adoption of fumed silica in new applications and regions propels market growth.
Challenges in the Fumed Silica Market Sector
The fumed silica market faces several challenges. Fluctuations in raw material prices can significantly impact production costs and profitability. Stringent environmental regulations necessitate adoption of sustainable manufacturing practices, adding to operational complexity and expenses. Intense competition among numerous players requires strategic differentiation and continuous innovation to maintain market share. Supply chain disruptions can affect production and timely delivery, impacting customer satisfaction.
Emerging Opportunities in Fumed Silica Market
The fumed silica market presents numerous emerging opportunities. The burgeoning adoption of advanced materials in high-tech applications, such as 5G networks, electric vehicles, and renewable energy technologies, is creating significant demand for specialized fumed silica grades with unique properties. The increasing focus on sustainable and eco-friendly product development strategies presents substantial opportunities for companies to innovate and differentiate themselves, capturing significant market share by offering environmentally conscious solutions. Expansion into new geographic markets, particularly in rapidly developing economies, offers considerable growth potential, as these regions experience increasing industrialization and infrastructure development.
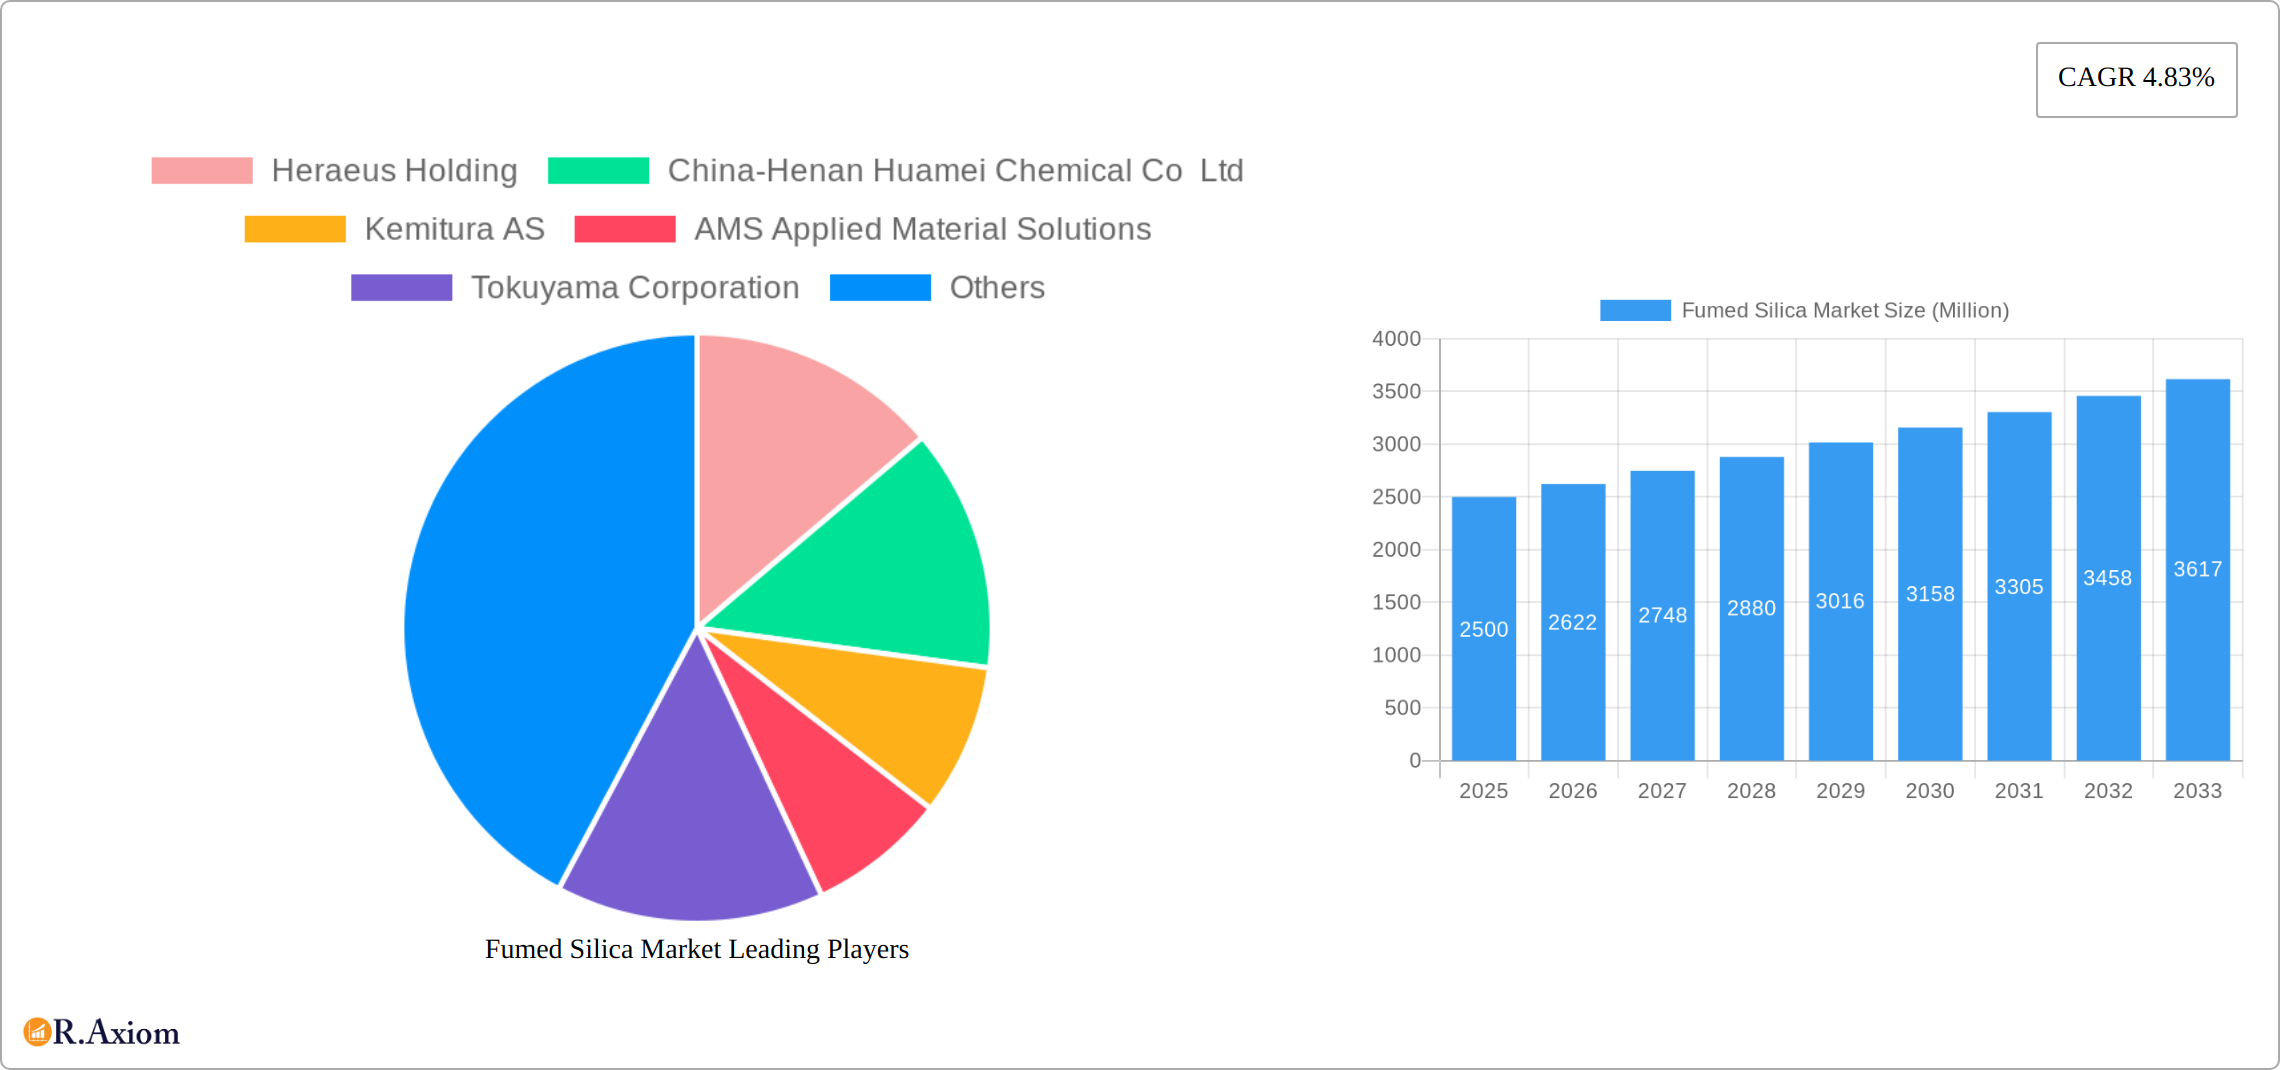
Leading Players in the Fumed Silica Market Market
- Heraeus Holding
- China-Henan Huamei Chemical Co Ltd
- Kemitura AS
- AMS Applied Material Solutions
- Tokuyama Corporation
- Evonik Industries AG
- Cabot Corporation
- Kemipex
- Dongyue Group Co Ltd
- Gelest Inc
- OCI Company Ltd
- Wacker Chemie AG
Key Developments in Fumed Silica Market Industry
- June 2023: Nouryon introduced new high-efficiency Kromasil spherical silica for novel peptide-based pharmaceuticals, broadening applications within the pharmaceutical sector.
- July 2022: Wacker Chemie AG expanded its fumed silica production capacity in the US, boosting its presence in the market and specifically catering to the construction industry.
- May 2022: Tokuyama Corporation increased its hydrophobic-grade fumed silica production capacity, enhancing its supply capabilities for resin adhesives and printing inks.
Strategic Outlook for Fumed Silica Market Market
The fumed silica market is poised for sustained growth, driven by advancements in material science, expanding applications across diverse industries, and the persistent demand for high-performance, sustainable materials. The development and implementation of sustainable and cost-effective production methods will be crucial in shaping the future of the market. Companies that effectively adapt to evolving technological trends, proactively address stringent regulatory requirements, and cater to the growing demand for sustainable and environmentally responsible solutions will be best positioned to achieve long-term success in this dynamic and competitive market. Strategic partnerships, investment in R&D, and a focus on supply chain optimization will be key success factors.
Fumed Silica Market Segmentation
-
1. Type
- 1.1. Hydrophilic Fumed Silica
- 1.2. Hydrophobic Fumed Silica
-
2. Application
- 2.1. Silicone Rubber
- 2.2. Plastics
- 2.3. Food and Beverages
- 2.4. Paints and Coatings (Including Inks)
- 2.5. Adhesives and Sealants
- 2.6. Other Ap
Fumed Silica Market Segmentation By Geography
-
1. Asia Pacific
- 1.1. China
- 1.2. India
- 1.3. Japan
- 1.4. South Korea
- 1.5. Rest of Asia Pacific
-
2. North America
- 2.1. United States
- 2.2. Canada
- 2.3. Mexico
-
3. Europe
- 3.1. Germany
- 3.2. United Kingdom
- 3.3. France
- 3.4. Italy
- 3.5. Rest of Europe
-
4. South America
- 4.1. Brazil
- 4.2. Argentina
- 4.3. Rest of South America
-
5. Middle East and Africa
- 5.1. Saudi Arabia
- 5.2. South Africa
- 5.3. Rest of Middle East and Africa
Fumed Silica Market REPORT HIGHLIGHTS
| Aspects | Details |
|---|---|
| Study Period | 2019-2033 |
| Base Year | 2024 |
| Estimated Year | 2025 |
| Forecast Period | 2025-2033 |
| Historical Period | 2019-2024 |
| Growth Rate | CAGR of 4.83% from 2019-2033 |
| Segmentation |
|
Table of Contents
- 1. Introduction
- 1.1. Research Scope
- 1.2. Market Segmentation
- 1.3. Research Methodology
- 1.4. Definitions and Assumptions
- 2. Executive Summary
- 2.1. Introduction
- 3. Market Dynamics
- 3.1. Introduction
- 3.2. Market Drivers
- 3.2.1. Surging Demand from Personal Care Applications in the Asia-Pacific Region; Increasing Demand from the Paints and Coatings Industry; Other Drivers
- 3.3. Market Restrains
- 3.3.1. Precipitated Silica as a Substitute; Development of Biogenic Fumed Silica
- 3.4. Market Trends
- 3.4.1. Adhesives and Sealants Application to Dominate the Market
- 4. Market Factor Analysis
- 4.1. Porters Five Forces
- 4.2. Supply/Value Chain
- 4.3. PESTEL analysis
- 4.4. Market Entropy
- 4.5. Patent/Trademark Analysis
- 5. Global Fumed Silica Market Analysis, Insights and Forecast, 2019-2031
- 5.1. Market Analysis, Insights and Forecast - by Type
- 5.1.1. Hydrophilic Fumed Silica
- 5.1.2. Hydrophobic Fumed Silica
- 5.2. Market Analysis, Insights and Forecast - by Application
- 5.2.1. Silicone Rubber
- 5.2.2. Plastics
- 5.2.3. Food and Beverages
- 5.2.4. Paints and Coatings (Including Inks)
- 5.2.5. Adhesives and Sealants
- 5.2.6. Other Ap
- 5.3. Market Analysis, Insights and Forecast - by Region
- 5.3.1. Asia Pacific
- 5.3.2. North America
- 5.3.3. Europe
- 5.3.4. South America
- 5.3.5. Middle East and Africa
- 5.1. Market Analysis, Insights and Forecast - by Type
- 6. Asia Pacific Fumed Silica Market Analysis, Insights and Forecast, 2019-2031
- 6.1. Market Analysis, Insights and Forecast - by Type
- 6.1.1. Hydrophilic Fumed Silica
- 6.1.2. Hydrophobic Fumed Silica
- 6.2. Market Analysis, Insights and Forecast - by Application
- 6.2.1. Silicone Rubber
- 6.2.2. Plastics
- 6.2.3. Food and Beverages
- 6.2.4. Paints and Coatings (Including Inks)
- 6.2.5. Adhesives and Sealants
- 6.2.6. Other Ap
- 6.1. Market Analysis, Insights and Forecast - by Type
- 7. North America Fumed Silica Market Analysis, Insights and Forecast, 2019-2031
- 7.1. Market Analysis, Insights and Forecast - by Type
- 7.1.1. Hydrophilic Fumed Silica
- 7.1.2. Hydrophobic Fumed Silica
- 7.2. Market Analysis, Insights and Forecast - by Application
- 7.2.1. Silicone Rubber
- 7.2.2. Plastics
- 7.2.3. Food and Beverages
- 7.2.4. Paints and Coatings (Including Inks)
- 7.2.5. Adhesives and Sealants
- 7.2.6. Other Ap
- 7.1. Market Analysis, Insights and Forecast - by Type
- 8. Europe Fumed Silica Market Analysis, Insights and Forecast, 2019-2031
- 8.1. Market Analysis, Insights and Forecast - by Type
- 8.1.1. Hydrophilic Fumed Silica
- 8.1.2. Hydrophobic Fumed Silica
- 8.2. Market Analysis, Insights and Forecast - by Application
- 8.2.1. Silicone Rubber
- 8.2.2. Plastics
- 8.2.3. Food and Beverages
- 8.2.4. Paints and Coatings (Including Inks)
- 8.2.5. Adhesives and Sealants
- 8.2.6. Other Ap
- 8.1. Market Analysis, Insights and Forecast - by Type
- 9. South America Fumed Silica Market Analysis, Insights and Forecast, 2019-2031
- 9.1. Market Analysis, Insights and Forecast - by Type
- 9.1.1. Hydrophilic Fumed Silica
- 9.1.2. Hydrophobic Fumed Silica
- 9.2. Market Analysis, Insights and Forecast - by Application
- 9.2.1. Silicone Rubber
- 9.2.2. Plastics
- 9.2.3. Food and Beverages
- 9.2.4. Paints and Coatings (Including Inks)
- 9.2.5. Adhesives and Sealants
- 9.2.6. Other Ap
- 9.1. Market Analysis, Insights and Forecast - by Type
- 10. Middle East and Africa Fumed Silica Market Analysis, Insights and Forecast, 2019-2031
- 10.1. Market Analysis, Insights and Forecast - by Type
- 10.1.1. Hydrophilic Fumed Silica
- 10.1.2. Hydrophobic Fumed Silica
- 10.2. Market Analysis, Insights and Forecast - by Application
- 10.2.1. Silicone Rubber
- 10.2.2. Plastics
- 10.2.3. Food and Beverages
- 10.2.4. Paints and Coatings (Including Inks)
- 10.2.5. Adhesives and Sealants
- 10.2.6. Other Ap
- 10.1. Market Analysis, Insights and Forecast - by Type
- 11. Asia Pacific Fumed Silica Market Analysis, Insights and Forecast, 2019-2031
- 11.1. Market Analysis, Insights and Forecast - By Country/Sub-region
- 11.1.1 China
- 11.1.2 India
- 11.1.3 Japan
- 11.1.4 South Korea
- 11.1.5 Rest of Asia Pacific
- 12. North America Fumed Silica Market Analysis, Insights and Forecast, 2019-2031
- 12.1. Market Analysis, Insights and Forecast - By Country/Sub-region
- 12.1.1 United States
- 12.1.2 Canada
- 12.1.3 Mexico
- 13. Europe Fumed Silica Market Analysis, Insights and Forecast, 2019-2031
- 13.1. Market Analysis, Insights and Forecast - By Country/Sub-region
- 13.1.1 Germany
- 13.1.2 United Kingdom
- 13.1.3 France
- 13.1.4 Italy
- 13.1.5 Rest of Europe
- 14. South America Fumed Silica Market Analysis, Insights and Forecast, 2019-2031
- 14.1. Market Analysis, Insights and Forecast - By Country/Sub-region
- 14.1.1 Brazil
- 14.1.2 Argentina
- 14.1.3 Rest of South America
- 15. Middle East and Africa Fumed Silica Market Analysis, Insights and Forecast, 2019-2031
- 15.1. Market Analysis, Insights and Forecast - By Country/Sub-region
- 15.1.1 Saudi Arabia
- 15.1.2 South Africa
- 15.1.3 Rest of Middle East and Africa
- 16. Competitive Analysis
- 16.1. Global Market Share Analysis 2024
- 16.2. Company Profiles
- 16.2.1 Heraeus Holding
- 16.2.1.1. Overview
- 16.2.1.2. Products
- 16.2.1.3. SWOT Analysis
- 16.2.1.4. Recent Developments
- 16.2.1.5. Financials (Based on Availability)
- 16.2.2 China-Henan Huamei Chemical Co Ltd
- 16.2.2.1. Overview
- 16.2.2.2. Products
- 16.2.2.3. SWOT Analysis
- 16.2.2.4. Recent Developments
- 16.2.2.5. Financials (Based on Availability)
- 16.2.3 Kemitura AS
- 16.2.3.1. Overview
- 16.2.3.2. Products
- 16.2.3.3. SWOT Analysis
- 16.2.3.4. Recent Developments
- 16.2.3.5. Financials (Based on Availability)
- 16.2.4 AMS Applied Material Solutions
- 16.2.4.1. Overview
- 16.2.4.2. Products
- 16.2.4.3. SWOT Analysis
- 16.2.4.4. Recent Developments
- 16.2.4.5. Financials (Based on Availability)
- 16.2.5 Tokuyama Corporation
- 16.2.5.1. Overview
- 16.2.5.2. Products
- 16.2.5.3. SWOT Analysis
- 16.2.5.4. Recent Developments
- 16.2.5.5. Financials (Based on Availability)
- 16.2.6 Evonik Industries AG
- 16.2.6.1. Overview
- 16.2.6.2. Products
- 16.2.6.3. SWOT Analysis
- 16.2.6.4. Recent Developments
- 16.2.6.5. Financials (Based on Availability)
- 16.2.7 Cabot Corporation
- 16.2.7.1. Overview
- 16.2.7.2. Products
- 16.2.7.3. SWOT Analysis
- 16.2.7.4. Recent Developments
- 16.2.7.5. Financials (Based on Availability)
- 16.2.8 Kemipex
- 16.2.8.1. Overview
- 16.2.8.2. Products
- 16.2.8.3. SWOT Analysis
- 16.2.8.4. Recent Developments
- 16.2.8.5. Financials (Based on Availability)
- 16.2.9 Dongyue Group Co Ltd
- 16.2.9.1. Overview
- 16.2.9.2. Products
- 16.2.9.3. SWOT Analysis
- 16.2.9.4. Recent Developments
- 16.2.9.5. Financials (Based on Availability)
- 16.2.10 Gelest Inc
- 16.2.10.1. Overview
- 16.2.10.2. Products
- 16.2.10.3. SWOT Analysis
- 16.2.10.4. Recent Developments
- 16.2.10.5. Financials (Based on Availability)
- 16.2.11 OCI Company Ltd
- 16.2.11.1. Overview
- 16.2.11.2. Products
- 16.2.11.3. SWOT Analysis
- 16.2.11.4. Recent Developments
- 16.2.11.5. Financials (Based on Availability)
- 16.2.12 Wacker Chemie AG*List Not Exhaustive
- 16.2.12.1. Overview
- 16.2.12.2. Products
- 16.2.12.3. SWOT Analysis
- 16.2.12.4. Recent Developments
- 16.2.12.5. Financials (Based on Availability)
- 16.2.1 Heraeus Holding
List of Figures
- Figure 1: Global Fumed Silica Market Revenue Breakdown (Million, %) by Region 2024 & 2032
- Figure 2: Global Fumed Silica Market Volume Breakdown (kilotons, %) by Region 2024 & 2032
- Figure 3: Asia Pacific Fumed Silica Market Revenue (Million), by Country 2024 & 2032
- Figure 4: Asia Pacific Fumed Silica Market Volume (kilotons), by Country 2024 & 2032
- Figure 5: Asia Pacific Fumed Silica Market Revenue Share (%), by Country 2024 & 2032
- Figure 6: Asia Pacific Fumed Silica Market Volume Share (%), by Country 2024 & 2032
- Figure 7: North America Fumed Silica Market Revenue (Million), by Country 2024 & 2032
- Figure 8: North America Fumed Silica Market Volume (kilotons), by Country 2024 & 2032
- Figure 9: North America Fumed Silica Market Revenue Share (%), by Country 2024 & 2032
- Figure 10: North America Fumed Silica Market Volume Share (%), by Country 2024 & 2032
- Figure 11: Europe Fumed Silica Market Revenue (Million), by Country 2024 & 2032
- Figure 12: Europe Fumed Silica Market Volume (kilotons), by Country 2024 & 2032
- Figure 13: Europe Fumed Silica Market Revenue Share (%), by Country 2024 & 2032
- Figure 14: Europe Fumed Silica Market Volume Share (%), by Country 2024 & 2032
- Figure 15: South America Fumed Silica Market Revenue (Million), by Country 2024 & 2032
- Figure 16: South America Fumed Silica Market Volume (kilotons), by Country 2024 & 2032
- Figure 17: South America Fumed Silica Market Revenue Share (%), by Country 2024 & 2032
- Figure 18: South America Fumed Silica Market Volume Share (%), by Country 2024 & 2032
- Figure 19: Middle East and Africa Fumed Silica Market Revenue (Million), by Country 2024 & 2032
- Figure 20: Middle East and Africa Fumed Silica Market Volume (kilotons), by Country 2024 & 2032
- Figure 21: Middle East and Africa Fumed Silica Market Revenue Share (%), by Country 2024 & 2032
- Figure 22: Middle East and Africa Fumed Silica Market Volume Share (%), by Country 2024 & 2032
- Figure 23: Asia Pacific Fumed Silica Market Revenue (Million), by Type 2024 & 2032
- Figure 24: Asia Pacific Fumed Silica Market Volume (kilotons), by Type 2024 & 2032
- Figure 25: Asia Pacific Fumed Silica Market Revenue Share (%), by Type 2024 & 2032
- Figure 26: Asia Pacific Fumed Silica Market Volume Share (%), by Type 2024 & 2032
- Figure 27: Asia Pacific Fumed Silica Market Revenue (Million), by Application 2024 & 2032
- Figure 28: Asia Pacific Fumed Silica Market Volume (kilotons), by Application 2024 & 2032
- Figure 29: Asia Pacific Fumed Silica Market Revenue Share (%), by Application 2024 & 2032
- Figure 30: Asia Pacific Fumed Silica Market Volume Share (%), by Application 2024 & 2032
- Figure 31: Asia Pacific Fumed Silica Market Revenue (Million), by Country 2024 & 2032
- Figure 32: Asia Pacific Fumed Silica Market Volume (kilotons), by Country 2024 & 2032
- Figure 33: Asia Pacific Fumed Silica Market Revenue Share (%), by Country 2024 & 2032
- Figure 34: Asia Pacific Fumed Silica Market Volume Share (%), by Country 2024 & 2032
- Figure 35: North America Fumed Silica Market Revenue (Million), by Type 2024 & 2032
- Figure 36: North America Fumed Silica Market Volume (kilotons), by Type 2024 & 2032
- Figure 37: North America Fumed Silica Market Revenue Share (%), by Type 2024 & 2032
- Figure 38: North America Fumed Silica Market Volume Share (%), by Type 2024 & 2032
- Figure 39: North America Fumed Silica Market Revenue (Million), by Application 2024 & 2032
- Figure 40: North America Fumed Silica Market Volume (kilotons), by Application 2024 & 2032
- Figure 41: North America Fumed Silica Market Revenue Share (%), by Application 2024 & 2032
- Figure 42: North America Fumed Silica Market Volume Share (%), by Application 2024 & 2032
- Figure 43: North America Fumed Silica Market Revenue (Million), by Country 2024 & 2032
- Figure 44: North America Fumed Silica Market Volume (kilotons), by Country 2024 & 2032
- Figure 45: North America Fumed Silica Market Revenue Share (%), by Country 2024 & 2032
- Figure 46: North America Fumed Silica Market Volume Share (%), by Country 2024 & 2032
- Figure 47: Europe Fumed Silica Market Revenue (Million), by Type 2024 & 2032
- Figure 48: Europe Fumed Silica Market Volume (kilotons), by Type 2024 & 2032
- Figure 49: Europe Fumed Silica Market Revenue Share (%), by Type 2024 & 2032
- Figure 50: Europe Fumed Silica Market Volume Share (%), by Type 2024 & 2032
- Figure 51: Europe Fumed Silica Market Revenue (Million), by Application 2024 & 2032
- Figure 52: Europe Fumed Silica Market Volume (kilotons), by Application 2024 & 2032
- Figure 53: Europe Fumed Silica Market Revenue Share (%), by Application 2024 & 2032
- Figure 54: Europe Fumed Silica Market Volume Share (%), by Application 2024 & 2032
- Figure 55: Europe Fumed Silica Market Revenue (Million), by Country 2024 & 2032
- Figure 56: Europe Fumed Silica Market Volume (kilotons), by Country 2024 & 2032
- Figure 57: Europe Fumed Silica Market Revenue Share (%), by Country 2024 & 2032
- Figure 58: Europe Fumed Silica Market Volume Share (%), by Country 2024 & 2032
- Figure 59: South America Fumed Silica Market Revenue (Million), by Type 2024 & 2032
- Figure 60: South America Fumed Silica Market Volume (kilotons), by Type 2024 & 2032
- Figure 61: South America Fumed Silica Market Revenue Share (%), by Type 2024 & 2032
- Figure 62: South America Fumed Silica Market Volume Share (%), by Type 2024 & 2032
- Figure 63: South America Fumed Silica Market Revenue (Million), by Application 2024 & 2032
- Figure 64: South America Fumed Silica Market Volume (kilotons), by Application 2024 & 2032
- Figure 65: South America Fumed Silica Market Revenue Share (%), by Application 2024 & 2032
- Figure 66: South America Fumed Silica Market Volume Share (%), by Application 2024 & 2032
- Figure 67: South America Fumed Silica Market Revenue (Million), by Country 2024 & 2032
- Figure 68: South America Fumed Silica Market Volume (kilotons), by Country 2024 & 2032
- Figure 69: South America Fumed Silica Market Revenue Share (%), by Country 2024 & 2032
- Figure 70: South America Fumed Silica Market Volume Share (%), by Country 2024 & 2032
- Figure 71: Middle East and Africa Fumed Silica Market Revenue (Million), by Type 2024 & 2032
- Figure 72: Middle East and Africa Fumed Silica Market Volume (kilotons), by Type 2024 & 2032
- Figure 73: Middle East and Africa Fumed Silica Market Revenue Share (%), by Type 2024 & 2032
- Figure 74: Middle East and Africa Fumed Silica Market Volume Share (%), by Type 2024 & 2032
- Figure 75: Middle East and Africa Fumed Silica Market Revenue (Million), by Application 2024 & 2032
- Figure 76: Middle East and Africa Fumed Silica Market Volume (kilotons), by Application 2024 & 2032
- Figure 77: Middle East and Africa Fumed Silica Market Revenue Share (%), by Application 2024 & 2032
- Figure 78: Middle East and Africa Fumed Silica Market Volume Share (%), by Application 2024 & 2032
- Figure 79: Middle East and Africa Fumed Silica Market Revenue (Million), by Country 2024 & 2032
- Figure 80: Middle East and Africa Fumed Silica Market Volume (kilotons), by Country 2024 & 2032
- Figure 81: Middle East and Africa Fumed Silica Market Revenue Share (%), by Country 2024 & 2032
- Figure 82: Middle East and Africa Fumed Silica Market Volume Share (%), by Country 2024 & 2032
List of Tables
- Table 1: Global Fumed Silica Market Revenue Million Forecast, by Region 2019 & 2032
- Table 2: Global Fumed Silica Market Volume kilotons Forecast, by Region 2019 & 2032
- Table 3: Global Fumed Silica Market Revenue Million Forecast, by Type 2019 & 2032
- Table 4: Global Fumed Silica Market Volume kilotons Forecast, by Type 2019 & 2032
- Table 5: Global Fumed Silica Market Revenue Million Forecast, by Application 2019 & 2032
- Table 6: Global Fumed Silica Market Volume kilotons Forecast, by Application 2019 & 2032
- Table 7: Global Fumed Silica Market Revenue Million Forecast, by Region 2019 & 2032
- Table 8: Global Fumed Silica Market Volume kilotons Forecast, by Region 2019 & 2032
- Table 9: Global Fumed Silica Market Revenue Million Forecast, by Country 2019 & 2032
- Table 10: Global Fumed Silica Market Volume kilotons Forecast, by Country 2019 & 2032
- Table 11: China Fumed Silica Market Revenue (Million) Forecast, by Application 2019 & 2032
- Table 12: China Fumed Silica Market Volume (kilotons) Forecast, by Application 2019 & 2032
- Table 13: India Fumed Silica Market Revenue (Million) Forecast, by Application 2019 & 2032
- Table 14: India Fumed Silica Market Volume (kilotons) Forecast, by Application 2019 & 2032
- Table 15: Japan Fumed Silica Market Revenue (Million) Forecast, by Application 2019 & 2032
- Table 16: Japan Fumed Silica Market Volume (kilotons) Forecast, by Application 2019 & 2032
- Table 17: South Korea Fumed Silica Market Revenue (Million) Forecast, by Application 2019 & 2032
- Table 18: South Korea Fumed Silica Market Volume (kilotons) Forecast, by Application 2019 & 2032
- Table 19: Rest of Asia Pacific Fumed Silica Market Revenue (Million) Forecast, by Application 2019 & 2032
- Table 20: Rest of Asia Pacific Fumed Silica Market Volume (kilotons) Forecast, by Application 2019 & 2032
- Table 21: Global Fumed Silica Market Revenue Million Forecast, by Country 2019 & 2032
- Table 22: Global Fumed Silica Market Volume kilotons Forecast, by Country 2019 & 2032
- Table 23: United States Fumed Silica Market Revenue (Million) Forecast, by Application 2019 & 2032
- Table 24: United States Fumed Silica Market Volume (kilotons) Forecast, by Application 2019 & 2032
- Table 25: Canada Fumed Silica Market Revenue (Million) Forecast, by Application 2019 & 2032
- Table 26: Canada Fumed Silica Market Volume (kilotons) Forecast, by Application 2019 & 2032
- Table 27: Mexico Fumed Silica Market Revenue (Million) Forecast, by Application 2019 & 2032
- Table 28: Mexico Fumed Silica Market Volume (kilotons) Forecast, by Application 2019 & 2032
- Table 29: Global Fumed Silica Market Revenue Million Forecast, by Country 2019 & 2032
- Table 30: Global Fumed Silica Market Volume kilotons Forecast, by Country 2019 & 2032
- Table 31: Germany Fumed Silica Market Revenue (Million) Forecast, by Application 2019 & 2032
- Table 32: Germany Fumed Silica Market Volume (kilotons) Forecast, by Application 2019 & 2032
- Table 33: United Kingdom Fumed Silica Market Revenue (Million) Forecast, by Application 2019 & 2032
- Table 34: United Kingdom Fumed Silica Market Volume (kilotons) Forecast, by Application 2019 & 2032
- Table 35: France Fumed Silica Market Revenue (Million) Forecast, by Application 2019 & 2032
- Table 36: France Fumed Silica Market Volume (kilotons) Forecast, by Application 2019 & 2032
- Table 37: Italy Fumed Silica Market Revenue (Million) Forecast, by Application 2019 & 2032
- Table 38: Italy Fumed Silica Market Volume (kilotons) Forecast, by Application 2019 & 2032
- Table 39: Rest of Europe Fumed Silica Market Revenue (Million) Forecast, by Application 2019 & 2032
- Table 40: Rest of Europe Fumed Silica Market Volume (kilotons) Forecast, by Application 2019 & 2032
- Table 41: Global Fumed Silica Market Revenue Million Forecast, by Country 2019 & 2032
- Table 42: Global Fumed Silica Market Volume kilotons Forecast, by Country 2019 & 2032
- Table 43: Brazil Fumed Silica Market Revenue (Million) Forecast, by Application 2019 & 2032
- Table 44: Brazil Fumed Silica Market Volume (kilotons) Forecast, by Application 2019 & 2032
- Table 45: Argentina Fumed Silica Market Revenue (Million) Forecast, by Application 2019 & 2032
- Table 46: Argentina Fumed Silica Market Volume (kilotons) Forecast, by Application 2019 & 2032
- Table 47: Rest of South America Fumed Silica Market Revenue (Million) Forecast, by Application 2019 & 2032
- Table 48: Rest of South America Fumed Silica Market Volume (kilotons) Forecast, by Application 2019 & 2032
- Table 49: Global Fumed Silica Market Revenue Million Forecast, by Country 2019 & 2032
- Table 50: Global Fumed Silica Market Volume kilotons Forecast, by Country 2019 & 2032
- Table 51: Saudi Arabia Fumed Silica Market Revenue (Million) Forecast, by Application 2019 & 2032
- Table 52: Saudi Arabia Fumed Silica Market Volume (kilotons) Forecast, by Application 2019 & 2032
- Table 53: South Africa Fumed Silica Market Revenue (Million) Forecast, by Application 2019 & 2032
- Table 54: South Africa Fumed Silica Market Volume (kilotons) Forecast, by Application 2019 & 2032
- Table 55: Rest of Middle East and Africa Fumed Silica Market Revenue (Million) Forecast, by Application 2019 & 2032
- Table 56: Rest of Middle East and Africa Fumed Silica Market Volume (kilotons) Forecast, by Application 2019 & 2032
- Table 57: Global Fumed Silica Market Revenue Million Forecast, by Type 2019 & 2032
- Table 58: Global Fumed Silica Market Volume kilotons Forecast, by Type 2019 & 2032
- Table 59: Global Fumed Silica Market Revenue Million Forecast, by Application 2019 & 2032
- Table 60: Global Fumed Silica Market Volume kilotons Forecast, by Application 2019 & 2032
- Table 61: Global Fumed Silica Market Revenue Million Forecast, by Country 2019 & 2032
- Table 62: Global Fumed Silica Market Volume kilotons Forecast, by Country 2019 & 2032
- Table 63: China Fumed Silica Market Revenue (Million) Forecast, by Application 2019 & 2032
- Table 64: China Fumed Silica Market Volume (kilotons) Forecast, by Application 2019 & 2032
- Table 65: India Fumed Silica Market Revenue (Million) Forecast, by Application 2019 & 2032
- Table 66: India Fumed Silica Market Volume (kilotons) Forecast, by Application 2019 & 2032
- Table 67: Japan Fumed Silica Market Revenue (Million) Forecast, by Application 2019 & 2032
- Table 68: Japan Fumed Silica Market Volume (kilotons) Forecast, by Application 2019 & 2032
- Table 69: South Korea Fumed Silica Market Revenue (Million) Forecast, by Application 2019 & 2032
- Table 70: South Korea Fumed Silica Market Volume (kilotons) Forecast, by Application 2019 & 2032
- Table 71: Rest of Asia Pacific Fumed Silica Market Revenue (Million) Forecast, by Application 2019 & 2032
- Table 72: Rest of Asia Pacific Fumed Silica Market Volume (kilotons) Forecast, by Application 2019 & 2032
- Table 73: Global Fumed Silica Market Revenue Million Forecast, by Type 2019 & 2032
- Table 74: Global Fumed Silica Market Volume kilotons Forecast, by Type 2019 & 2032
- Table 75: Global Fumed Silica Market Revenue Million Forecast, by Application 2019 & 2032
- Table 76: Global Fumed Silica Market Volume kilotons Forecast, by Application 2019 & 2032
- Table 77: Global Fumed Silica Market Revenue Million Forecast, by Country 2019 & 2032
- Table 78: Global Fumed Silica Market Volume kilotons Forecast, by Country 2019 & 2032
- Table 79: United States Fumed Silica Market Revenue (Million) Forecast, by Application 2019 & 2032
- Table 80: United States Fumed Silica Market Volume (kilotons) Forecast, by Application 2019 & 2032
- Table 81: Canada Fumed Silica Market Revenue (Million) Forecast, by Application 2019 & 2032
- Table 82: Canada Fumed Silica Market Volume (kilotons) Forecast, by Application 2019 & 2032
- Table 83: Mexico Fumed Silica Market Revenue (Million) Forecast, by Application 2019 & 2032
- Table 84: Mexico Fumed Silica Market Volume (kilotons) Forecast, by Application 2019 & 2032
- Table 85: Global Fumed Silica Market Revenue Million Forecast, by Type 2019 & 2032
- Table 86: Global Fumed Silica Market Volume kilotons Forecast, by Type 2019 & 2032
- Table 87: Global Fumed Silica Market Revenue Million Forecast, by Application 2019 & 2032
- Table 88: Global Fumed Silica Market Volume kilotons Forecast, by Application 2019 & 2032
- Table 89: Global Fumed Silica Market Revenue Million Forecast, by Country 2019 & 2032
- Table 90: Global Fumed Silica Market Volume kilotons Forecast, by Country 2019 & 2032
- Table 91: Germany Fumed Silica Market Revenue (Million) Forecast, by Application 2019 & 2032
- Table 92: Germany Fumed Silica Market Volume (kilotons) Forecast, by Application 2019 & 2032
- Table 93: United Kingdom Fumed Silica Market Revenue (Million) Forecast, by Application 2019 & 2032
- Table 94: United Kingdom Fumed Silica Market Volume (kilotons) Forecast, by Application 2019 & 2032
- Table 95: France Fumed Silica Market Revenue (Million) Forecast, by Application 2019 & 2032
- Table 96: France Fumed Silica Market Volume (kilotons) Forecast, by Application 2019 & 2032
- Table 97: Italy Fumed Silica Market Revenue (Million) Forecast, by Application 2019 & 2032
- Table 98: Italy Fumed Silica Market Volume (kilotons) Forecast, by Application 2019 & 2032
- Table 99: Rest of Europe Fumed Silica Market Revenue (Million) Forecast, by Application 2019 & 2032
- Table 100: Rest of Europe Fumed Silica Market Volume (kilotons) Forecast, by Application 2019 & 2032
- Table 101: Global Fumed Silica Market Revenue Million Forecast, by Type 2019 & 2032
- Table 102: Global Fumed Silica Market Volume kilotons Forecast, by Type 2019 & 2032
- Table 103: Global Fumed Silica Market Revenue Million Forecast, by Application 2019 & 2032
- Table 104: Global Fumed Silica Market Volume kilotons Forecast, by Application 2019 & 2032
- Table 105: Global Fumed Silica Market Revenue Million Forecast, by Country 2019 & 2032
- Table 106: Global Fumed Silica Market Volume kilotons Forecast, by Country 2019 & 2032
- Table 107: Brazil Fumed Silica Market Revenue (Million) Forecast, by Application 2019 & 2032
- Table 108: Brazil Fumed Silica Market Volume (kilotons) Forecast, by Application 2019 & 2032
- Table 109: Argentina Fumed Silica Market Revenue (Million) Forecast, by Application 2019 & 2032
- Table 110: Argentina Fumed Silica Market Volume (kilotons) Forecast, by Application 2019 & 2032
- Table 111: Rest of South America Fumed Silica Market Revenue (Million) Forecast, by Application 2019 & 2032
- Table 112: Rest of South America Fumed Silica Market Volume (kilotons) Forecast, by Application 2019 & 2032
- Table 113: Global Fumed Silica Market Revenue Million Forecast, by Type 2019 & 2032
- Table 114: Global Fumed Silica Market Volume kilotons Forecast, by Type 2019 & 2032
- Table 115: Global Fumed Silica Market Revenue Million Forecast, by Application 2019 & 2032
- Table 116: Global Fumed Silica Market Volume kilotons Forecast, by Application 2019 & 2032
- Table 117: Global Fumed Silica Market Revenue Million Forecast, by Country 2019 & 2032
- Table 118: Global Fumed Silica Market Volume kilotons Forecast, by Country 2019 & 2032
- Table 119: Saudi Arabia Fumed Silica Market Revenue (Million) Forecast, by Application 2019 & 2032
- Table 120: Saudi Arabia Fumed Silica Market Volume (kilotons) Forecast, by Application 2019 & 2032
- Table 121: South Africa Fumed Silica Market Revenue (Million) Forecast, by Application 2019 & 2032
- Table 122: South Africa Fumed Silica Market Volume (kilotons) Forecast, by Application 2019 & 2032
- Table 123: Rest of Middle East and Africa Fumed Silica Market Revenue (Million) Forecast, by Application 2019 & 2032
- Table 124: Rest of Middle East and Africa Fumed Silica Market Volume (kilotons) Forecast, by Application 2019 & 2032
Frequently Asked Questions
1. What is the projected Compound Annual Growth Rate (CAGR) of the Fumed Silica Market?
The projected CAGR is approximately 4.83%.
2. Which companies are prominent players in the Fumed Silica Market?
Key companies in the market include Heraeus Holding, China-Henan Huamei Chemical Co Ltd, Kemitura AS, AMS Applied Material Solutions, Tokuyama Corporation, Evonik Industries AG, Cabot Corporation, Kemipex, Dongyue Group Co Ltd, Gelest Inc, OCI Company Ltd, Wacker Chemie AG*List Not Exhaustive.
3. What are the main segments of the Fumed Silica Market?
The market segments include Type, Application.
4. Can you provide details about the market size?
The market size is estimated to be USD XX Million as of 2022.
5. What are some drivers contributing to market growth?
Surging Demand from Personal Care Applications in the Asia-Pacific Region; Increasing Demand from the Paints and Coatings Industry; Other Drivers.
6. What are the notable trends driving market growth?
Adhesives and Sealants Application to Dominate the Market.
7. Are there any restraints impacting market growth?
Precipitated Silica as a Substitute; Development of Biogenic Fumed Silica.
8. Can you provide examples of recent developments in the market?
June 2023: Nouryon introduced new high-efficiency Kromasil spherical silica for novel peptide-based pharmaceuticals.
9. What pricing options are available for accessing the report?
Pricing options include single-user, multi-user, and enterprise licenses priced at USD 4750, USD 5250, and USD 8750 respectively.
10. Is the market size provided in terms of value or volume?
The market size is provided in terms of value, measured in Million and volume, measured in kilotons.
11. Are there any specific market keywords associated with the report?
Yes, the market keyword associated with the report is "Fumed Silica Market," which aids in identifying and referencing the specific market segment covered.
12. How do I determine which pricing option suits my needs best?
The pricing options vary based on user requirements and access needs. Individual users may opt for single-user licenses, while businesses requiring broader access may choose multi-user or enterprise licenses for cost-effective access to the report.
13. Are there any additional resources or data provided in the Fumed Silica Market report?
While the report offers comprehensive insights, it's advisable to review the specific contents or supplementary materials provided to ascertain if additional resources or data are available.
14. How can I stay updated on further developments or reports in the Fumed Silica Market?
To stay informed about further developments, trends, and reports in the Fumed Silica Market, consider subscribing to industry newsletters, following relevant companies and organizations, or regularly checking reputable industry news sources and publications.
Methodology
Step 1 - Identification of Relevant Samples Size from Population Database


Step 2 - Approaches for Defining Global Market Size (Value, Volume* & Price*)

Note*: In applicable scenarios
Step 3 - Data Sources
Primary Research
- Web Analytics
- Survey Reports
- Research Institute
- Latest Research Reports
- Opinion Leaders
Secondary Research
- Annual Reports
- White Paper
- Latest Press Release
- Industry Association
- Paid Database
- Investor Presentations

Step 4 - Data Triangulation
Involves using different sources of information in order to increase the validity of a study
These sources are likely to be stakeholders in a program - participants, other researchers, program staff, other community members, and so on.
Then we put all data in single framework & apply various statistical tools to find out the dynamic on the market.
During the analysis stage, feedback from the stakeholder groups would be compared to determine areas of agreement as well as areas of divergence


