Key Insights
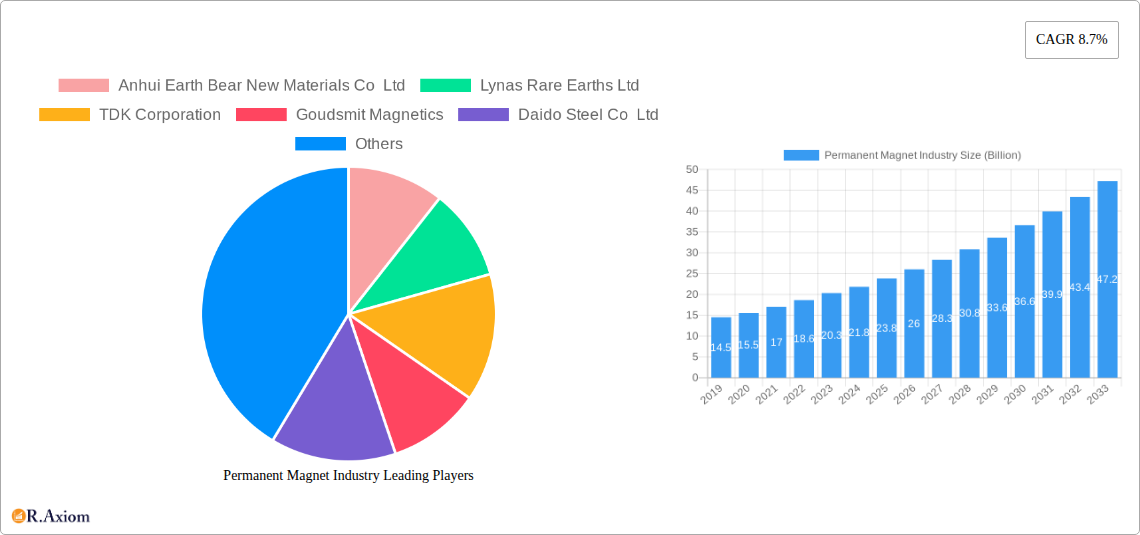
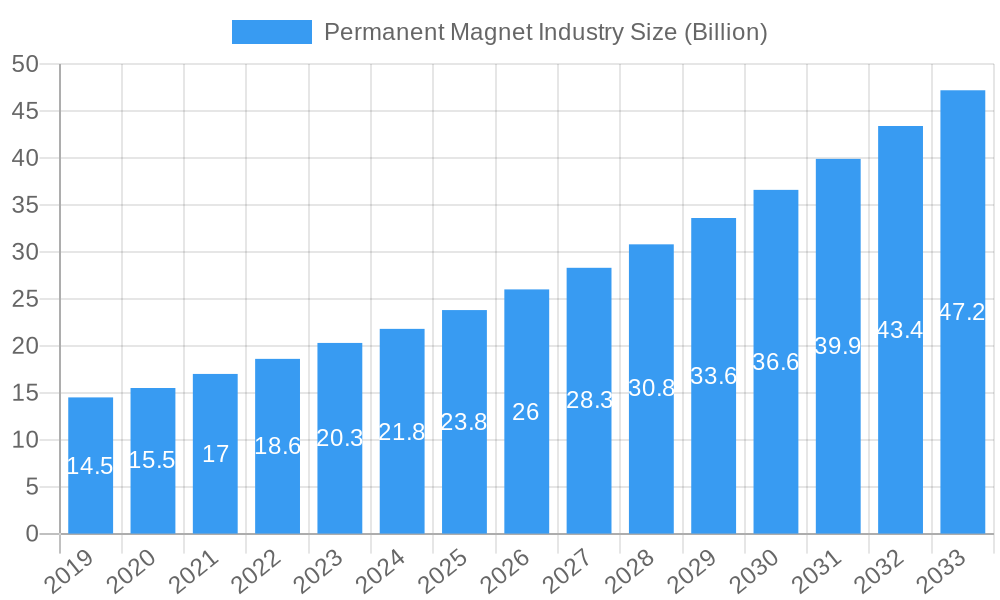
The global Permanent Magnet industry is experiencing robust expansion, projected to reach a substantial market size of $22.1 billion. This growth is fueled by an impressive Compound Annual Growth Rate (CAGR) of 8.7%, indicating a dynamic and expanding market over the forecast period from 2019 to 2033. Key drivers behind this surge include the escalating demand for electric vehicles (EVs), the burgeoning renewable energy sector, and the widespread adoption of advanced electronics. The automotive industry, in particular, is a significant contributor, driven by the transition to electric powertrains and the increasing integration of sophisticated electronic systems. Similarly, the expansion of wind power and other renewable energy sources necessitates high-performance permanent magnets for efficient generation. Advancements in electronic devices, from smartphones and consumer electronics to industrial automation and medical equipment, further bolster market demand.
Permanent Magnet Industry Market Size (In Million)
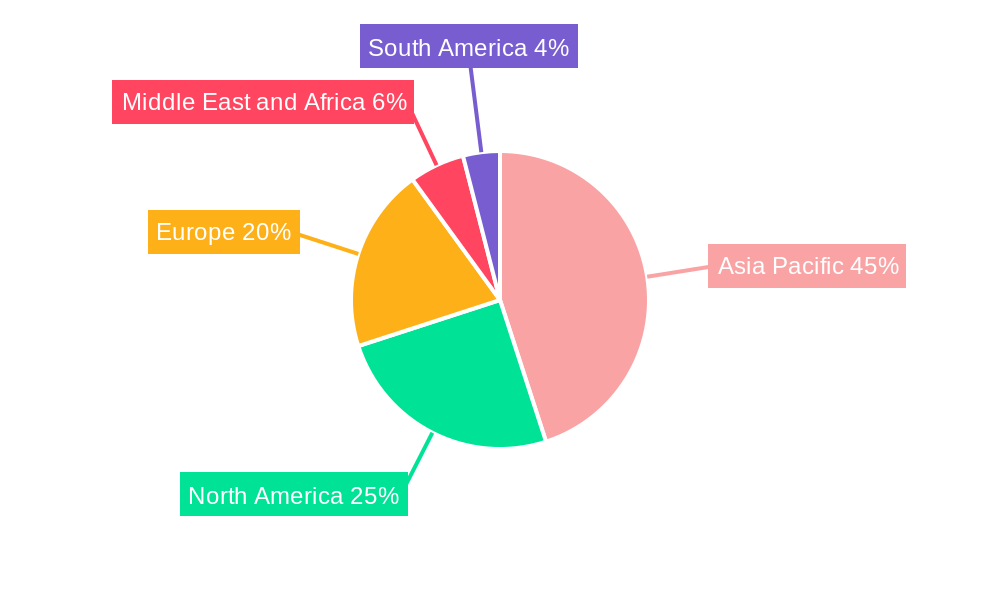
The market's segmentation reveals a diverse landscape, with Neodymium-Iron-Boron (NdFeB) magnets dominating due to their superior magnetic properties, crucial for high-efficiency applications. Ferrite magnets hold a significant share due to their cost-effectiveness and widespread use in less demanding applications. The industrial sector, encompassing manufacturing, automation, and robotics, represents a substantial end-user segment, closely followed by the automotive sector and the rapidly growing power generation segment, especially renewables. Geographically, Asia Pacific, led by China, stands as the largest and fastest-growing regional market, owing to its extensive manufacturing base and significant investments in renewable energy and electric mobility. North America and Europe also present substantial market opportunities, driven by strong automotive sectors and increasing renewable energy initiatives. However, potential restraints such as the fluctuating prices of rare earth materials, stringent environmental regulations related to mining and processing, and the development of alternative magnet technologies could pose challenges to sustained growth.
Permanent Magnet Industry Company Market Share
This in-depth report provides a thorough analysis of the global Permanent Magnet Industry, encompassing market dynamics, trends, competitive landscapes, and future opportunities. Spanning a study period from 2019 to 2033, with a base and estimated year of 2025, this report offers actionable insights for stakeholders seeking to navigate this rapidly evolving sector. The market for permanent magnets is projected to witness significant growth, driven by the surging demand in key end-user industries such as automotive, electronics, and power generation. The forecast period (2025–2033) will be crucial for understanding the long-term trajectory and investment potential. Our analysis includes a detailed examination of material types like Neodymium-Iron-Boron, Ferrite, Samarium Cobalt, and Alnico, alongside an exploration of their applications across diverse end-user industries. With a historical period analysis from 2019 to 2024, this report sets the stage for understanding the foundational shifts and innovations that have shaped the current market.
Permanent Magnet Industry Market Concentration & Innovation
The Permanent Magnet Industry exhibits a moderate to high degree of market concentration, with a few dominant players accounting for a significant portion of global production. Key innovation drivers include the relentless pursuit of higher magnetic strength, improved thermal stability, and reduced reliance on critical rare earth elements. Regulatory frameworks, particularly concerning environmental impact and supply chain transparency for rare earth materials, are increasingly shaping market entry and operational strategies. Product substitutes, while present in niche applications, have yet to offer comparable performance to high-grade permanent magnets in core sectors. End-user trends are overwhelmingly pushing towards miniaturization, higher energy efficiency, and greater power density, directly influencing magnet development. Mergers and acquisitions (M&A) activity is a notable strategy for market consolidation and technology acquisition. For instance, recent M&A deals have focused on securing rare earth supply chains and integrating advanced manufacturing capabilities. The market share of leading companies, estimated to be in the billions, reflects this consolidation.
- Market Concentration: Dominated by a few key global players.
- Innovation Drivers: Higher magnetic strength, thermal stability, rare earth reduction.
- Regulatory Frameworks: Focus on environmental impact and supply chain security.
- Product Substitutes: Limited in high-performance applications.
- End-User Trends: Miniaturization, energy efficiency, power density.
- M&A Activities: Strategic acquisitions for supply chain security and technological advancement.
Permanent Magnet Industry Industry Trends & Insights
The Permanent Magnet Industry is poised for substantial growth, fueled by a confluence of technological advancements, expanding end-user markets, and a global push towards electrification and renewable energy solutions. The Compound Annual Growth Rate (CAGR) of the permanent magnet market is estimated to be robust, signifying a dynamic and expanding sector. Market penetration is deepening across various industries, driven by the indispensable role of permanent magnets in modern technologies. Electric vehicles (EVs) represent a monumental growth driver, with the demand for high-performance traction motors directly translating into increased consumption of rare earth magnets, particularly Neodymium-Iron-Boron (NdFeB) and Samarium Cobalt (SmCo). The renewable energy sector, especially wind power, also presents a significant demand surge for large-scale permanent magnets used in direct-drive turbines, contributing billions to the market value.
Technological disruptions are at the forefront of shaping the industry. Research and development efforts are intensely focused on enhancing the intrinsic coercivity and remanence of permanent magnets, leading to more efficient and compact motor designs. Furthermore, significant investments are being made in developing alternative magnet compositions and manufacturing processes that reduce dependence on strategically sensitive rare earth elements. Innovations in magnet recycling and rare earth extraction are also gaining traction, aiming to create a more sustainable and secure supply chain, adding billions to the circular economy aspect of the market.
Consumer preferences are indirectly influencing market trends by demanding more sustainable, energy-efficient, and powerful electronic devices and vehicles. This translates into a higher demand for advanced permanent magnets that enable these characteristics. The competitive dynamics within the industry are characterized by fierce competition among established manufacturers, alongside the emergence of new players, particularly in Asia, capitalizing on cost advantages and burgeoning domestic demand. Strategic partnerships and joint ventures are becoming increasingly common as companies seek to share risks, leverage expertise, and secure market access, contributing billions in collaborative ventures. The overall market penetration is expected to increase as more sectors recognize the cost-effectiveness and performance benefits offered by advanced permanent magnets.
Dominant Markets & Segments in Permanent Magnet Industry
The Permanent Magnet Industry is characterized by the dominance of specific material types and end-user industries, each driven by distinct market forces and technological advancements.
Material Type Dominance:
- Neodymium-Iron-Boron (NdFeB) Magnets: This segment is the undisputed leader in terms of market share and growth potential, accounting for billions in revenue. Its dominance stems from its exceptionally high magnetic properties, including superior remanence and energy product, making it the material of choice for high-performance applications. Key drivers for NdFeB magnets include the burgeoning electric vehicle (EV) market, where they are essential for traction motors, and the wind power industry, utilizing them in efficient turbine generators. China's substantial rare earth reserves and manufacturing capacity have historically given it a significant advantage in this segment, influencing global pricing and supply. The continued innovation in improving the thermal stability and reducing the critical rare earth content of NdFeB magnets further solidifies its leading position, with market projections in the billions.
- Ferrite Magnets: While not possessing the same magnetic strength as NdFeB, ferrite magnets command a substantial market share due to their lower cost and widespread availability. They are crucial in a vast array of consumer electronics, automotive components (e.g., starter motors, sensors), and industrial applications where cost-effectiveness is paramount. The economic policies supporting mass production and the readily accessible raw materials contribute to their sustained market presence, valued in billions. Their resilience to corrosion and ease of manufacturing also contribute to their enduring demand.
- Samarium Cobalt (SmCo) Magnets: This segment, while smaller in market volume compared to NdFeB and ferrite, is critical for applications requiring exceptional performance under high-temperature conditions and superior corrosion resistance. These specialized magnets are vital in aerospace, defense, medical equipment, and high-performance industrial motors, where reliability and extreme operating environments are non-negotiable. The strategic importance of these applications, coupled with the high value of the end products, drives the billions in revenue for SmCo magnets. Advances in manufacturing techniques are aimed at improving their brittle nature and reducing production costs.
- Alnico Magnets: Alnico magnets, known for their excellent temperature stability and corrosion resistance, find applications in specialized areas such as loudspeakers, sensors, and scientific instruments. Although their magnetic strength is lower than rare earth magnets, their historical significance and unique properties ensure a stable market segment, contributing billions in niche markets. Ongoing research focuses on enhancing their magnetic properties through advanced alloying and heat treatment processes.
End-User Industry Dominance:
- Automotive Industry: This is arguably the most significant growth engine for the permanent magnet market, with electric vehicles spearheading demand. The transition to EVs necessitates powerful and efficient electric motors, driving substantial consumption of NdFeB magnets. The automotive sector's commitment to sustainability and electrification, supported by government incentives and evolving consumer preferences, ensures continued market expansion for permanent magnets, representing billions in value. Beyond EVs, conventional vehicles also utilize magnets in various components, contributing to the overall market size.
- Electronics Industry: This sector has long been a major consumer of permanent magnets, from small actuators in smartphones and hard drives to larger motors in home appliances and audio equipment. The trend towards miniaturization and increased functionality in electronic devices continues to fuel demand for diverse types of permanent magnets, contributing billions to the overall market. Innovations in magnetic materials are enabling the development of even smaller and more powerful electronic components.
- Industrial Sector: The industrial segment is a broad and diverse market for permanent magnets, encompassing applications in manufacturing equipment, robotics, automation, material handling, and various types of industrial motors. The drive for increased efficiency, automation, and precision in industrial processes fuels the demand for high-performance magnets. Investments in modernizing industrial infrastructure and adopting advanced manufacturing technologies further bolster this segment, with market valuations in the billions.
- Power Generation: This sector is experiencing a significant uplift in demand for permanent magnets, primarily driven by the growth of renewable energy sources, particularly wind power. Large-scale wind turbines, especially those employing direct-drive technology, rely heavily on powerful NdFeB magnets to generate electricity efficiently. The global commitment to decarbonization and the expansion of renewable energy capacity are creating a sustained demand for permanent magnets, translating into billions in market value.
- Other End-User Industries: This encompasses a wide range of applications including medical devices (MRI machines, prosthetics), defense systems, aerospace, and research and development. These specialized sectors often require magnets with unique properties and high reliability, contributing a significant but niche portion to the overall market value in billions.
Permanent Magnet Industry Product Developments
Recent product developments in the Permanent Magnet Industry are characterized by a focus on enhancing magnetic performance, improving sustainability, and expanding application horizons. Innovations in Neodymium-Iron-Boron (NdFeB) magnets include the development of higher coercivity grades that maintain their magnetic strength at elevated temperatures, crucial for demanding applications like electric vehicle powertrains. Furthermore, research into reducing the dysprosium content in NdFeB magnets aims to mitigate supply chain vulnerabilities and cost fluctuations associated with this critical rare earth element. Companies are also investing in advanced manufacturing techniques, such as additive manufacturing for magnets, to enable the creation of complex geometries and custom magnetic solutions, offering distinct competitive advantages. The development of more efficient and environmentally friendly magnet recycling processes is also a key area of focus, contributing to a more circular economy within the industry.
Report Scope & Segmentation Analysis
This comprehensive report segments the global Permanent Magnet Industry based on key material types and end-user industries to provide granular insights into market dynamics. The segmentation covers the following critical areas:
- Material Type:
- Neodymium-Iron-Boron (NdFeB) Magnets: This segment is expected to witness the highest growth due to its superior magnetic properties, driving billions in market value.
- Ferrite Magnets: Maintaining a strong market presence due to its cost-effectiveness, this segment contributes billions across various applications.
- Samarium Cobalt (SmCo) Magnets: Essential for high-temperature and demanding environments, this niche segment commands significant value in billions.
- Alnico Magnets: Catering to specialized applications, this segment provides consistent value in billions.
- End-User Industry:
- Automotive: The electric vehicle revolution is a primary growth catalyst, projecting billions in market expansion.
- Electronics: Continual innovation in consumer electronics sustains a robust demand, contributing billions.
- Industrial: Automation and efficiency drives are fueling steady growth, representing billions.
- Power Generation: The renewable energy surge is a major driver, with wind power leading the charge and projecting billions in future market value.
- Other End-User Industries: Including aerospace, medical, and defense, this segment offers specialized, high-value opportunities, adding billions to the overall market.
Each segment is analyzed with detailed growth projections, current market sizes in billions, and an assessment of competitive dynamics, offering a complete picture of the industry landscape.
Key Drivers of Permanent Magnet Industry Growth
The Permanent Magnet Industry is experiencing robust growth driven by several interconnected factors. The global push towards electrification, particularly in the automotive sector with the exponential rise of electric vehicles (EVs), is a paramount driver. EVs require powerful and efficient permanent magnet motors, significantly increasing demand for rare earth magnets like Neodymium-Iron-Boron (NdFeB), contributing billions to the market. The expansion of renewable energy infrastructure, especially wind power generation, is another significant catalyst, with large-scale wind turbines relying on high-performance permanent magnets. Technological advancements enabling smaller, more powerful, and energy-efficient electronic devices are also fueling consistent demand, adding billions to the market. Furthermore, government policies promoting clean energy, sustainable manufacturing, and strategic resource security are creating a favorable environment for growth, with investments in the billions expected.
Challenges in the Permanent Magnet Industry Sector
Despite its strong growth trajectory, the Permanent Magnet Industry faces several significant challenges. The primary challenge revolves around the supply chain volatility and geopolitical risks associated with rare earth elements, which are critical for high-performance magnets like NdFeB. China's dominant position in rare earth mining and processing creates potential bottlenecks and price fluctuations, impacting billions of dollars in manufacturing costs. Environmental regulations concerning the extraction and processing of rare earth minerals are becoming increasingly stringent, adding to operational complexities and costs. The high cost of research and development for alternative magnet materials and improved recycling processes also presents a financial barrier, requiring substantial investments in the billions. Competitive pressures from established players and the emergence of new manufacturers, particularly in Asia, can lead to price erosion and margin pressures across the sector, affecting billions in revenue.
Emerging Opportunities in Permanent Magnet Industry
The Permanent Magnet Industry is ripe with emerging opportunities driven by innovation and evolving market demands. The continued expansion of the electric vehicle (EV) market, beyond passenger cars to include trucks, buses, and other commercial vehicles, represents a massive growth avenue, promising billions in future revenue. The renewable energy sector, with ongoing advancements in wind turbine technology and the growing interest in tidal and other forms of marine energy, offers significant opportunities for high-power magnets. Furthermore, advancements in miniaturization and energy efficiency for consumer electronics, medical devices, and aerospace applications are creating demand for specialized, high-performance magnets, adding billions in niche markets. The development and scaling of efficient rare earth recycling technologies present a substantial opportunity for creating a more sustainable and secure supply chain, potentially unlocking billions in value from waste streams. Exploring new applications for advanced magnetic materials in emerging fields like quantum computing and advanced robotics also holds significant long-term potential, with anticipated billions in future market growth.
Leading Players in the Permanent Magnet Industry Market
- Anhui Earth Bear New Materials Co Ltd
- Lynas Rare Earths Ltd
- TDK Corporation
- Goudsmit Magnetics
- Daido Steel Co Ltd
- Galaxymagnets
- Hitachi Metals Ltd
- Arnold Magnetic Technologies
- Shin-Etsu Chemical Co Ltd
- GKN Powder Metallurgy
Key Developments in Permanent Magnet Industry Industry
- September 2022: Solvay announced plans to expand its rare earths operations in La Rochelle, France to enter the value chain for rare earths permanent magnets in Europe and serve customers in the wind power, electric vehicles, and electronics markets.
- July 2022: GKN Powder Metallurgy, a provider of powder metal solutions, entered the permanent magnets for the electric vehicle (EV) market. An investment is being planned to establish a capacity to produce up to 4,000 tons of permanent magnets per year for the EV market by 2024.
Strategic Outlook for Permanent Magnet Industry Market
The strategic outlook for the Permanent Magnet Industry is exceptionally positive, characterized by sustained high growth and expanding market influence. The accelerating global transition towards electric mobility and renewable energy sources will continue to be the primary growth catalysts, driving billions in demand for high-performance rare earth magnets. Strategic investments in securing and diversifying rare earth supply chains, coupled with advancements in magnet recycling technologies, will be crucial for long-term sustainability and cost management, impacting billions in operational expenses and potential revenue. Innovation in developing more powerful, thermally stable, and rare earth-lean permanent magnets will be key to maintaining competitive advantages and unlocking new applications, promising billions in future market penetration. Companies that focus on vertical integration, technological leadership, and strategic partnerships will be well-positioned to capitalize on the vast opportunities within this dynamic and evolving industry, contributing significantly to global economic growth and technological advancement.
Permanent Magnet Industry Segmentation
-
1. Material Type
- 1.1. Neodymium-Iron-Boron
- 1.2. Ferrite
- 1.3. Samarium Cobalt
- 1.4. Alnico
-
2. End-user Industry
- 2.1. Automotive
- 2.2. Electronics
- 2.3. Industrial
- 2.4. Power Generation
- 2.5. Other End-user Industries
Permanent Magnet Industry Segmentation By Geography
-
1. Asia Pacific
- 1.1. China
- 1.2. India
- 1.3. Japan
- 1.4. South Korea
- 1.5. Rest of Asia Pacific
-
2. North America
- 2.1. United States
- 2.2. Canada
- 2.3. Mexico
-
3. Europe
- 3.1. Germany
- 3.2. United Kingdom
- 3.3. France
- 3.4. Italy
- 3.5. Rest of Europe
-
4. South America
- 4.1. Brazil
- 4.2. Argentina
- 4.3. Rest of South America
-
5. Middle East and Africa
- 5.1. Saudi Arabia
- 5.2. South Africa
- 5.3. Rest of Middle East and Africa
Permanent Magnet Industry Regional Market Share
Geographic Coverage of Permanent Magnet Industry
Permanent Magnet Industry REPORT HIGHLIGHTS
| Aspects | Details |
|---|---|
| Study Period | 2020-2034 |
| Base Year | 2025 |
| Estimated Year | 2026 |
| Forecast Period | 2026-2034 |
| Historical Period | 2020-2025 |
| Growth Rate | CAGR of 8.7% from 2020-2034 |
| Segmentation |
|
Table of Contents
- 1. Introduction
- 1.1. Research Scope
- 1.2. Market Segmentation
- 1.3. Research Objective
- 1.4. Definitions and Assumptions
- 2. Executive Summary
- 2.1. Market Snapshot
- 3. Market Dynamics
- 3.1. Market Drivers
- 3.2. Market Restrains
- 3.3. Market Trends
- 3.4. Market Opportunities
- 4. Market Factor Analysis
- 4.1. Porters Five Forces
- 4.1.1. Bargaining Power of Suppliers
- 4.1.2. Bargaining Power of Buyers
- 4.1.3. Threat of New Entrants
- 4.1.4. Threat of Substitutes
- 4.1.5. Competitive Rivalry
- 4.2. PESTEL analysis
- 4.3. BCG Analysis
- 4.3.1. Stars (High Growth, High Market Share)
- 4.3.2. Cash Cows (Low Growth, High Market Share)
- 4.3.3. Question Mark (High Growth, Low Market Share)
- 4.3.4. Dogs (Low Growth, Low Market Share)
- 4.4. Ansoff Matrix Analysis
- 4.5. Supply Chain Analysis
- 4.6. Regulatory Landscape
- 4.7. Current Market Potential and Opportunity Assessment (TAM–SAM–SOM Framework)
- 4.8. RAX Analyst Note
- 4.1. Porters Five Forces
- 5. Market Analysis, Insights and Forecast 2021-2033
- 5.1. Market Analysis, Insights and Forecast - by Material Type
- 5.1.1. Neodymium-Iron-Boron
- 5.1.2. Ferrite
- 5.1.3. Samarium Cobalt
- 5.1.4. Alnico
- 5.2. Market Analysis, Insights and Forecast - by End-user Industry
- 5.2.1. Automotive
- 5.2.2. Electronics
- 5.2.3. Industrial
- 5.2.4. Power Generation
- 5.2.5. Other End-user Industries
- 5.3. Market Analysis, Insights and Forecast - by Region
- 5.3.1. Asia Pacific
- 5.3.2. North America
- 5.3.3. Europe
- 5.3.4. South America
- 5.3.5. Middle East and Africa
- 5.1. Market Analysis, Insights and Forecast - by Material Type
- 6. Global Permanent Magnet Industry Analysis, Insights and Forecast, 2021-2033
- 6.1. Market Analysis, Insights and Forecast - by Material Type
- 6.1.1. Neodymium-Iron-Boron
- 6.1.2. Ferrite
- 6.1.3. Samarium Cobalt
- 6.1.4. Alnico
- 6.2. Market Analysis, Insights and Forecast - by End-user Industry
- 6.2.1. Automotive
- 6.2.2. Electronics
- 6.2.3. Industrial
- 6.2.4. Power Generation
- 6.2.5. Other End-user Industries
- 6.1. Market Analysis, Insights and Forecast - by Material Type
- 7. Asia Pacific Permanent Magnet Industry Analysis, Insights and Forecast, 2020-2032
- 7.1. Market Analysis, Insights and Forecast - by Material Type
- 7.1.1. Neodymium-Iron-Boron
- 7.1.2. Ferrite
- 7.1.3. Samarium Cobalt
- 7.1.4. Alnico
- 7.2. Market Analysis, Insights and Forecast - by End-user Industry
- 7.2.1. Automotive
- 7.2.2. Electronics
- 7.2.3. Industrial
- 7.2.4. Power Generation
- 7.2.5. Other End-user Industries
- 7.1. Market Analysis, Insights and Forecast - by Material Type
- 8. North America Permanent Magnet Industry Analysis, Insights and Forecast, 2020-2032
- 8.1. Market Analysis, Insights and Forecast - by Material Type
- 8.1.1. Neodymium-Iron-Boron
- 8.1.2. Ferrite
- 8.1.3. Samarium Cobalt
- 8.1.4. Alnico
- 8.2. Market Analysis, Insights and Forecast - by End-user Industry
- 8.2.1. Automotive
- 8.2.2. Electronics
- 8.2.3. Industrial
- 8.2.4. Power Generation
- 8.2.5. Other End-user Industries
- 8.1. Market Analysis, Insights and Forecast - by Material Type
- 9. Europe Permanent Magnet Industry Analysis, Insights and Forecast, 2020-2032
- 9.1. Market Analysis, Insights and Forecast - by Material Type
- 9.1.1. Neodymium-Iron-Boron
- 9.1.2. Ferrite
- 9.1.3. Samarium Cobalt
- 9.1.4. Alnico
- 9.2. Market Analysis, Insights and Forecast - by End-user Industry
- 9.2.1. Automotive
- 9.2.2. Electronics
- 9.2.3. Industrial
- 9.2.4. Power Generation
- 9.2.5. Other End-user Industries
- 9.1. Market Analysis, Insights and Forecast - by Material Type
- 10. South America Permanent Magnet Industry Analysis, Insights and Forecast, 2020-2032
- 10.1. Market Analysis, Insights and Forecast - by Material Type
- 10.1.1. Neodymium-Iron-Boron
- 10.1.2. Ferrite
- 10.1.3. Samarium Cobalt
- 10.1.4. Alnico
- 10.2. Market Analysis, Insights and Forecast - by End-user Industry
- 10.2.1. Automotive
- 10.2.2. Electronics
- 10.2.3. Industrial
- 10.2.4. Power Generation
- 10.2.5. Other End-user Industries
- 10.1. Market Analysis, Insights and Forecast - by Material Type
- 11. Middle East and Africa Permanent Magnet Industry Analysis, Insights and Forecast, 2020-2032
- 11.1. Market Analysis, Insights and Forecast - by Material Type
- 11.1.1. Neodymium-Iron-Boron
- 11.1.2. Ferrite
- 11.1.3. Samarium Cobalt
- 11.1.4. Alnico
- 11.2. Market Analysis, Insights and Forecast - by End-user Industry
- 11.2.1. Automotive
- 11.2.2. Electronics
- 11.2.3. Industrial
- 11.2.4. Power Generation
- 11.2.5. Other End-user Industries
- 11.1. Market Analysis, Insights and Forecast - by Material Type
- 12. Competitive Analysis
- 12.1. Company Profiles
- 12.1.1 Anhui Earth Bear New Materials Co Ltd
- 12.1.1.1. Company Overview
- 12.1.1.2. Products
- 12.1.1.3. Company Financials
- 12.1.1.4. SWOT Analysis
- 12.1.2 Lynas Rare Earths Ltd
- 12.1.2.1. Company Overview
- 12.1.2.2. Products
- 12.1.2.3. Company Financials
- 12.1.2.4. SWOT Analysis
- 12.1.3 TDK Corporation
- 12.1.3.1. Company Overview
- 12.1.3.2. Products
- 12.1.3.3. Company Financials
- 12.1.3.4. SWOT Analysis
- 12.1.4 Goudsmit Magnetics
- 12.1.4.1. Company Overview
- 12.1.4.2. Products
- 12.1.4.3. Company Financials
- 12.1.4.4. SWOT Analysis
- 12.1.5 Daido Steel Co Ltd
- 12.1.5.1. Company Overview
- 12.1.5.2. Products
- 12.1.5.3. Company Financials
- 12.1.5.4. SWOT Analysis
- 12.1.6 Galaxymagnets
- 12.1.6.1. Company Overview
- 12.1.6.2. Products
- 12.1.6.3. Company Financials
- 12.1.6.4. SWOT Analysis
- 12.1.7 Hitachi Metals Ltd
- 12.1.7.1. Company Overview
- 12.1.7.2. Products
- 12.1.7.3. Company Financials
- 12.1.7.4. SWOT Analysis
- 12.1.8 Arnold Magnetic Technologies
- 12.1.8.1. Company Overview
- 12.1.8.2. Products
- 12.1.8.3. Company Financials
- 12.1.8.4. SWOT Analysis
- 12.1.9 Shin-Etsu Chemical Co Ltd
- 12.1.9.1. Company Overview
- 12.1.9.2. Products
- 12.1.9.3. Company Financials
- 12.1.9.4. SWOT Analysis
- 12.1.10 GKN Powder Metallurgy
- 12.1.10.1. Company Overview
- 12.1.10.2. Products
- 12.1.10.3. Company Financials
- 12.1.10.4. SWOT Analysis
- 12.1.1 Anhui Earth Bear New Materials Co Ltd
- 12.2. Market Entropy
- 12.2.1 Company's Key Areas Served
- 12.2.2 Recent Developments
- 12.3. Company Market Share Analysis 2025
- 12.3.1 Top 5 Companies Market Share Analysis
- 12.3.2 Top 3 Companies Market Share Analysis
- 12.4. List of Potential Customers
- 13. Research Methodology
List of Figures
- Figure 1: Global Permanent Magnet Industry Revenue Breakdown (Billion, %) by Region 2025 & 2033
- Figure 2: Global Permanent Magnet Industry Volume Breakdown (K Tons, %) by Region 2025 & 2033
- Figure 3: Asia Pacific Permanent Magnet Industry Revenue (Billion), by Material Type 2025 & 2033
- Figure 4: Asia Pacific Permanent Magnet Industry Volume (K Tons), by Material Type 2025 & 2033
- Figure 5: Asia Pacific Permanent Magnet Industry Revenue Share (%), by Material Type 2025 & 2033
- Figure 6: Asia Pacific Permanent Magnet Industry Volume Share (%), by Material Type 2025 & 2033
- Figure 7: Asia Pacific Permanent Magnet Industry Revenue (Billion), by End-user Industry 2025 & 2033
- Figure 8: Asia Pacific Permanent Magnet Industry Volume (K Tons), by End-user Industry 2025 & 2033
- Figure 9: Asia Pacific Permanent Magnet Industry Revenue Share (%), by End-user Industry 2025 & 2033
- Figure 10: Asia Pacific Permanent Magnet Industry Volume Share (%), by End-user Industry 2025 & 2033
- Figure 11: Asia Pacific Permanent Magnet Industry Revenue (Billion), by Country 2025 & 2033
- Figure 12: Asia Pacific Permanent Magnet Industry Volume (K Tons), by Country 2025 & 2033
- Figure 13: Asia Pacific Permanent Magnet Industry Revenue Share (%), by Country 2025 & 2033
- Figure 14: Asia Pacific Permanent Magnet Industry Volume Share (%), by Country 2025 & 2033
- Figure 15: North America Permanent Magnet Industry Revenue (Billion), by Material Type 2025 & 2033
- Figure 16: North America Permanent Magnet Industry Volume (K Tons), by Material Type 2025 & 2033
- Figure 17: North America Permanent Magnet Industry Revenue Share (%), by Material Type 2025 & 2033
- Figure 18: North America Permanent Magnet Industry Volume Share (%), by Material Type 2025 & 2033
- Figure 19: North America Permanent Magnet Industry Revenue (Billion), by End-user Industry 2025 & 2033
- Figure 20: North America Permanent Magnet Industry Volume (K Tons), by End-user Industry 2025 & 2033
- Figure 21: North America Permanent Magnet Industry Revenue Share (%), by End-user Industry 2025 & 2033
- Figure 22: North America Permanent Magnet Industry Volume Share (%), by End-user Industry 2025 & 2033
- Figure 23: North America Permanent Magnet Industry Revenue (Billion), by Country 2025 & 2033
- Figure 24: North America Permanent Magnet Industry Volume (K Tons), by Country 2025 & 2033
- Figure 25: North America Permanent Magnet Industry Revenue Share (%), by Country 2025 & 2033
- Figure 26: North America Permanent Magnet Industry Volume Share (%), by Country 2025 & 2033
- Figure 27: Europe Permanent Magnet Industry Revenue (Billion), by Material Type 2025 & 2033
- Figure 28: Europe Permanent Magnet Industry Volume (K Tons), by Material Type 2025 & 2033
- Figure 29: Europe Permanent Magnet Industry Revenue Share (%), by Material Type 2025 & 2033
- Figure 30: Europe Permanent Magnet Industry Volume Share (%), by Material Type 2025 & 2033
- Figure 31: Europe Permanent Magnet Industry Revenue (Billion), by End-user Industry 2025 & 2033
- Figure 32: Europe Permanent Magnet Industry Volume (K Tons), by End-user Industry 2025 & 2033
- Figure 33: Europe Permanent Magnet Industry Revenue Share (%), by End-user Industry 2025 & 2033
- Figure 34: Europe Permanent Magnet Industry Volume Share (%), by End-user Industry 2025 & 2033
- Figure 35: Europe Permanent Magnet Industry Revenue (Billion), by Country 2025 & 2033
- Figure 36: Europe Permanent Magnet Industry Volume (K Tons), by Country 2025 & 2033
- Figure 37: Europe Permanent Magnet Industry Revenue Share (%), by Country 2025 & 2033
- Figure 38: Europe Permanent Magnet Industry Volume Share (%), by Country 2025 & 2033
- Figure 39: South America Permanent Magnet Industry Revenue (Billion), by Material Type 2025 & 2033
- Figure 40: South America Permanent Magnet Industry Volume (K Tons), by Material Type 2025 & 2033
- Figure 41: South America Permanent Magnet Industry Revenue Share (%), by Material Type 2025 & 2033
- Figure 42: South America Permanent Magnet Industry Volume Share (%), by Material Type 2025 & 2033
- Figure 43: South America Permanent Magnet Industry Revenue (Billion), by End-user Industry 2025 & 2033
- Figure 44: South America Permanent Magnet Industry Volume (K Tons), by End-user Industry 2025 & 2033
- Figure 45: South America Permanent Magnet Industry Revenue Share (%), by End-user Industry 2025 & 2033
- Figure 46: South America Permanent Magnet Industry Volume Share (%), by End-user Industry 2025 & 2033
- Figure 47: South America Permanent Magnet Industry Revenue (Billion), by Country 2025 & 2033
- Figure 48: South America Permanent Magnet Industry Volume (K Tons), by Country 2025 & 2033
- Figure 49: South America Permanent Magnet Industry Revenue Share (%), by Country 2025 & 2033
- Figure 50: South America Permanent Magnet Industry Volume Share (%), by Country 2025 & 2033
- Figure 51: Middle East and Africa Permanent Magnet Industry Revenue (Billion), by Material Type 2025 & 2033
- Figure 52: Middle East and Africa Permanent Magnet Industry Volume (K Tons), by Material Type 2025 & 2033
- Figure 53: Middle East and Africa Permanent Magnet Industry Revenue Share (%), by Material Type 2025 & 2033
- Figure 54: Middle East and Africa Permanent Magnet Industry Volume Share (%), by Material Type 2025 & 2033
- Figure 55: Middle East and Africa Permanent Magnet Industry Revenue (Billion), by End-user Industry 2025 & 2033
- Figure 56: Middle East and Africa Permanent Magnet Industry Volume (K Tons), by End-user Industry 2025 & 2033
- Figure 57: Middle East and Africa Permanent Magnet Industry Revenue Share (%), by End-user Industry 2025 & 2033
- Figure 58: Middle East and Africa Permanent Magnet Industry Volume Share (%), by End-user Industry 2025 & 2033
- Figure 59: Middle East and Africa Permanent Magnet Industry Revenue (Billion), by Country 2025 & 2033
- Figure 60: Middle East and Africa Permanent Magnet Industry Volume (K Tons), by Country 2025 & 2033
- Figure 61: Middle East and Africa Permanent Magnet Industry Revenue Share (%), by Country 2025 & 2033
- Figure 62: Middle East and Africa Permanent Magnet Industry Volume Share (%), by Country 2025 & 2033
List of Tables
- Table 1: Global Permanent Magnet Industry Revenue Billion Forecast, by Material Type 2020 & 2033
- Table 2: Global Permanent Magnet Industry Volume K Tons Forecast, by Material Type 2020 & 2033
- Table 3: Global Permanent Magnet Industry Revenue Billion Forecast, by End-user Industry 2020 & 2033
- Table 4: Global Permanent Magnet Industry Volume K Tons Forecast, by End-user Industry 2020 & 2033
- Table 5: Global Permanent Magnet Industry Revenue Billion Forecast, by Region 2020 & 2033
- Table 6: Global Permanent Magnet Industry Volume K Tons Forecast, by Region 2020 & 2033
- Table 7: Global Permanent Magnet Industry Revenue Billion Forecast, by Material Type 2020 & 2033
- Table 8: Global Permanent Magnet Industry Volume K Tons Forecast, by Material Type 2020 & 2033
- Table 9: Global Permanent Magnet Industry Revenue Billion Forecast, by End-user Industry 2020 & 2033
- Table 10: Global Permanent Magnet Industry Volume K Tons Forecast, by End-user Industry 2020 & 2033
- Table 11: Global Permanent Magnet Industry Revenue Billion Forecast, by Country 2020 & 2033
- Table 12: Global Permanent Magnet Industry Volume K Tons Forecast, by Country 2020 & 2033
- Table 13: China Permanent Magnet Industry Revenue (Billion) Forecast, by Application 2020 & 2033
- Table 14: China Permanent Magnet Industry Volume (K Tons) Forecast, by Application 2020 & 2033
- Table 15: India Permanent Magnet Industry Revenue (Billion) Forecast, by Application 2020 & 2033
- Table 16: India Permanent Magnet Industry Volume (K Tons) Forecast, by Application 2020 & 2033
- Table 17: Japan Permanent Magnet Industry Revenue (Billion) Forecast, by Application 2020 & 2033
- Table 18: Japan Permanent Magnet Industry Volume (K Tons) Forecast, by Application 2020 & 2033
- Table 19: South Korea Permanent Magnet Industry Revenue (Billion) Forecast, by Application 2020 & 2033
- Table 20: South Korea Permanent Magnet Industry Volume (K Tons) Forecast, by Application 2020 & 2033
- Table 21: Rest of Asia Pacific Permanent Magnet Industry Revenue (Billion) Forecast, by Application 2020 & 2033
- Table 22: Rest of Asia Pacific Permanent Magnet Industry Volume (K Tons) Forecast, by Application 2020 & 2033
- Table 23: Global Permanent Magnet Industry Revenue Billion Forecast, by Material Type 2020 & 2033
- Table 24: Global Permanent Magnet Industry Volume K Tons Forecast, by Material Type 2020 & 2033
- Table 25: Global Permanent Magnet Industry Revenue Billion Forecast, by End-user Industry 2020 & 2033
- Table 26: Global Permanent Magnet Industry Volume K Tons Forecast, by End-user Industry 2020 & 2033
- Table 27: Global Permanent Magnet Industry Revenue Billion Forecast, by Country 2020 & 2033
- Table 28: Global Permanent Magnet Industry Volume K Tons Forecast, by Country 2020 & 2033
- Table 29: United States Permanent Magnet Industry Revenue (Billion) Forecast, by Application 2020 & 2033
- Table 30: United States Permanent Magnet Industry Volume (K Tons) Forecast, by Application 2020 & 2033
- Table 31: Canada Permanent Magnet Industry Revenue (Billion) Forecast, by Application 2020 & 2033
- Table 32: Canada Permanent Magnet Industry Volume (K Tons) Forecast, by Application 2020 & 2033
- Table 33: Mexico Permanent Magnet Industry Revenue (Billion) Forecast, by Application 2020 & 2033
- Table 34: Mexico Permanent Magnet Industry Volume (K Tons) Forecast, by Application 2020 & 2033
- Table 35: Global Permanent Magnet Industry Revenue Billion Forecast, by Material Type 2020 & 2033
- Table 36: Global Permanent Magnet Industry Volume K Tons Forecast, by Material Type 2020 & 2033
- Table 37: Global Permanent Magnet Industry Revenue Billion Forecast, by End-user Industry 2020 & 2033
- Table 38: Global Permanent Magnet Industry Volume K Tons Forecast, by End-user Industry 2020 & 2033
- Table 39: Global Permanent Magnet Industry Revenue Billion Forecast, by Country 2020 & 2033
- Table 40: Global Permanent Magnet Industry Volume K Tons Forecast, by Country 2020 & 2033
- Table 41: Germany Permanent Magnet Industry Revenue (Billion) Forecast, by Application 2020 & 2033
- Table 42: Germany Permanent Magnet Industry Volume (K Tons) Forecast, by Application 2020 & 2033
- Table 43: United Kingdom Permanent Magnet Industry Revenue (Billion) Forecast, by Application 2020 & 2033
- Table 44: United Kingdom Permanent Magnet Industry Volume (K Tons) Forecast, by Application 2020 & 2033
- Table 45: France Permanent Magnet Industry Revenue (Billion) Forecast, by Application 2020 & 2033
- Table 46: France Permanent Magnet Industry Volume (K Tons) Forecast, by Application 2020 & 2033
- Table 47: Italy Permanent Magnet Industry Revenue (Billion) Forecast, by Application 2020 & 2033
- Table 48: Italy Permanent Magnet Industry Volume (K Tons) Forecast, by Application 2020 & 2033
- Table 49: Rest of Europe Permanent Magnet Industry Revenue (Billion) Forecast, by Application 2020 & 2033
- Table 50: Rest of Europe Permanent Magnet Industry Volume (K Tons) Forecast, by Application 2020 & 2033
- Table 51: Global Permanent Magnet Industry Revenue Billion Forecast, by Material Type 2020 & 2033
- Table 52: Global Permanent Magnet Industry Volume K Tons Forecast, by Material Type 2020 & 2033
- Table 53: Global Permanent Magnet Industry Revenue Billion Forecast, by End-user Industry 2020 & 2033
- Table 54: Global Permanent Magnet Industry Volume K Tons Forecast, by End-user Industry 2020 & 2033
- Table 55: Global Permanent Magnet Industry Revenue Billion Forecast, by Country 2020 & 2033
- Table 56: Global Permanent Magnet Industry Volume K Tons Forecast, by Country 2020 & 2033
- Table 57: Brazil Permanent Magnet Industry Revenue (Billion) Forecast, by Application 2020 & 2033
- Table 58: Brazil Permanent Magnet Industry Volume (K Tons) Forecast, by Application 2020 & 2033
- Table 59: Argentina Permanent Magnet Industry Revenue (Billion) Forecast, by Application 2020 & 2033
- Table 60: Argentina Permanent Magnet Industry Volume (K Tons) Forecast, by Application 2020 & 2033
- Table 61: Rest of South America Permanent Magnet Industry Revenue (Billion) Forecast, by Application 2020 & 2033
- Table 62: Rest of South America Permanent Magnet Industry Volume (K Tons) Forecast, by Application 2020 & 2033
- Table 63: Global Permanent Magnet Industry Revenue Billion Forecast, by Material Type 2020 & 2033
- Table 64: Global Permanent Magnet Industry Volume K Tons Forecast, by Material Type 2020 & 2033
- Table 65: Global Permanent Magnet Industry Revenue Billion Forecast, by End-user Industry 2020 & 2033
- Table 66: Global Permanent Magnet Industry Volume K Tons Forecast, by End-user Industry 2020 & 2033
- Table 67: Global Permanent Magnet Industry Revenue Billion Forecast, by Country 2020 & 2033
- Table 68: Global Permanent Magnet Industry Volume K Tons Forecast, by Country 2020 & 2033
- Table 69: Saudi Arabia Permanent Magnet Industry Revenue (Billion) Forecast, by Application 2020 & 2033
- Table 70: Saudi Arabia Permanent Magnet Industry Volume (K Tons) Forecast, by Application 2020 & 2033
- Table 71: South Africa Permanent Magnet Industry Revenue (Billion) Forecast, by Application 2020 & 2033
- Table 72: South Africa Permanent Magnet Industry Volume (K Tons) Forecast, by Application 2020 & 2033
- Table 73: Rest of Middle East and Africa Permanent Magnet Industry Revenue (Billion) Forecast, by Application 2020 & 2033
- Table 74: Rest of Middle East and Africa Permanent Magnet Industry Volume (K Tons) Forecast, by Application 2020 & 2033
Frequently Asked Questions
1. What is the projected Compound Annual Growth Rate (CAGR) of the Permanent Magnet Industry?
The projected CAGR is approximately 8.7%.
2. Which companies are prominent players in the Permanent Magnet Industry?
Key companies in the market include Anhui Earth Bear New Materials Co Ltd, Lynas Rare Earths Ltd, TDK Corporation, Goudsmit Magnetics, Daido Steel Co Ltd, Galaxymagnets, Hitachi Metals Ltd, Arnold Magnetic Technologies, Shin-Etsu Chemical Co Ltd, GKN Powder Metallurgy.
3. What are the main segments of the Permanent Magnet Industry?
The market segments include Material Type, End-user Industry.
4. Can you provide details about the market size?
The market size is estimated to be USD 22.1 Billion as of 2022.
5. What are some drivers contributing to market growth?
Increasing Electro-mechanical Applications; Other Drivers.
6. What are the notable trends driving market growth?
Growing Demand from Electronics Industry.
7. Are there any restraints impacting market growth?
Competition from Substitutes; Other Restraints.
8. Can you provide examples of recent developments in the market?
September 2022: Solvay announced plans to expand its rare earths operations in La Rochelle, France to enter the value chain for rare earths permanent magnets in Europe and serve customers in the wind power, electric vehicles, and electronics markets.
9. What pricing options are available for accessing the report?
Pricing options include single-user, multi-user, and enterprise licenses priced at USD 4750, USD 5250, and USD 8750 respectively.
10. Is the market size provided in terms of value or volume?
The market size is provided in terms of value, measured in Billion and volume, measured in K Tons.
11. Are there any specific market keywords associated with the report?
Yes, the market keyword associated with the report is "Permanent Magnet Industry," which aids in identifying and referencing the specific market segment covered.
12. How do I determine which pricing option suits my needs best?
The pricing options vary based on user requirements and access needs. Individual users may opt for single-user licenses, while businesses requiring broader access may choose multi-user or enterprise licenses for cost-effective access to the report.
13. Are there any additional resources or data provided in the Permanent Magnet Industry report?
While the report offers comprehensive insights, it's advisable to review the specific contents or supplementary materials provided to ascertain if additional resources or data are available.
14. How can I stay updated on further developments or reports in the Permanent Magnet Industry?
To stay informed about further developments, trends, and reports in the Permanent Magnet Industry, consider subscribing to industry newsletters, following relevant companies and organizations, or regularly checking reputable industry news sources and publications.
Methodology
Step 1 - Identification of Relevant Samples Size from Population Database


Step 2 - Approaches for Defining Global Market Size (Value, Volume* & Price*)

Note*: In applicable scenarios
Step 3 - Data Sources
Primary Research
- Web Analytics
- Survey Reports
- Research Institute
- Latest Research Reports
- Opinion Leaders
Secondary Research
- Annual Reports
- White Paper
- Latest Press Release
- Industry Association
- Paid Database
- Investor Presentations

Step 4 - Data Triangulation
Involves using different sources of information in order to increase the validity of a study
These sources are likely to be stakeholders in a program - participants, other researchers, program staff, other community members, and so on.
Then we put all data in single framework & apply various statistical tools to find out the dynamic on the market.
During the analysis stage, feedback from the stakeholder groups would be compared to determine areas of agreement as well as areas of divergence

