
Key Insights
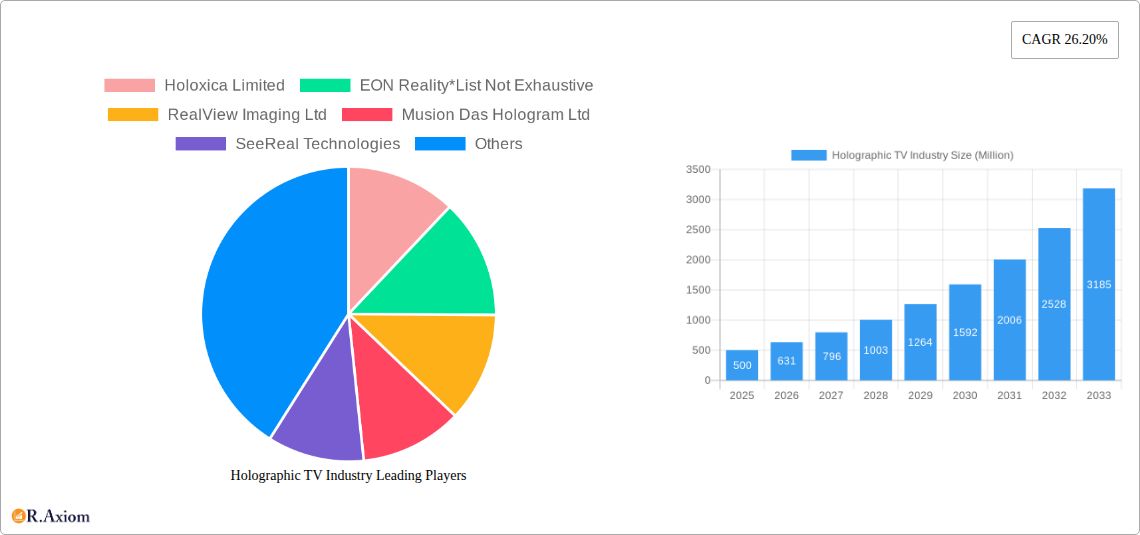
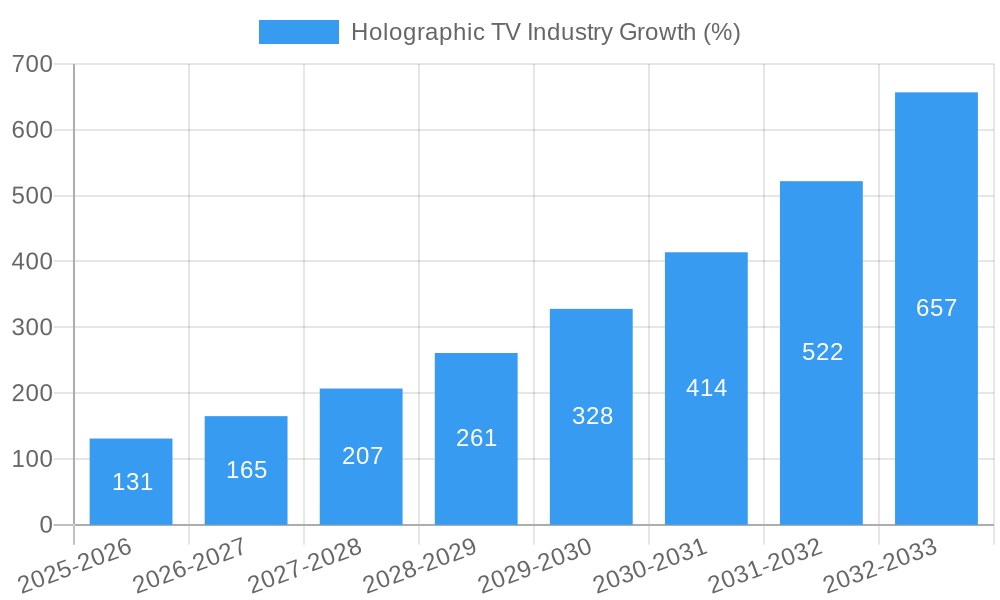
The holographic television (Holographic TV) industry is experiencing rapid growth, projected to maintain a robust Compound Annual Growth Rate (CAGR) of 26.20% from 2025 to 2033. This expansion is driven by several key factors. Firstly, advancements in laser plasma technology, micromagnetic piston displays, and holographic television displays are significantly improving image quality and resolution, making holographic experiences more realistic and engaging. Secondly, the increasing adoption of holographic technology across various end-user sectors, including consumer electronics, industrial applications (e.g., simulations, training), aerospace and defense (e.g., advanced simulations and remote operations), healthcare (e.g., 3D medical imaging), and education (e.g., interactive learning environments) is fueling demand. The market is further propelled by the growing consumer preference for immersive entertainment experiences and the increasing accessibility of holographic technology due to ongoing technological innovation and decreasing manufacturing costs.
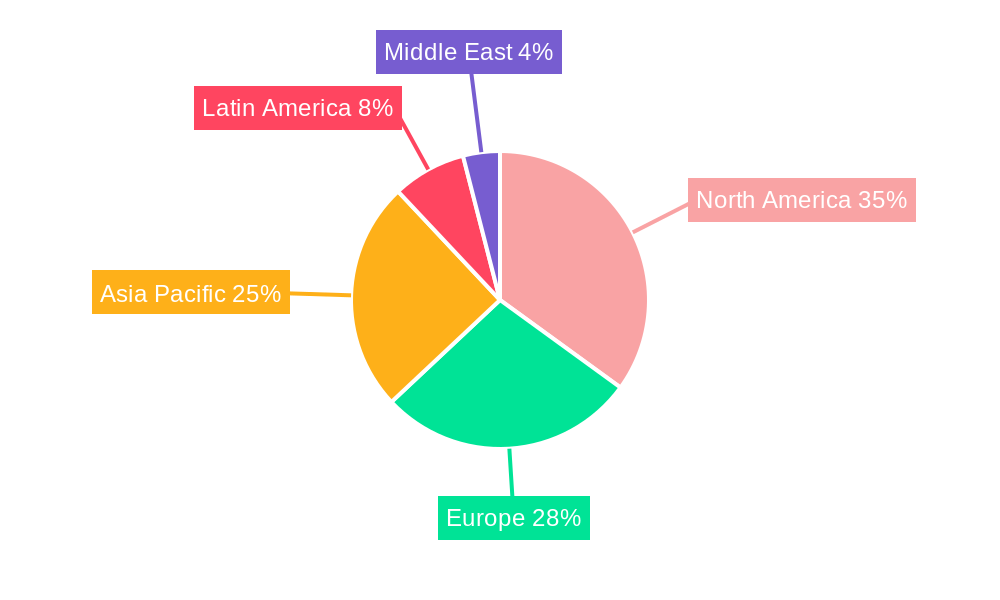
However, despite this promising outlook, several challenges restrain market growth. High manufacturing costs, particularly for advanced holographic display technologies such as touchable holograms, pose a barrier to wider adoption. Furthermore, the development of robust and user-friendly software and content creation tools is crucial for realizing the full potential of the technology. Addressing these limitations through collaborative efforts between technology developers, content creators, and industry stakeholders will be essential for sustained market expansion. The Asia-Pacific region is expected to be a significant growth driver, given its large consumer base and expanding technological infrastructure. North America and Europe are also key markets, with established technology ecosystems and high consumer spending on entertainment and technology. The competitive landscape is dynamic, with established players like Holoxica Limited and EON Reality, alongside emerging companies, continuously innovating and vying for market share.
Holographic TV Industry: Market Analysis & Forecast (2019-2033)
This comprehensive report provides an in-depth analysis of the holographic TV industry, encompassing market size, segmentation, growth drivers, challenges, and key players. The study period covers 2019-2033, with 2025 as the base and estimated year. The forecast period spans 2025-2033, and historical data is included for 2019-2024. The report offers actionable insights for industry stakeholders, investors, and businesses seeking to navigate this rapidly evolving market.
Holographic TV Industry Market Concentration & Innovation
The holographic TV industry is characterized by a moderately concentrated market, with a few key players holding significant market share. While precise market share data for each company is unavailable and requires further market research, estimates suggest that the top five players account for approximately xx% of the total market revenue in 2025. This concentration is driven by significant capital investments required for R&D and manufacturing. The industry is witnessing rapid innovation, fueled by advancements in laser technology, display technologies, and software development. Key innovation drivers include the development of more efficient and cost-effective holographic displays, improved image resolution, and the integration of interactive features. Regulatory frameworks governing the safety and use of holographic displays are still evolving and vary by region, presenting both opportunities and challenges. Substitute technologies, such as advanced 3D displays and virtual reality (VR), continue to compete for market share. However, the unique immersive experience offered by holographic displays creates a differentiated niche. End-user trends point towards increasing demand from entertainment, education, and healthcare sectors. M&A activities in the sector have been relatively moderate in recent years, with deal values estimated to total around $xx Million during 2019-2024. However, as the market matures, increased consolidation is anticipated.
- Market Concentration: Top 5 players account for approximately xx% of market revenue (2025 estimate).
- Innovation Drivers: Advancements in laser technology, display technologies, software development.
- Regulatory Frameworks: Evolving and vary by region.
- Product Substitutes: Advanced 3D displays, VR.
- M&A Activity: Deal values estimated at $xx Million (2019-2024).
Holographic TV Industry Industry Trends & Insights
The holographic TV industry is experiencing significant growth, driven by increasing consumer demand for immersive entertainment experiences, technological advancements, and the expansion of applications across various sectors. The market is projected to witness a Compound Annual Growth Rate (CAGR) of xx% during the forecast period (2025-2033), reaching a market value of $xx Million by 2033. Technological disruptions, such as the development of more compact and energy-efficient holographic projectors and the integration of artificial intelligence (AI) for enhanced user interaction, are transforming the market landscape. Consumer preferences are shifting towards higher resolution, greater realism, and interactive features. Competitive dynamics are shaped by technological advancements, pricing strategies, and the ability to develop innovative applications. Market penetration is expected to increase gradually, with significant growth in consumer applications and expanding adoption across various industrial sectors. The integration of holographic technology with other emerging technologies like augmented reality (AR) and the metaverse is expected to fuel further growth. The industry is also witnessing a gradual shift from large-scale, high-cost holographic displays towards more affordable and compact solutions, making them accessible to a wider range of consumers and industries.
Dominant Markets & Segments in Holographic TV Industry
The North American region currently holds a leading position in the holographic TV market, driven by strong technological advancements, substantial investments in R&D, and a high adoption rate in the entertainment and industrial sectors. Within North America, the United States is the most dominant market due to strong consumer demand and technological leadership.
By Product:
- Holographic Television Display: This segment is projected to dominate the market due to increasing consumer demand for immersive entertainment experiences and the gradual reduction in production costs. Key drivers include technological advancements leading to better image quality and affordability.
- Touchable Holograms: This segment is witnessing rapid growth due to its applications in interactive displays and gaming. Advancements in sensor technology and software development are key drivers.
- Laser Plasma and Micromagnetic Piston Display: While these technologies hold significant potential, they are currently at relatively nascent stages of development, limiting their market share in comparison to the other segments.
By End User:
- Consumer Applications: The consumer segment is anticipated to experience substantial growth, propelled by increased disposable incomes and the desire for advanced home entertainment systems.
- Industrial Applications: Adoption in industrial sectors like manufacturing and engineering for enhanced training and design visualization is projected to see a significant rise.
- Aerospace and Defense: This segment is expected to show moderate growth, driven by the need for improved simulation and training systems.
- Healthcare and Education: Adoption in these sectors is growing at a moderate pace, driven by their potential for improved patient care and interactive learning.
Holographic TV Industry Product Developments
Recent product innovations include the development of compact holographic projectors, higher-resolution displays, and interactive features like gesture control. These advancements enhance market fit by making holographic displays more accessible and user-friendly. The integration of AI is also improving image quality and user experience. Competitive advantages are driven by technological leadership, cost-effectiveness, and the ability to develop innovative applications that cater to specific end-user needs. The emphasis is on creating more affordable and efficient systems while maintaining superior image quality and user interaction.
Report Scope & Segmentation Analysis
This report provides a comprehensive segmentation analysis of the holographic TV industry. The market is segmented by product type (Laser Plasma, Micromagnetic Piston Display, Holographic Television Display, Touchable Holograms) and by end user (Consumer Applications, Industrial Applications, Aerospace and Defense, Healthcare, Education, Other End Users). Each segment's growth projections, market size, and competitive dynamics are analyzed in detail. For instance, the Holographic Television Display segment is expected to experience the highest growth due to increasing consumer demand, while the Industrial Applications segment is expected to grow steadily driven by the adoption of holographic displays in various manufacturing and design processes.
Key Drivers of Holographic TV Industry Growth
Technological advancements in display technology and improved processing power are key drivers. Decreasing production costs are making holographic displays more affordable. Growing consumer demand for immersive entertainment experiences is also fueling market growth. Government initiatives promoting technological innovation and investments from private companies are further accelerating the market expansion.
Challenges in the Holographic TV Industry Sector
High production costs and the complexity of manufacturing technology present significant barriers to entry. The need for specialized skills and infrastructure limits widespread adoption. Competition from alternative technologies, such as advanced 3D displays and VR, poses a challenge. Regulatory hurdles related to safety and standards also impact market growth. The supply chain for specialized components can also be susceptible to disruptions. These factors combined may limit market expansion in the short term, but ongoing innovation aims to mitigate many of these challenges.
Emerging Opportunities in Holographic TV Industry
The integration of holographic technology with AR and VR presents significant opportunities. Expansion into new markets, such as automotive and retail, presents considerable potential. The development of more portable and user-friendly devices will increase consumer adoption. Increasing demand for immersive experiences in the metaverse provides a promising new avenue for growth.
Leading Players in the Holographic TV Industry Market
- Holoxica Limited
- EON Reality
- RealView Imaging Ltd
- Musion Das Hologram Ltd
- SeeReal Technologies
- Shenzhen SMX Display Technology Co Ltd
- AV Concepts Inc
- Provision Holding Inc
Key Developments in Holographic TV Industry Industry
- 2022-Q4: Holoxica Limited announces a new partnership to develop advanced holographic displays for medical applications.
- 2023-Q1: EON Reality launches a new software platform for creating interactive holographic experiences.
- 2024-Q2: Shenzhen SMX Display Technology Co Ltd unveils a new line of cost-effective holographic projectors for consumer applications.
- (Further developments require additional market research to be included here)
Strategic Outlook for Holographic TV Industry Market
The holographic TV market is poised for significant growth in the coming years. Continued technological advancements, decreasing production costs, and increasing consumer demand will drive market expansion. The integration of holographic technology with other emerging technologies, like AR and VR, will further fuel its growth. New applications in various sectors, such as healthcare, education, and retail, will create significant opportunities. The strategic focus should be on innovation, cost reduction, and expansion into new market segments. The market is expected to reach $xx Million by 2033, presenting significant investment and growth opportunities for businesses.
Holographic TV Industry Segmentation
-
1. Product
- 1.1. Laser Plasma
- 1.2. Micromagnetic Piston Display
- 1.3. Holographic Television Display
- 1.4. Touchable Holograms
-
2. End User
- 2.1. Consumer Applications
- 2.2. Industrial Applications
- 2.3. Aerospace and Defense
- 2.4. Healthcare
- 2.5. Education
- 2.6. Other End Users
Holographic TV Industry Segmentation By Geography
- 1. North America
- 2. Europe
- 3. Asia Pacific
- 4. Latin America
- 5. Middle East
Holographic TV Industry REPORT HIGHLIGHTS
| Aspects | Details |
|---|---|
| Study Period | 2019-2033 |
| Base Year | 2024 |
| Estimated Year | 2025 |
| Forecast Period | 2025-2033 |
| Historical Period | 2019-2024 |
| Growth Rate | CAGR of 26.20% from 2019-2033 |
| Segmentation |
|
Table of Contents
- 1. Introduction
- 1.1. Research Scope
- 1.2. Market Segmentation
- 1.3. Research Methodology
- 1.4. Definitions and Assumptions
- 2. Executive Summary
- 2.1. Introduction
- 3. Market Dynamics
- 3.1. Introduction
- 3.2. Market Drivers
- 3.2.1. ; Advancements in Holographic Technology; IncreasE Usage in Medical Imaging
- 3.3. Market Restrains
- 3.3.1. ; High Initial Invetsment and Product Cost
- 3.4. Market Trends
- 3.4.1. Laser Technology Expected to Increase the Growth in Education Sector
- 4. Market Factor Analysis
- 4.1. Porters Five Forces
- 4.2. Supply/Value Chain
- 4.3. PESTEL analysis
- 4.4. Market Entropy
- 4.5. Patent/Trademark Analysis
- 5. Global Holographic TV Industry Analysis, Insights and Forecast, 2019-2031
- 5.1. Market Analysis, Insights and Forecast - by Product
- 5.1.1. Laser Plasma
- 5.1.2. Micromagnetic Piston Display
- 5.1.3. Holographic Television Display
- 5.1.4. Touchable Holograms
- 5.2. Market Analysis, Insights and Forecast - by End User
- 5.2.1. Consumer Applications
- 5.2.2. Industrial Applications
- 5.2.3. Aerospace and Defense
- 5.2.4. Healthcare
- 5.2.5. Education
- 5.2.6. Other End Users
- 5.3. Market Analysis, Insights and Forecast - by Region
- 5.3.1. North America
- 5.3.2. Europe
- 5.3.3. Asia Pacific
- 5.3.4. Latin America
- 5.3.5. Middle East
- 5.1. Market Analysis, Insights and Forecast - by Product
- 6. North America Holographic TV Industry Analysis, Insights and Forecast, 2019-2031
- 6.1. Market Analysis, Insights and Forecast - by Product
- 6.1.1. Laser Plasma
- 6.1.2. Micromagnetic Piston Display
- 6.1.3. Holographic Television Display
- 6.1.4. Touchable Holograms
- 6.2. Market Analysis, Insights and Forecast - by End User
- 6.2.1. Consumer Applications
- 6.2.2. Industrial Applications
- 6.2.3. Aerospace and Defense
- 6.2.4. Healthcare
- 6.2.5. Education
- 6.2.6. Other End Users
- 6.1. Market Analysis, Insights and Forecast - by Product
- 7. Europe Holographic TV Industry Analysis, Insights and Forecast, 2019-2031
- 7.1. Market Analysis, Insights and Forecast - by Product
- 7.1.1. Laser Plasma
- 7.1.2. Micromagnetic Piston Display
- 7.1.3. Holographic Television Display
- 7.1.4. Touchable Holograms
- 7.2. Market Analysis, Insights and Forecast - by End User
- 7.2.1. Consumer Applications
- 7.2.2. Industrial Applications
- 7.2.3. Aerospace and Defense
- 7.2.4. Healthcare
- 7.2.5. Education
- 7.2.6. Other End Users
- 7.1. Market Analysis, Insights and Forecast - by Product
- 8. Asia Pacific Holographic TV Industry Analysis, Insights and Forecast, 2019-2031
- 8.1. Market Analysis, Insights and Forecast - by Product
- 8.1.1. Laser Plasma
- 8.1.2. Micromagnetic Piston Display
- 8.1.3. Holographic Television Display
- 8.1.4. Touchable Holograms
- 8.2. Market Analysis, Insights and Forecast - by End User
- 8.2.1. Consumer Applications
- 8.2.2. Industrial Applications
- 8.2.3. Aerospace and Defense
- 8.2.4. Healthcare
- 8.2.5. Education
- 8.2.6. Other End Users
- 8.1. Market Analysis, Insights and Forecast - by Product
- 9. Latin America Holographic TV Industry Analysis, Insights and Forecast, 2019-2031
- 9.1. Market Analysis, Insights and Forecast - by Product
- 9.1.1. Laser Plasma
- 9.1.2. Micromagnetic Piston Display
- 9.1.3. Holographic Television Display
- 9.1.4. Touchable Holograms
- 9.2. Market Analysis, Insights and Forecast - by End User
- 9.2.1. Consumer Applications
- 9.2.2. Industrial Applications
- 9.2.3. Aerospace and Defense
- 9.2.4. Healthcare
- 9.2.5. Education
- 9.2.6. Other End Users
- 9.1. Market Analysis, Insights and Forecast - by Product
- 10. Middle East Holographic TV Industry Analysis, Insights and Forecast, 2019-2031
- 10.1. Market Analysis, Insights and Forecast - by Product
- 10.1.1. Laser Plasma
- 10.1.2. Micromagnetic Piston Display
- 10.1.3. Holographic Television Display
- 10.1.4. Touchable Holograms
- 10.2. Market Analysis, Insights and Forecast - by End User
- 10.2.1. Consumer Applications
- 10.2.2. Industrial Applications
- 10.2.3. Aerospace and Defense
- 10.2.4. Healthcare
- 10.2.5. Education
- 10.2.6. Other End Users
- 10.1. Market Analysis, Insights and Forecast - by Product
- 11. North America Holographic TV Industry Analysis, Insights and Forecast, 2019-2031
- 11.1. Market Analysis, Insights and Forecast - By Country/Sub-region
- 11.1.1.
- 12. Europe Holographic TV Industry Analysis, Insights and Forecast, 2019-2031
- 12.1. Market Analysis, Insights and Forecast - By Country/Sub-region
- 12.1.1.
- 13. Asia Pacific Holographic TV Industry Analysis, Insights and Forecast, 2019-2031
- 13.1. Market Analysis, Insights and Forecast - By Country/Sub-region
- 13.1.1.
- 14. Latin America Holographic TV Industry Analysis, Insights and Forecast, 2019-2031
- 14.1. Market Analysis, Insights and Forecast - By Country/Sub-region
- 14.1.1.
- 15. Middle East Holographic TV Industry Analysis, Insights and Forecast, 2019-2031
- 15.1. Market Analysis, Insights and Forecast - By Country/Sub-region
- 15.1.1.
- 16. Competitive Analysis
- 16.1. Global Market Share Analysis 2024
- 16.2. Company Profiles
- 16.2.1 Holoxica Limited
- 16.2.1.1. Overview
- 16.2.1.2. Products
- 16.2.1.3. SWOT Analysis
- 16.2.1.4. Recent Developments
- 16.2.1.5. Financials (Based on Availability)
- 16.2.2 EON Reality*List Not Exhaustive
- 16.2.2.1. Overview
- 16.2.2.2. Products
- 16.2.2.3. SWOT Analysis
- 16.2.2.4. Recent Developments
- 16.2.2.5. Financials (Based on Availability)
- 16.2.3 RealView Imaging Ltd
- 16.2.3.1. Overview
- 16.2.3.2. Products
- 16.2.3.3. SWOT Analysis
- 16.2.3.4. Recent Developments
- 16.2.3.5. Financials (Based on Availability)
- 16.2.4 Musion Das Hologram Ltd
- 16.2.4.1. Overview
- 16.2.4.2. Products
- 16.2.4.3. SWOT Analysis
- 16.2.4.4. Recent Developments
- 16.2.4.5. Financials (Based on Availability)
- 16.2.5 SeeReal Technologies
- 16.2.5.1. Overview
- 16.2.5.2. Products
- 16.2.5.3. SWOT Analysis
- 16.2.5.4. Recent Developments
- 16.2.5.5. Financials (Based on Availability)
- 16.2.6 Shenzhen SMX Display Technology Co Ltd
- 16.2.6.1. Overview
- 16.2.6.2. Products
- 16.2.6.3. SWOT Analysis
- 16.2.6.4. Recent Developments
- 16.2.6.5. Financials (Based on Availability)
- 16.2.7 AV Concepts Inc
- 16.2.7.1. Overview
- 16.2.7.2. Products
- 16.2.7.3. SWOT Analysis
- 16.2.7.4. Recent Developments
- 16.2.7.5. Financials (Based on Availability)
- 16.2.8 Provision Holding Inc
- 16.2.8.1. Overview
- 16.2.8.2. Products
- 16.2.8.3. SWOT Analysis
- 16.2.8.4. Recent Developments
- 16.2.8.5. Financials (Based on Availability)
- 16.2.1 Holoxica Limited
List of Figures
- Figure 1: Global Holographic TV Industry Revenue Breakdown (Million, %) by Region 2024 & 2032
- Figure 2: North America Holographic TV Industry Revenue (Million), by Country 2024 & 2032
- Figure 3: North America Holographic TV Industry Revenue Share (%), by Country 2024 & 2032
- Figure 4: Europe Holographic TV Industry Revenue (Million), by Country 2024 & 2032
- Figure 5: Europe Holographic TV Industry Revenue Share (%), by Country 2024 & 2032
- Figure 6: Asia Pacific Holographic TV Industry Revenue (Million), by Country 2024 & 2032
- Figure 7: Asia Pacific Holographic TV Industry Revenue Share (%), by Country 2024 & 2032
- Figure 8: Latin America Holographic TV Industry Revenue (Million), by Country 2024 & 2032
- Figure 9: Latin America Holographic TV Industry Revenue Share (%), by Country 2024 & 2032
- Figure 10: Middle East Holographic TV Industry Revenue (Million), by Country 2024 & 2032
- Figure 11: Middle East Holographic TV Industry Revenue Share (%), by Country 2024 & 2032
- Figure 12: North America Holographic TV Industry Revenue (Million), by Product 2024 & 2032
- Figure 13: North America Holographic TV Industry Revenue Share (%), by Product 2024 & 2032
- Figure 14: North America Holographic TV Industry Revenue (Million), by End User 2024 & 2032
- Figure 15: North America Holographic TV Industry Revenue Share (%), by End User 2024 & 2032
- Figure 16: North America Holographic TV Industry Revenue (Million), by Country 2024 & 2032
- Figure 17: North America Holographic TV Industry Revenue Share (%), by Country 2024 & 2032
- Figure 18: Europe Holographic TV Industry Revenue (Million), by Product 2024 & 2032
- Figure 19: Europe Holographic TV Industry Revenue Share (%), by Product 2024 & 2032
- Figure 20: Europe Holographic TV Industry Revenue (Million), by End User 2024 & 2032
- Figure 21: Europe Holographic TV Industry Revenue Share (%), by End User 2024 & 2032
- Figure 22: Europe Holographic TV Industry Revenue (Million), by Country 2024 & 2032
- Figure 23: Europe Holographic TV Industry Revenue Share (%), by Country 2024 & 2032
- Figure 24: Asia Pacific Holographic TV Industry Revenue (Million), by Product 2024 & 2032
- Figure 25: Asia Pacific Holographic TV Industry Revenue Share (%), by Product 2024 & 2032
- Figure 26: Asia Pacific Holographic TV Industry Revenue (Million), by End User 2024 & 2032
- Figure 27: Asia Pacific Holographic TV Industry Revenue Share (%), by End User 2024 & 2032
- Figure 28: Asia Pacific Holographic TV Industry Revenue (Million), by Country 2024 & 2032
- Figure 29: Asia Pacific Holographic TV Industry Revenue Share (%), by Country 2024 & 2032
- Figure 30: Latin America Holographic TV Industry Revenue (Million), by Product 2024 & 2032
- Figure 31: Latin America Holographic TV Industry Revenue Share (%), by Product 2024 & 2032
- Figure 32: Latin America Holographic TV Industry Revenue (Million), by End User 2024 & 2032
- Figure 33: Latin America Holographic TV Industry Revenue Share (%), by End User 2024 & 2032
- Figure 34: Latin America Holographic TV Industry Revenue (Million), by Country 2024 & 2032
- Figure 35: Latin America Holographic TV Industry Revenue Share (%), by Country 2024 & 2032
- Figure 36: Middle East Holographic TV Industry Revenue (Million), by Product 2024 & 2032
- Figure 37: Middle East Holographic TV Industry Revenue Share (%), by Product 2024 & 2032
- Figure 38: Middle East Holographic TV Industry Revenue (Million), by End User 2024 & 2032
- Figure 39: Middle East Holographic TV Industry Revenue Share (%), by End User 2024 & 2032
- Figure 40: Middle East Holographic TV Industry Revenue (Million), by Country 2024 & 2032
- Figure 41: Middle East Holographic TV Industry Revenue Share (%), by Country 2024 & 2032
List of Tables
- Table 1: Global Holographic TV Industry Revenue Million Forecast, by Region 2019 & 2032
- Table 2: Global Holographic TV Industry Revenue Million Forecast, by Product 2019 & 2032
- Table 3: Global Holographic TV Industry Revenue Million Forecast, by End User 2019 & 2032
- Table 4: Global Holographic TV Industry Revenue Million Forecast, by Region 2019 & 2032
- Table 5: Global Holographic TV Industry Revenue Million Forecast, by Country 2019 & 2032
- Table 6: Holographic TV Industry Revenue (Million) Forecast, by Application 2019 & 2032
- Table 7: Global Holographic TV Industry Revenue Million Forecast, by Country 2019 & 2032
- Table 8: Holographic TV Industry Revenue (Million) Forecast, by Application 2019 & 2032
- Table 9: Global Holographic TV Industry Revenue Million Forecast, by Country 2019 & 2032
- Table 10: Holographic TV Industry Revenue (Million) Forecast, by Application 2019 & 2032
- Table 11: Global Holographic TV Industry Revenue Million Forecast, by Country 2019 & 2032
- Table 12: Holographic TV Industry Revenue (Million) Forecast, by Application 2019 & 2032
- Table 13: Global Holographic TV Industry Revenue Million Forecast, by Country 2019 & 2032
- Table 14: Holographic TV Industry Revenue (Million) Forecast, by Application 2019 & 2032
- Table 15: Global Holographic TV Industry Revenue Million Forecast, by Product 2019 & 2032
- Table 16: Global Holographic TV Industry Revenue Million Forecast, by End User 2019 & 2032
- Table 17: Global Holographic TV Industry Revenue Million Forecast, by Country 2019 & 2032
- Table 18: Global Holographic TV Industry Revenue Million Forecast, by Product 2019 & 2032
- Table 19: Global Holographic TV Industry Revenue Million Forecast, by End User 2019 & 2032
- Table 20: Global Holographic TV Industry Revenue Million Forecast, by Country 2019 & 2032
- Table 21: Global Holographic TV Industry Revenue Million Forecast, by Product 2019 & 2032
- Table 22: Global Holographic TV Industry Revenue Million Forecast, by End User 2019 & 2032
- Table 23: Global Holographic TV Industry Revenue Million Forecast, by Country 2019 & 2032
- Table 24: Global Holographic TV Industry Revenue Million Forecast, by Product 2019 & 2032
- Table 25: Global Holographic TV Industry Revenue Million Forecast, by End User 2019 & 2032
- Table 26: Global Holographic TV Industry Revenue Million Forecast, by Country 2019 & 2032
- Table 27: Global Holographic TV Industry Revenue Million Forecast, by Product 2019 & 2032
- Table 28: Global Holographic TV Industry Revenue Million Forecast, by End User 2019 & 2032
- Table 29: Global Holographic TV Industry Revenue Million Forecast, by Country 2019 & 2032
Frequently Asked Questions
1. What is the projected Compound Annual Growth Rate (CAGR) of the Holographic TV Industry?
The projected CAGR is approximately 26.20%.
2. Which companies are prominent players in the Holographic TV Industry?
Key companies in the market include Holoxica Limited, EON Reality*List Not Exhaustive, RealView Imaging Ltd, Musion Das Hologram Ltd, SeeReal Technologies, Shenzhen SMX Display Technology Co Ltd, AV Concepts Inc, Provision Holding Inc.
3. What are the main segments of the Holographic TV Industry?
The market segments include Product, End User.
4. Can you provide details about the market size?
The market size is estimated to be USD XX Million as of 2022.
5. What are some drivers contributing to market growth?
; Advancements in Holographic Technology; IncreasE Usage in Medical Imaging.
6. What are the notable trends driving market growth?
Laser Technology Expected to Increase the Growth in Education Sector.
7. Are there any restraints impacting market growth?
; High Initial Invetsment and Product Cost.
8. Can you provide examples of recent developments in the market?
N/A
9. What pricing options are available for accessing the report?
Pricing options include single-user, multi-user, and enterprise licenses priced at USD 4750, USD 5250, and USD 8750 respectively.
10. Is the market size provided in terms of value or volume?
The market size is provided in terms of value, measured in Million.
11. Are there any specific market keywords associated with the report?
Yes, the market keyword associated with the report is "Holographic TV Industry," which aids in identifying and referencing the specific market segment covered.
12. How do I determine which pricing option suits my needs best?
The pricing options vary based on user requirements and access needs. Individual users may opt for single-user licenses, while businesses requiring broader access may choose multi-user or enterprise licenses for cost-effective access to the report.
13. Are there any additional resources or data provided in the Holographic TV Industry report?
While the report offers comprehensive insights, it's advisable to review the specific contents or supplementary materials provided to ascertain if additional resources or data are available.
14. How can I stay updated on further developments or reports in the Holographic TV Industry?
To stay informed about further developments, trends, and reports in the Holographic TV Industry, consider subscribing to industry newsletters, following relevant companies and organizations, or regularly checking reputable industry news sources and publications.
Methodology
Step 1 - Identification of Relevant Samples Size from Population Database


Step 2 - Approaches for Defining Global Market Size (Value, Volume* & Price*)

Note*: In applicable scenarios
Step 3 - Data Sources
Primary Research
- Web Analytics
- Survey Reports
- Research Institute
- Latest Research Reports
- Opinion Leaders
Secondary Research
- Annual Reports
- White Paper
- Latest Press Release
- Industry Association
- Paid Database
- Investor Presentations

Step 4 - Data Triangulation
Involves using different sources of information in order to increase the validity of a study
These sources are likely to be stakeholders in a program - participants, other researchers, program staff, other community members, and so on.
Then we put all data in single framework & apply various statistical tools to find out the dynamic on the market.
During the analysis stage, feedback from the stakeholder groups would be compared to determine areas of agreement as well as areas of divergence


