
Key Insights
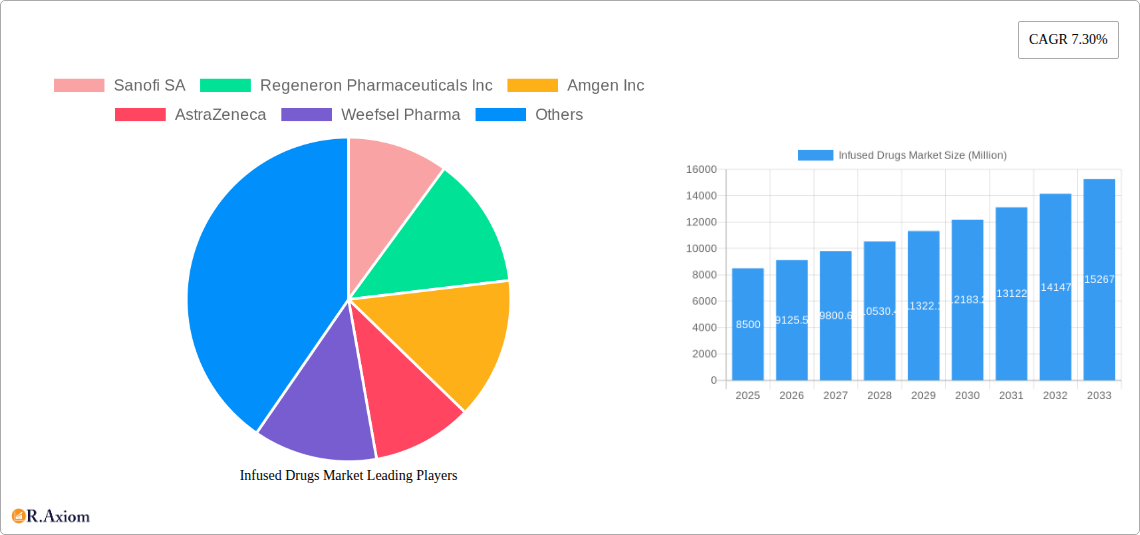
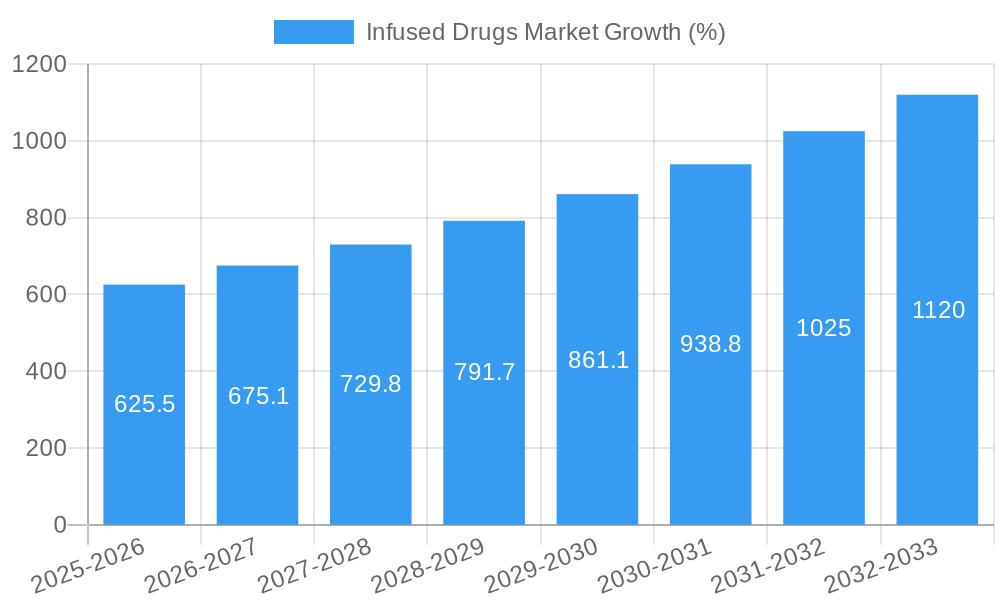
The infused drugs market, valued at $8.5 billion in 2025, is projected to experience robust growth, driven by a Compound Annual Growth Rate (CAGR) of 7.3% from 2025 to 2033. This expansion is fueled by several key factors. The increasing prevalence of chronic diseases like cancer, autoimmune disorders, and cardiovascular conditions necessitates the use of infused drugs for targeted and effective treatment. Advancements in drug delivery technologies, such as improved formulations and targeted therapies, enhance efficacy and patient compliance, further stimulating market growth. The rising geriatric population, globally, contributes significantly to the demand for infused drugs, as older individuals are more prone to these chronic diseases. Furthermore, the ongoing research and development efforts focused on innovative drug therapies and biologics are expected to introduce novel infused treatments, bolstering market expansion. Competition among major pharmaceutical players like Sanofi, Regeneron, Amgen, and Pfizer also drives innovation and availability.
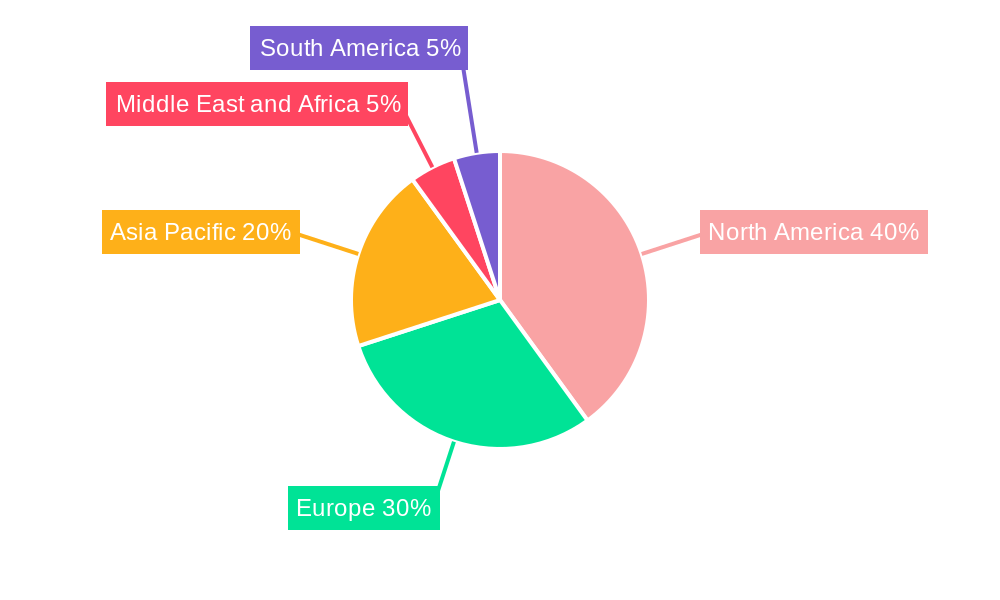
The market segmentation reveals significant opportunities across various drug types and therapeutic areas. Biologics, with their complex molecular structures and targeted mechanisms, are expected to show faster growth compared to small molecules. Within therapeutic areas, Oncology and Rheumatoid Arthritis are leading segments, driven by high prevalence and unmet medical needs. However, market growth isn't uniform geographically. North America and Europe currently hold a larger market share due to established healthcare infrastructure and high per capita healthcare expenditure. However, the Asia-Pacific region is projected to witness significant growth in the forecast period, propelled by rising healthcare spending and increasing awareness of advanced therapies. Despite the positive outlook, regulatory hurdles and high treatment costs could act as potential restraints. However, the overall market trajectory suggests a positive growth trajectory, with promising prospects for innovation and expansion in the coming years.
This comprehensive report provides an in-depth analysis of the Infused Drugs market, offering valuable insights for stakeholders across the pharmaceutical and healthcare industries. Covering the period from 2019 to 2033, with a focus on 2025, this report meticulously examines market dynamics, growth drivers, challenges, and future opportunities. The study encompasses key segments, leading players, and recent industry developments, offering a complete picture of this rapidly evolving market.
Infused Drugs Market Market Concentration & Innovation
The Infused Drugs market exhibits a moderately concentrated landscape, with a few major players holding significant market share. The market share held by the top 5 companies is estimated to be xx% in 2025. However, the market is also characterized by significant innovation, driven by advancements in drug delivery technologies, therapeutic areas, and the increasing prevalence of chronic diseases. Stringent regulatory frameworks, particularly concerning drug approvals and safety standards, play a crucial role in shaping market dynamics. Substitute therapies, such as oral medications or other targeted drug delivery methods, pose a degree of competitive pressure. End-user trends, notably the growing demand for personalized medicine and convenient drug administration, are continuously influencing market growth. Furthermore, M&A activities within the infused drug sector are notable, with several significant deals valued at over $xx Million in recent years. These transactions have primarily focused on expanding product portfolios, enhancing research and development capabilities, and gaining access to new markets.
- Market Concentration: Top 5 players hold xx% market share (2025).
- Innovation Drivers: Advanced drug delivery, novel therapeutics, personalized medicine.
- Regulatory Landscape: Stringent approval processes, safety standards.
- Product Substitutes: Oral medications, alternative drug delivery systems.
- M&A Activity: Several deals exceeding $xx Million in recent years, driven by portfolio expansion and market access.
Infused Drugs Market Industry Trends & Insights
The Infused Drugs market is experiencing robust growth, projected to achieve a CAGR of xx% during the forecast period (2025-2033). This growth is fueled by several key factors, including the rising prevalence of chronic diseases like cancer, autoimmune disorders, and cardiovascular ailments, which necessitate infused drug therapies. Technological advancements in drug delivery systems, particularly targeted drug delivery, are enhancing treatment efficacy and patient compliance. Furthermore, changing consumer preferences, including a growing demand for convenient administration methods, are driving market expansion. The competitive landscape is highly dynamic, with established pharmaceutical companies engaged in intense research and development, strategic partnerships, and acquisitions to maintain market leadership. Market penetration for infused biologics is expected to reach xx% by 2033, reflecting their increasing significance in treating complex diseases.
Dominant Markets & Segments in Infused Drugs Market
The Oncology therapeutic area currently dominates the Infused Drugs market, accounting for the largest market share (xx%) in 2025, followed by Cardiology and Rheumatic Diseases. The high prevalence of cancer and the efficacy of infused cancer therapies are key drivers. Within drug types, Biologics represent a larger market share compared to Small Molecules due to their ability to target specific disease pathways. Geographically, North America currently holds the largest market share, driven by strong research and development, high healthcare expenditure, and early adoption of new therapies. However, emerging markets in Asia-Pacific are exhibiting significant growth potential due to rising healthcare spending and increasing disease prevalence.
- Key Drivers for Oncology Dominance: High prevalence of cancer, efficacy of infused cancer therapies, extensive R&D.
- Key Drivers for Biologics Growth: Targeted therapies, improved efficacy compared to small molecules.
- Key Drivers for North America Market Leadership: High healthcare expenditure, robust R&D infrastructure, early adoption.
- Key Drivers for Asia-Pacific Growth: Rising healthcare spending, increasing disease prevalence.
Infused Drugs Market Product Developments
Recent years have witnessed significant advancements in infused drug technology, focusing on enhanced drug delivery systems, improved biocompatibility, and increased efficacy. Innovations include targeted drug delivery mechanisms, sustained-release formulations, and improved formulations reducing infusion time and side effects. These developments cater to unmet clinical needs, improving patient experience and treatment outcomes, contributing to the growth of the Infused Drugs market. Furthermore, the integration of nanotechnology and bioengineering promises further advancements in drug delivery and targeted therapy.
Report Scope & Segmentation Analysis
This report segments the Infused Drugs market based on Drug Type (Small Molecules, Biologics) and Therapeutic Area (Oncology, Gastrointestinal Diseases, Rheumatoid Arthritis, Immune Deficiencies, Cardiology, Neurology, Diabetes, Other Therapeutic Areas). Each segment is analyzed based on market size, growth projections, and competitive dynamics. The Oncology segment is projected to witness the highest growth rate, while Biologics are expected to maintain a significant market share across various therapeutic areas. Market sizes and growth projections are provided for each segment, illustrating their individual contributions to the overall market growth.
Key Drivers of Infused Drugs Market Growth
The Infused Drugs market is propelled by several factors. The rising prevalence of chronic diseases requiring intravenous therapies is a primary driver. Technological advancements, particularly in targeted drug delivery systems, are increasing efficacy and patient compliance. Favorable regulatory environments in several regions are facilitating drug approvals and market access. Growing healthcare expenditure globally is further fueling market expansion.
Challenges in the Infused Drugs Market Sector
The Infused Drugs market faces several challenges. Stringent regulatory approvals and associated costs can hinder product launches. Supply chain complexities and potential disruptions can affect market stability. Intense competition among pharmaceutical companies for market share necessitates continuous innovation and investment. These factors can affect pricing and market accessibility, ultimately influencing the overall market growth.
Emerging Opportunities in Infused Drugs Market
The market presents significant opportunities, including the development of personalized medicine, innovative drug delivery technologies (e.g., bioconjugates and nanocarriers), and the expansion into emerging markets. Further research into less-invasive administration methods could significantly impact market growth. The growing demand for convenient and efficient therapies will drive innovation.
Leading Players in the Infused Drugs Market Market
- Sanofi SA
- Regeneron Pharmaceuticals Inc
- Amgen Inc
- AstraZeneca
- Weefsel Pharma
- Parenteral Drugs (India) Limited
- Teva Pharmaceutical Industries Ltd
- Eisai Co Ltd
- Bristol-Myers Squibb Company
- Pfizer Inc
Key Developments in Infused Drugs Market Industry
- September 2023: Eisai Co. Ltd and Biogen Inc. reported the approval of LEQEMBI intravenous infusion for Alzheimer's Disease in Japan.
- August 2023: Approval of Roche’s Tecentriq SC using Halozyme’s Enhaze drug delivery technology in the UK.
Strategic Outlook for Infused Drugs Market Market
The Infused Drugs market holds significant future potential, driven by continuous technological advancements, rising disease prevalence, and expanding access to healthcare in emerging economies. Strategic partnerships, innovative product development, and a focus on patient-centric solutions will be crucial for companies to succeed in this competitive landscape. The market is poised for substantial growth, presenting lucrative opportunities for players who can effectively address emerging challenges and capitalize on future trends.
Infused Drugs Market Segmentation
-
1. Drug Type
- 1.1. Small Molecules
- 1.2. Biologics
-
2. Therapeutic Area
- 2.1. Oncology
- 2.2. Gastrointestinal Diseases
- 2.3. Rheumatoid Arthritis
- 2.4. Immune Deficiencies
- 2.5. Cardiology
- 2.6. Neurology
- 2.7. Diabetes
- 2.8. Other Therapeutic Areas
Infused Drugs Market Segmentation By Geography
-
1. North America
- 1.1. United States
- 1.2. Canada
- 1.3. Mexico
-
2. Europe
- 2.1. Germany
- 2.2. United Kingdom
- 2.3. France
- 2.4. Italy
- 2.5. Spain
- 2.6. Rest of Europe
-
3. Asia Pacific
- 3.1. China
- 3.2. Japan
- 3.3. India
- 3.4. Australia
- 3.5. South Korea
- 3.6. Rest of Asia Pacific
-
4. Middle East and Africa
- 4.1. GCC
- 4.2. South Africa
- 4.3. Rest of Middle East and Africa
-
5. South America
- 5.1. Brazil
- 5.2. Argentina
- 5.3. Rest of South America
Infused Drugs Market REPORT HIGHLIGHTS
| Aspects | Details |
|---|---|
| Study Period | 2019-2033 |
| Base Year | 2024 |
| Estimated Year | 2025 |
| Forecast Period | 2025-2033 |
| Historical Period | 2019-2024 |
| Growth Rate | CAGR of 7.30% from 2019-2033 |
| Segmentation |
|
Table of Contents
- 1. Introduction
- 1.1. Research Scope
- 1.2. Market Segmentation
- 1.3. Research Methodology
- 1.4. Definitions and Assumptions
- 2. Executive Summary
- 2.1. Introduction
- 3. Market Dynamics
- 3.1. Introduction
- 3.2. Market Drivers
- 3.2.1. Increase in the Prevalence of Chronic Diseases; Increasing Geriatric Population
- 3.3. Market Restrains
- 3.3.1. Side Effects Associated with the Medications
- 3.4. Market Trends
- 3.4.1. Oncology is Expected to Have Significant Market Share During the Forecast Period
- 4. Market Factor Analysis
- 4.1. Porters Five Forces
- 4.2. Supply/Value Chain
- 4.3. PESTEL analysis
- 4.4. Market Entropy
- 4.5. Patent/Trademark Analysis
- 5. Global Infused Drugs Market Analysis, Insights and Forecast, 2019-2031
- 5.1. Market Analysis, Insights and Forecast - by Drug Type
- 5.1.1. Small Molecules
- 5.1.2. Biologics
- 5.2. Market Analysis, Insights and Forecast - by Therapeutic Area
- 5.2.1. Oncology
- 5.2.2. Gastrointestinal Diseases
- 5.2.3. Rheumatoid Arthritis
- 5.2.4. Immune Deficiencies
- 5.2.5. Cardiology
- 5.2.6. Neurology
- 5.2.7. Diabetes
- 5.2.8. Other Therapeutic Areas
- 5.3. Market Analysis, Insights and Forecast - by Region
- 5.3.1. North America
- 5.3.2. Europe
- 5.3.3. Asia Pacific
- 5.3.4. Middle East and Africa
- 5.3.5. South America
- 5.1. Market Analysis, Insights and Forecast - by Drug Type
- 6. North America Infused Drugs Market Analysis, Insights and Forecast, 2019-2031
- 6.1. Market Analysis, Insights and Forecast - by Drug Type
- 6.1.1. Small Molecules
- 6.1.2. Biologics
- 6.2. Market Analysis, Insights and Forecast - by Therapeutic Area
- 6.2.1. Oncology
- 6.2.2. Gastrointestinal Diseases
- 6.2.3. Rheumatoid Arthritis
- 6.2.4. Immune Deficiencies
- 6.2.5. Cardiology
- 6.2.6. Neurology
- 6.2.7. Diabetes
- 6.2.8. Other Therapeutic Areas
- 6.1. Market Analysis, Insights and Forecast - by Drug Type
- 7. Europe Infused Drugs Market Analysis, Insights and Forecast, 2019-2031
- 7.1. Market Analysis, Insights and Forecast - by Drug Type
- 7.1.1. Small Molecules
- 7.1.2. Biologics
- 7.2. Market Analysis, Insights and Forecast - by Therapeutic Area
- 7.2.1. Oncology
- 7.2.2. Gastrointestinal Diseases
- 7.2.3. Rheumatoid Arthritis
- 7.2.4. Immune Deficiencies
- 7.2.5. Cardiology
- 7.2.6. Neurology
- 7.2.7. Diabetes
- 7.2.8. Other Therapeutic Areas
- 7.1. Market Analysis, Insights and Forecast - by Drug Type
- 8. Asia Pacific Infused Drugs Market Analysis, Insights and Forecast, 2019-2031
- 8.1. Market Analysis, Insights and Forecast - by Drug Type
- 8.1.1. Small Molecules
- 8.1.2. Biologics
- 8.2. Market Analysis, Insights and Forecast - by Therapeutic Area
- 8.2.1. Oncology
- 8.2.2. Gastrointestinal Diseases
- 8.2.3. Rheumatoid Arthritis
- 8.2.4. Immune Deficiencies
- 8.2.5. Cardiology
- 8.2.6. Neurology
- 8.2.7. Diabetes
- 8.2.8. Other Therapeutic Areas
- 8.1. Market Analysis, Insights and Forecast - by Drug Type
- 9. Middle East and Africa Infused Drugs Market Analysis, Insights and Forecast, 2019-2031
- 9.1. Market Analysis, Insights and Forecast - by Drug Type
- 9.1.1. Small Molecules
- 9.1.2. Biologics
- 9.2. Market Analysis, Insights and Forecast - by Therapeutic Area
- 9.2.1. Oncology
- 9.2.2. Gastrointestinal Diseases
- 9.2.3. Rheumatoid Arthritis
- 9.2.4. Immune Deficiencies
- 9.2.5. Cardiology
- 9.2.6. Neurology
- 9.2.7. Diabetes
- 9.2.8. Other Therapeutic Areas
- 9.1. Market Analysis, Insights and Forecast - by Drug Type
- 10. South America Infused Drugs Market Analysis, Insights and Forecast, 2019-2031
- 10.1. Market Analysis, Insights and Forecast - by Drug Type
- 10.1.1. Small Molecules
- 10.1.2. Biologics
- 10.2. Market Analysis, Insights and Forecast - by Therapeutic Area
- 10.2.1. Oncology
- 10.2.2. Gastrointestinal Diseases
- 10.2.3. Rheumatoid Arthritis
- 10.2.4. Immune Deficiencies
- 10.2.5. Cardiology
- 10.2.6. Neurology
- 10.2.7. Diabetes
- 10.2.8. Other Therapeutic Areas
- 10.1. Market Analysis, Insights and Forecast - by Drug Type
- 11. North America Infused Drugs Market Analysis, Insights and Forecast, 2019-2031
- 11.1. Market Analysis, Insights and Forecast - By Country/Sub-region
- 11.1.1. undefined
- 12. Europe Infused Drugs Market Analysis, Insights and Forecast, 2019-2031
- 12.1. Market Analysis, Insights and Forecast - By Country/Sub-region
- 12.1.1. undefined
- 13. Asia Pacific Infused Drugs Market Analysis, Insights and Forecast, 2019-2031
- 13.1. Market Analysis, Insights and Forecast - By Country/Sub-region
- 13.1.1. undefined
- 14. Middle East and Africa Infused Drugs Market Analysis, Insights and Forecast, 2019-2031
- 14.1. Market Analysis, Insights and Forecast - By Country/Sub-region
- 14.1.1. undefined
- 15. South America Infused Drugs Market Analysis, Insights and Forecast, 2019-2031
- 15.1. Market Analysis, Insights and Forecast - By Country/Sub-region
- 15.1.1. undefined
- 16. Competitive Analysis
- 16.1. Global Market Share Analysis 2024
- 16.2. Company Profiles
- 16.2.1 Sanofi SA
- 16.2.1.1. Overview
- 16.2.1.2. Products
- 16.2.1.3. SWOT Analysis
- 16.2.1.4. Recent Developments
- 16.2.1.5. Financials (Based on Availability)
- 16.2.2 Regeneron Pharmaceuticals Inc
- 16.2.2.1. Overview
- 16.2.2.2. Products
- 16.2.2.3. SWOT Analysis
- 16.2.2.4. Recent Developments
- 16.2.2.5. Financials (Based on Availability)
- 16.2.3 Amgen Inc
- 16.2.3.1. Overview
- 16.2.3.2. Products
- 16.2.3.3. SWOT Analysis
- 16.2.3.4. Recent Developments
- 16.2.3.5. Financials (Based on Availability)
- 16.2.4 AstraZeneca
- 16.2.4.1. Overview
- 16.2.4.2. Products
- 16.2.4.3. SWOT Analysis
- 16.2.4.4. Recent Developments
- 16.2.4.5. Financials (Based on Availability)
- 16.2.5 Weefsel Pharma
- 16.2.5.1. Overview
- 16.2.5.2. Products
- 16.2.5.3. SWOT Analysis
- 16.2.5.4. Recent Developments
- 16.2.5.5. Financials (Based on Availability)
- 16.2.6 Parenteral Drugs (India) Limited
- 16.2.6.1. Overview
- 16.2.6.2. Products
- 16.2.6.3. SWOT Analysis
- 16.2.6.4. Recent Developments
- 16.2.6.5. Financials (Based on Availability)
- 16.2.7 Teva Pharmaceutical Industries Ltd
- 16.2.7.1. Overview
- 16.2.7.2. Products
- 16.2.7.3. SWOT Analysis
- 16.2.7.4. Recent Developments
- 16.2.7.5. Financials (Based on Availability)
- 16.2.8 Eisai Co Ltd
- 16.2.8.1. Overview
- 16.2.8.2. Products
- 16.2.8.3. SWOT Analysis
- 16.2.8.4. Recent Developments
- 16.2.8.5. Financials (Based on Availability)
- 16.2.9 Bristol-Myers Squibb Company
- 16.2.9.1. Overview
- 16.2.9.2. Products
- 16.2.9.3. SWOT Analysis
- 16.2.9.4. Recent Developments
- 16.2.9.5. Financials (Based on Availability)
- 16.2.10 Pfizer Inc
- 16.2.10.1. Overview
- 16.2.10.2. Products
- 16.2.10.3. SWOT Analysis
- 16.2.10.4. Recent Developments
- 16.2.10.5. Financials (Based on Availability)
- 16.2.1 Sanofi SA
List of Figures
- Figure 1: Global Infused Drugs Market Revenue Breakdown (Million, %) by Region 2024 & 2032
- Figure 2: Global Infused Drugs Market Volume Breakdown (K Unit, %) by Region 2024 & 2032
- Figure 3: North America Infused Drugs Market Revenue (Million), by Country 2024 & 2032
- Figure 4: North America Infused Drugs Market Volume (K Unit), by Country 2024 & 2032
- Figure 5: North America Infused Drugs Market Revenue Share (%), by Country 2024 & 2032
- Figure 6: North America Infused Drugs Market Volume Share (%), by Country 2024 & 2032
- Figure 7: Europe Infused Drugs Market Revenue (Million), by Country 2024 & 2032
- Figure 8: Europe Infused Drugs Market Volume (K Unit), by Country 2024 & 2032
- Figure 9: Europe Infused Drugs Market Revenue Share (%), by Country 2024 & 2032
- Figure 10: Europe Infused Drugs Market Volume Share (%), by Country 2024 & 2032
- Figure 11: Asia Pacific Infused Drugs Market Revenue (Million), by Country 2024 & 2032
- Figure 12: Asia Pacific Infused Drugs Market Volume (K Unit), by Country 2024 & 2032
- Figure 13: Asia Pacific Infused Drugs Market Revenue Share (%), by Country 2024 & 2032
- Figure 14: Asia Pacific Infused Drugs Market Volume Share (%), by Country 2024 & 2032
- Figure 15: Middle East and Africa Infused Drugs Market Revenue (Million), by Country 2024 & 2032
- Figure 16: Middle East and Africa Infused Drugs Market Volume (K Unit), by Country 2024 & 2032
- Figure 17: Middle East and Africa Infused Drugs Market Revenue Share (%), by Country 2024 & 2032
- Figure 18: Middle East and Africa Infused Drugs Market Volume Share (%), by Country 2024 & 2032
- Figure 19: South America Infused Drugs Market Revenue (Million), by Country 2024 & 2032
- Figure 20: South America Infused Drugs Market Volume (K Unit), by Country 2024 & 2032
- Figure 21: South America Infused Drugs Market Revenue Share (%), by Country 2024 & 2032
- Figure 22: South America Infused Drugs Market Volume Share (%), by Country 2024 & 2032
- Figure 23: North America Infused Drugs Market Revenue (Million), by Drug Type 2024 & 2032
- Figure 24: North America Infused Drugs Market Volume (K Unit), by Drug Type 2024 & 2032
- Figure 25: North America Infused Drugs Market Revenue Share (%), by Drug Type 2024 & 2032
- Figure 26: North America Infused Drugs Market Volume Share (%), by Drug Type 2024 & 2032
- Figure 27: North America Infused Drugs Market Revenue (Million), by Therapeutic Area 2024 & 2032
- Figure 28: North America Infused Drugs Market Volume (K Unit), by Therapeutic Area 2024 & 2032
- Figure 29: North America Infused Drugs Market Revenue Share (%), by Therapeutic Area 2024 & 2032
- Figure 30: North America Infused Drugs Market Volume Share (%), by Therapeutic Area 2024 & 2032
- Figure 31: North America Infused Drugs Market Revenue (Million), by Country 2024 & 2032
- Figure 32: North America Infused Drugs Market Volume (K Unit), by Country 2024 & 2032
- Figure 33: North America Infused Drugs Market Revenue Share (%), by Country 2024 & 2032
- Figure 34: North America Infused Drugs Market Volume Share (%), by Country 2024 & 2032
- Figure 35: Europe Infused Drugs Market Revenue (Million), by Drug Type 2024 & 2032
- Figure 36: Europe Infused Drugs Market Volume (K Unit), by Drug Type 2024 & 2032
- Figure 37: Europe Infused Drugs Market Revenue Share (%), by Drug Type 2024 & 2032
- Figure 38: Europe Infused Drugs Market Volume Share (%), by Drug Type 2024 & 2032
- Figure 39: Europe Infused Drugs Market Revenue (Million), by Therapeutic Area 2024 & 2032
- Figure 40: Europe Infused Drugs Market Volume (K Unit), by Therapeutic Area 2024 & 2032
- Figure 41: Europe Infused Drugs Market Revenue Share (%), by Therapeutic Area 2024 & 2032
- Figure 42: Europe Infused Drugs Market Volume Share (%), by Therapeutic Area 2024 & 2032
- Figure 43: Europe Infused Drugs Market Revenue (Million), by Country 2024 & 2032
- Figure 44: Europe Infused Drugs Market Volume (K Unit), by Country 2024 & 2032
- Figure 45: Europe Infused Drugs Market Revenue Share (%), by Country 2024 & 2032
- Figure 46: Europe Infused Drugs Market Volume Share (%), by Country 2024 & 2032
- Figure 47: Asia Pacific Infused Drugs Market Revenue (Million), by Drug Type 2024 & 2032
- Figure 48: Asia Pacific Infused Drugs Market Volume (K Unit), by Drug Type 2024 & 2032
- Figure 49: Asia Pacific Infused Drugs Market Revenue Share (%), by Drug Type 2024 & 2032
- Figure 50: Asia Pacific Infused Drugs Market Volume Share (%), by Drug Type 2024 & 2032
- Figure 51: Asia Pacific Infused Drugs Market Revenue (Million), by Therapeutic Area 2024 & 2032
- Figure 52: Asia Pacific Infused Drugs Market Volume (K Unit), by Therapeutic Area 2024 & 2032
- Figure 53: Asia Pacific Infused Drugs Market Revenue Share (%), by Therapeutic Area 2024 & 2032
- Figure 54: Asia Pacific Infused Drugs Market Volume Share (%), by Therapeutic Area 2024 & 2032
- Figure 55: Asia Pacific Infused Drugs Market Revenue (Million), by Country 2024 & 2032
- Figure 56: Asia Pacific Infused Drugs Market Volume (K Unit), by Country 2024 & 2032
- Figure 57: Asia Pacific Infused Drugs Market Revenue Share (%), by Country 2024 & 2032
- Figure 58: Asia Pacific Infused Drugs Market Volume Share (%), by Country 2024 & 2032
- Figure 59: Middle East and Africa Infused Drugs Market Revenue (Million), by Drug Type 2024 & 2032
- Figure 60: Middle East and Africa Infused Drugs Market Volume (K Unit), by Drug Type 2024 & 2032
- Figure 61: Middle East and Africa Infused Drugs Market Revenue Share (%), by Drug Type 2024 & 2032
- Figure 62: Middle East and Africa Infused Drugs Market Volume Share (%), by Drug Type 2024 & 2032
- Figure 63: Middle East and Africa Infused Drugs Market Revenue (Million), by Therapeutic Area 2024 & 2032
- Figure 64: Middle East and Africa Infused Drugs Market Volume (K Unit), by Therapeutic Area 2024 & 2032
- Figure 65: Middle East and Africa Infused Drugs Market Revenue Share (%), by Therapeutic Area 2024 & 2032
- Figure 66: Middle East and Africa Infused Drugs Market Volume Share (%), by Therapeutic Area 2024 & 2032
- Figure 67: Middle East and Africa Infused Drugs Market Revenue (Million), by Country 2024 & 2032
- Figure 68: Middle East and Africa Infused Drugs Market Volume (K Unit), by Country 2024 & 2032
- Figure 69: Middle East and Africa Infused Drugs Market Revenue Share (%), by Country 2024 & 2032
- Figure 70: Middle East and Africa Infused Drugs Market Volume Share (%), by Country 2024 & 2032
- Figure 71: South America Infused Drugs Market Revenue (Million), by Drug Type 2024 & 2032
- Figure 72: South America Infused Drugs Market Volume (K Unit), by Drug Type 2024 & 2032
- Figure 73: South America Infused Drugs Market Revenue Share (%), by Drug Type 2024 & 2032
- Figure 74: South America Infused Drugs Market Volume Share (%), by Drug Type 2024 & 2032
- Figure 75: South America Infused Drugs Market Revenue (Million), by Therapeutic Area 2024 & 2032
- Figure 76: South America Infused Drugs Market Volume (K Unit), by Therapeutic Area 2024 & 2032
- Figure 77: South America Infused Drugs Market Revenue Share (%), by Therapeutic Area 2024 & 2032
- Figure 78: South America Infused Drugs Market Volume Share (%), by Therapeutic Area 2024 & 2032
- Figure 79: South America Infused Drugs Market Revenue (Million), by Country 2024 & 2032
- Figure 80: South America Infused Drugs Market Volume (K Unit), by Country 2024 & 2032
- Figure 81: South America Infused Drugs Market Revenue Share (%), by Country 2024 & 2032
- Figure 82: South America Infused Drugs Market Volume Share (%), by Country 2024 & 2032
List of Tables
- Table 1: Global Infused Drugs Market Revenue Million Forecast, by Region 2019 & 2032
- Table 2: Global Infused Drugs Market Volume K Unit Forecast, by Region 2019 & 2032
- Table 3: Global Infused Drugs Market Revenue Million Forecast, by Drug Type 2019 & 2032
- Table 4: Global Infused Drugs Market Volume K Unit Forecast, by Drug Type 2019 & 2032
- Table 5: Global Infused Drugs Market Revenue Million Forecast, by Therapeutic Area 2019 & 2032
- Table 6: Global Infused Drugs Market Volume K Unit Forecast, by Therapeutic Area 2019 & 2032
- Table 7: Global Infused Drugs Market Revenue Million Forecast, by Region 2019 & 2032
- Table 8: Global Infused Drugs Market Volume K Unit Forecast, by Region 2019 & 2032
- Table 9: Global Infused Drugs Market Revenue Million Forecast, by Country 2019 & 2032
- Table 10: Global Infused Drugs Market Volume K Unit Forecast, by Country 2019 & 2032
- Table 11: Global Infused Drugs Market Revenue Million Forecast, by Country 2019 & 2032
- Table 12: Global Infused Drugs Market Volume K Unit Forecast, by Country 2019 & 2032
- Table 13: Global Infused Drugs Market Revenue Million Forecast, by Country 2019 & 2032
- Table 14: Global Infused Drugs Market Volume K Unit Forecast, by Country 2019 & 2032
- Table 15: Global Infused Drugs Market Revenue Million Forecast, by Country 2019 & 2032
- Table 16: Global Infused Drugs Market Volume K Unit Forecast, by Country 2019 & 2032
- Table 17: Global Infused Drugs Market Revenue Million Forecast, by Country 2019 & 2032
- Table 18: Global Infused Drugs Market Volume K Unit Forecast, by Country 2019 & 2032
- Table 19: Global Infused Drugs Market Revenue Million Forecast, by Drug Type 2019 & 2032
- Table 20: Global Infused Drugs Market Volume K Unit Forecast, by Drug Type 2019 & 2032
- Table 21: Global Infused Drugs Market Revenue Million Forecast, by Therapeutic Area 2019 & 2032
- Table 22: Global Infused Drugs Market Volume K Unit Forecast, by Therapeutic Area 2019 & 2032
- Table 23: Global Infused Drugs Market Revenue Million Forecast, by Country 2019 & 2032
- Table 24: Global Infused Drugs Market Volume K Unit Forecast, by Country 2019 & 2032
- Table 25: United States Infused Drugs Market Revenue (Million) Forecast, by Application 2019 & 2032
- Table 26: United States Infused Drugs Market Volume (K Unit) Forecast, by Application 2019 & 2032
- Table 27: Canada Infused Drugs Market Revenue (Million) Forecast, by Application 2019 & 2032
- Table 28: Canada Infused Drugs Market Volume (K Unit) Forecast, by Application 2019 & 2032
- Table 29: Mexico Infused Drugs Market Revenue (Million) Forecast, by Application 2019 & 2032
- Table 30: Mexico Infused Drugs Market Volume (K Unit) Forecast, by Application 2019 & 2032
- Table 31: Global Infused Drugs Market Revenue Million Forecast, by Drug Type 2019 & 2032
- Table 32: Global Infused Drugs Market Volume K Unit Forecast, by Drug Type 2019 & 2032
- Table 33: Global Infused Drugs Market Revenue Million Forecast, by Therapeutic Area 2019 & 2032
- Table 34: Global Infused Drugs Market Volume K Unit Forecast, by Therapeutic Area 2019 & 2032
- Table 35: Global Infused Drugs Market Revenue Million Forecast, by Country 2019 & 2032
- Table 36: Global Infused Drugs Market Volume K Unit Forecast, by Country 2019 & 2032
- Table 37: Germany Infused Drugs Market Revenue (Million) Forecast, by Application 2019 & 2032
- Table 38: Germany Infused Drugs Market Volume (K Unit) Forecast, by Application 2019 & 2032
- Table 39: United Kingdom Infused Drugs Market Revenue (Million) Forecast, by Application 2019 & 2032
- Table 40: United Kingdom Infused Drugs Market Volume (K Unit) Forecast, by Application 2019 & 2032
- Table 41: France Infused Drugs Market Revenue (Million) Forecast, by Application 2019 & 2032
- Table 42: France Infused Drugs Market Volume (K Unit) Forecast, by Application 2019 & 2032
- Table 43: Italy Infused Drugs Market Revenue (Million) Forecast, by Application 2019 & 2032
- Table 44: Italy Infused Drugs Market Volume (K Unit) Forecast, by Application 2019 & 2032
- Table 45: Spain Infused Drugs Market Revenue (Million) Forecast, by Application 2019 & 2032
- Table 46: Spain Infused Drugs Market Volume (K Unit) Forecast, by Application 2019 & 2032
- Table 47: Rest of Europe Infused Drugs Market Revenue (Million) Forecast, by Application 2019 & 2032
- Table 48: Rest of Europe Infused Drugs Market Volume (K Unit) Forecast, by Application 2019 & 2032
- Table 49: Global Infused Drugs Market Revenue Million Forecast, by Drug Type 2019 & 2032
- Table 50: Global Infused Drugs Market Volume K Unit Forecast, by Drug Type 2019 & 2032
- Table 51: Global Infused Drugs Market Revenue Million Forecast, by Therapeutic Area 2019 & 2032
- Table 52: Global Infused Drugs Market Volume K Unit Forecast, by Therapeutic Area 2019 & 2032
- Table 53: Global Infused Drugs Market Revenue Million Forecast, by Country 2019 & 2032
- Table 54: Global Infused Drugs Market Volume K Unit Forecast, by Country 2019 & 2032
- Table 55: China Infused Drugs Market Revenue (Million) Forecast, by Application 2019 & 2032
- Table 56: China Infused Drugs Market Volume (K Unit) Forecast, by Application 2019 & 2032
- Table 57: Japan Infused Drugs Market Revenue (Million) Forecast, by Application 2019 & 2032
- Table 58: Japan Infused Drugs Market Volume (K Unit) Forecast, by Application 2019 & 2032
- Table 59: India Infused Drugs Market Revenue (Million) Forecast, by Application 2019 & 2032
- Table 60: India Infused Drugs Market Volume (K Unit) Forecast, by Application 2019 & 2032
- Table 61: Australia Infused Drugs Market Revenue (Million) Forecast, by Application 2019 & 2032
- Table 62: Australia Infused Drugs Market Volume (K Unit) Forecast, by Application 2019 & 2032
- Table 63: South Korea Infused Drugs Market Revenue (Million) Forecast, by Application 2019 & 2032
- Table 64: South Korea Infused Drugs Market Volume (K Unit) Forecast, by Application 2019 & 2032
- Table 65: Rest of Asia Pacific Infused Drugs Market Revenue (Million) Forecast, by Application 2019 & 2032
- Table 66: Rest of Asia Pacific Infused Drugs Market Volume (K Unit) Forecast, by Application 2019 & 2032
- Table 67: Global Infused Drugs Market Revenue Million Forecast, by Drug Type 2019 & 2032
- Table 68: Global Infused Drugs Market Volume K Unit Forecast, by Drug Type 2019 & 2032
- Table 69: Global Infused Drugs Market Revenue Million Forecast, by Therapeutic Area 2019 & 2032
- Table 70: Global Infused Drugs Market Volume K Unit Forecast, by Therapeutic Area 2019 & 2032
- Table 71: Global Infused Drugs Market Revenue Million Forecast, by Country 2019 & 2032
- Table 72: Global Infused Drugs Market Volume K Unit Forecast, by Country 2019 & 2032
- Table 73: GCC Infused Drugs Market Revenue (Million) Forecast, by Application 2019 & 2032
- Table 74: GCC Infused Drugs Market Volume (K Unit) Forecast, by Application 2019 & 2032
- Table 75: South Africa Infused Drugs Market Revenue (Million) Forecast, by Application 2019 & 2032
- Table 76: South Africa Infused Drugs Market Volume (K Unit) Forecast, by Application 2019 & 2032
- Table 77: Rest of Middle East and Africa Infused Drugs Market Revenue (Million) Forecast, by Application 2019 & 2032
- Table 78: Rest of Middle East and Africa Infused Drugs Market Volume (K Unit) Forecast, by Application 2019 & 2032
- Table 79: Global Infused Drugs Market Revenue Million Forecast, by Drug Type 2019 & 2032
- Table 80: Global Infused Drugs Market Volume K Unit Forecast, by Drug Type 2019 & 2032
- Table 81: Global Infused Drugs Market Revenue Million Forecast, by Therapeutic Area 2019 & 2032
- Table 82: Global Infused Drugs Market Volume K Unit Forecast, by Therapeutic Area 2019 & 2032
- Table 83: Global Infused Drugs Market Revenue Million Forecast, by Country 2019 & 2032
- Table 84: Global Infused Drugs Market Volume K Unit Forecast, by Country 2019 & 2032
- Table 85: Brazil Infused Drugs Market Revenue (Million) Forecast, by Application 2019 & 2032
- Table 86: Brazil Infused Drugs Market Volume (K Unit) Forecast, by Application 2019 & 2032
- Table 87: Argentina Infused Drugs Market Revenue (Million) Forecast, by Application 2019 & 2032
- Table 88: Argentina Infused Drugs Market Volume (K Unit) Forecast, by Application 2019 & 2032
- Table 89: Rest of South America Infused Drugs Market Revenue (Million) Forecast, by Application 2019 & 2032
- Table 90: Rest of South America Infused Drugs Market Volume (K Unit) Forecast, by Application 2019 & 2032
Frequently Asked Questions
1. What is the projected Compound Annual Growth Rate (CAGR) of the Infused Drugs Market?
The projected CAGR is approximately 7.30%.
2. Which companies are prominent players in the Infused Drugs Market?
Key companies in the market include Sanofi SA, Regeneron Pharmaceuticals Inc, Amgen Inc, AstraZeneca, Weefsel Pharma, Parenteral Drugs (India) Limited, Teva Pharmaceutical Industries Ltd, Eisai Co Ltd, Bristol-Myers Squibb Company, Pfizer Inc.
3. What are the main segments of the Infused Drugs Market?
The market segments include Drug Type, Therapeutic Area.
4. Can you provide details about the market size?
The market size is estimated to be USD 8.5 Million as of 2022.
5. What are some drivers contributing to market growth?
Increase in the Prevalence of Chronic Diseases; Increasing Geriatric Population.
6. What are the notable trends driving market growth?
Oncology is Expected to Have Significant Market Share During the Forecast Period.
7. Are there any restraints impacting market growth?
Side Effects Associated with the Medications.
8. Can you provide examples of recent developments in the market?
September 2023: Eisai Co. Ltd and Biogen Inc. reported the approval of LEQEMBI intravenous infusion, a humanized anti-soluble aggregated amyloid beta monoclonal antibody in Japan. This approval signifies its recognition as a treatment to decelerate the progression of mild cognitive impairment and dementia resulting from Alzheimer’s Disease.
9. What pricing options are available for accessing the report?
Pricing options include single-user, multi-user, and enterprise licenses priced at USD 4750, USD 5250, and USD 8750 respectively.
10. Is the market size provided in terms of value or volume?
The market size is provided in terms of value, measured in Million and volume, measured in K Unit.
11. Are there any specific market keywords associated with the report?
Yes, the market keyword associated with the report is "Infused Drugs Market," which aids in identifying and referencing the specific market segment covered.
12. How do I determine which pricing option suits my needs best?
The pricing options vary based on user requirements and access needs. Individual users may opt for single-user licenses, while businesses requiring broader access may choose multi-user or enterprise licenses for cost-effective access to the report.
13. Are there any additional resources or data provided in the Infused Drugs Market report?
While the report offers comprehensive insights, it's advisable to review the specific contents or supplementary materials provided to ascertain if additional resources or data are available.
14. How can I stay updated on further developments or reports in the Infused Drugs Market?
To stay informed about further developments, trends, and reports in the Infused Drugs Market, consider subscribing to industry newsletters, following relevant companies and organizations, or regularly checking reputable industry news sources and publications.
Methodology
Step 1 - Identification of Relevant Samples Size from Population Database


Step 2 - Approaches for Defining Global Market Size (Value, Volume* & Price*)

Note*: In applicable scenarios
Step 3 - Data Sources
Primary Research
- Web Analytics
- Survey Reports
- Research Institute
- Latest Research Reports
- Opinion Leaders
Secondary Research
- Annual Reports
- White Paper
- Latest Press Release
- Industry Association
- Paid Database
- Investor Presentations

Step 4 - Data Triangulation
Involves using different sources of information in order to increase the validity of a study
These sources are likely to be stakeholders in a program - participants, other researchers, program staff, other community members, and so on.
Then we put all data in single framework & apply various statistical tools to find out the dynamic on the market.
During the analysis stage, feedback from the stakeholder groups would be compared to determine areas of agreement as well as areas of divergence


