
Key Insights
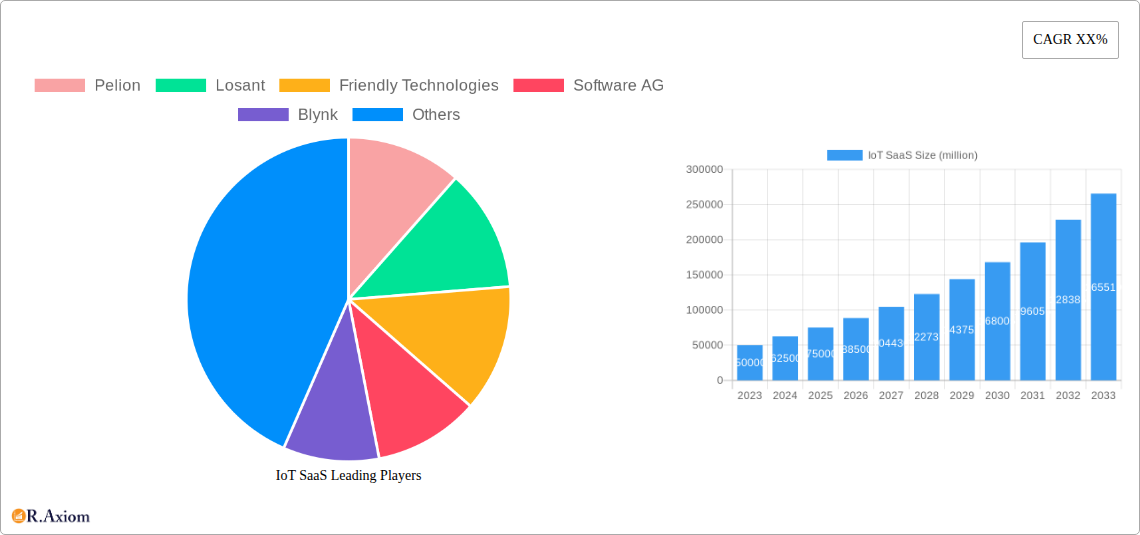
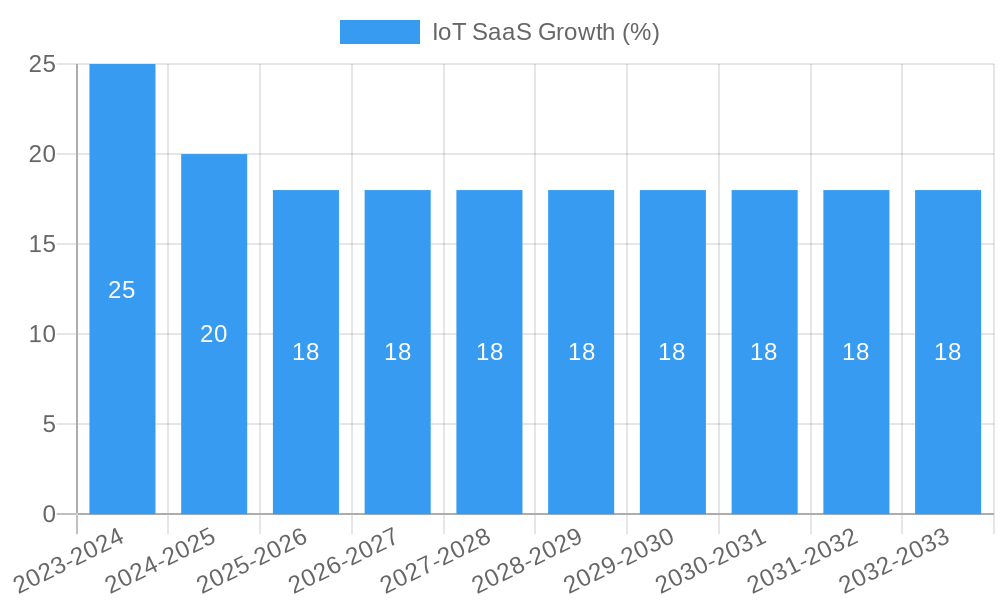
The Internet of Things (IoT) Software as a Service (SaaS) market is poised for substantial expansion, projected to reach approximately $75,000 million by 2025 and grow at a Compound Annual Growth Rate (CAGR) of around 18% through 2033. This robust growth is fueled by the escalating adoption of connected devices across various sectors, the increasing demand for real-time data analytics, and the undeniable need for efficient device management and control. The shift towards cloud-based solutions, offering scalability, flexibility, and cost-effectiveness, is a primary driver, enabling businesses to leverage IoT data without significant upfront infrastructure investments. The market is segmented by application into Industrial, Commercial, and Others, with the Industrial segment likely leading due to the widespread integration of IoT in manufacturing, logistics, and energy. The Types segment, encompassing Private Cloud Architecture and Public Cloud Architecture, highlights the diverse deployment models catering to varied security and compliance needs.
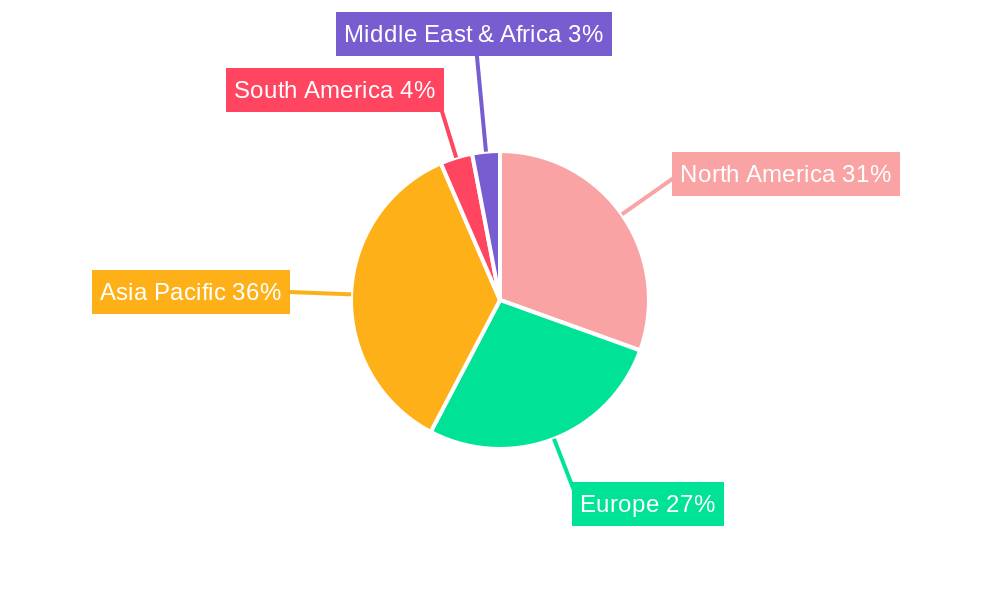
The competitive landscape is dynamic, featuring key players such as Pelion, Losant, Software AG, and Tencent, among many others, who are actively innovating to offer comprehensive IoT SaaS platforms. These platforms provide essential functionalities like device connectivity, data ingestion, analytics, and application enablement. The market's trajectory is also influenced by emerging trends such as the rise of edge computing within IoT ecosystems, the integration of AI and machine learning for advanced insights, and the growing focus on IoT security solutions. While the market presents immense opportunities, challenges such as data security concerns, interoperability issues between diverse devices and platforms, and the need for skilled talent can act as restraints. Geographically, the Asia Pacific region, driven by the rapid digital transformation in countries like China and India, is expected to witness the highest growth, closely followed by North America and Europe, which are mature markets with established IoT ecosystems.
IoT SaaS Market Concentration & Innovation
The IoT SaaS market is characterized by a dynamic blend of established enterprise players and agile disruptors, indicating moderate to high concentration. Innovation is a primary driver, fueled by advancements in AI, machine learning, edge computing, and 5G, enabling sophisticated data analytics and predictive capabilities. Regulatory frameworks, particularly concerning data privacy (e.g., GDPR, CCPA) and cybersecurity standards, are shaping product development and market entry strategies, impacting market dynamics significantly. Product substitutes, while present in specialized niches, are largely insufficient to replace the integrated, scalable solutions offered by leading IoT SaaS providers. End-user trends point towards an increasing demand for actionable insights, real-time monitoring, and seamless integration across diverse industrial and commercial applications, driving adoption rates. Mergers and acquisitions (M&A) activity is a key indicator of market maturation. Notable M&A deals are projected to exceed several hundred million dollars annually, as larger technology firms seek to acquire specialized IoT SaaS capabilities or expand their market reach. Companies like Pelion, Losant, Friendly Technologies, Software AG, Blynk, Particle, ThingBoard, Golioth, Tantiv4, HyperNym, Blackhawk, IoTree, tencent, Mesozoic, and Tuya are actively participating in this landscape, either through organic growth or strategic acquisitions. The market share distribution shows a competitive environment, with key players holding substantial but not dominant positions, suggesting continued potential for new entrants and innovative solutions to capture market share.
IoT SaaS Industry Trends & Insights
The Internet of Things Software-as-a-Service (IoT SaaS) industry is poised for substantial expansion, driven by an escalating demand for connected devices and the data they generate. The Compound Annual Growth Rate (CAGR) is projected to be in the double digits, with estimates around 25% to 30% for the forecast period. Market penetration is rapidly increasing across various sectors, moving beyond early adopters to mainstream enterprises seeking to optimize operations, enhance customer experiences, and unlock new revenue streams. Technological disruptions are at the forefront, with the proliferation of AI and machine learning algorithms transforming raw IoT data into intelligent, actionable insights. Edge computing is gaining traction, enabling faster processing and decision-making closer to the data source, which is crucial for real-time applications. The integration of 5G technology is further accelerating data transmission speeds and reducing latency, paving the way for more complex and demanding IoT deployments. Consumer preferences are increasingly leaning towards personalized services and predictive maintenance, pushing businesses to leverage IoT SaaS for enhanced customer engagement and proactive support. Competitive dynamics are intensifying, with a blend of large cloud providers, specialized IoT platform vendors, and industrial automation companies vying for market dominance. Strategic partnerships and ecosystem development are becoming crucial for success, as no single entity can cater to the entire spectrum of IoT needs. The shift towards subscription-based models ensures recurring revenue streams, making IoT SaaS an attractive proposition for investors and a sustainable solution for businesses. As the cost of IoT devices continues to decline and connectivity becomes more ubiquitous, the adoption of IoT SaaS solutions is expected to accelerate, permeating nearly every facet of modern business and daily life, contributing to an estimated market size exceeding several hundred billion dollars by the end of the forecast period.
Dominant Markets & Segments in IoT SaaS
The Industrial segment is a primary driver of IoT SaaS adoption, showcasing robust growth due to its critical need for real-time monitoring, predictive maintenance, and process optimization. Within this segment, Manufacturing, Energy, and Utilities are leading the charge, leveraging IoT SaaS to improve efficiency, reduce downtime, and enhance safety. For instance, smart factories are implementing IoT solutions to track production lines, monitor machinery health, and manage energy consumption, leading to significant cost savings. The Economic policies favoring industrial digitization and infrastructure investments in smart grids and automated manufacturing facilities further bolster this dominance.
- Industrial Applications: Predictive maintenance in manufacturing, energy management in utilities, asset tracking in logistics, and environmental monitoring in agriculture.
- Key Drivers: Need for operational efficiency, cost reduction, enhanced safety, regulatory compliance, and proactive issue resolution.
- Market Size Projection: Expected to constitute over 50% of the total IoT SaaS market by 2033.
The Commercial segment, encompassing areas like Smart Buildings, Retail, and Healthcare, also presents a significant and rapidly growing market. Smart buildings are increasingly adopting IoT SaaS for energy efficiency, security, and occupant comfort, while retail businesses leverage it for inventory management, customer behavior analysis, and personalized marketing. Healthcare providers are utilizing IoT for remote patient monitoring, asset tracking, and improving operational workflows. Technological advancements in sensor technology and data analytics are making these solutions more accessible and impactful.
- Commercial Applications: Smart building management (HVAC, lighting, security), retail analytics (foot traffic, inventory), healthcare patient monitoring, and smart city initiatives.
- Key Drivers: Desire for improved user experience, operational cost savings, enhanced security, and data-driven decision-making.
- Market Size Projection: Expected to grow at a CAGR of approximately 28% within the forecast period.
Public Cloud Architecture dominates the IoT SaaS landscape due to its scalability, flexibility, and cost-effectiveness. This architecture allows businesses to deploy and manage IoT solutions without the significant upfront investment in hardware and infrastructure. The ease of integration with other cloud-based services and the availability of robust security features further contribute to its widespread adoption.
- Public Cloud Architecture: Offers scalability, pay-as-you-go pricing, global accessibility, and a broad ecosystem of integrated services.
- Key Drivers: Cost-efficiency, rapid deployment, scalability, and access to advanced analytics and AI capabilities.
Private Cloud Architecture, while less prevalent than public cloud, is crucial for enterprises with stringent data security and compliance requirements, particularly in sectors like government, defense, and highly regulated industries. These solutions offer greater control over data and infrastructure.
- Private Cloud Architecture: Provides enhanced security, greater control over data, and customization for specific compliance needs.
- Key Drivers: Data sovereignty, strict regulatory compliance, and highly sensitive data handling requirements.
The "Others" segment, encompassing areas like smart homes, connected vehicles, and wearables, is also witnessing rapid growth, driven by increasing consumer demand for convenience, safety, and personalized experiences. The accessibility and affordability of consumer-grade IoT devices are fueling this expansion, creating new avenues for IoT SaaS providers.
- Others Applications: Smart home automation, connected car services, wearable technology, and personal health monitoring.
- Key Drivers: Consumer convenience, enhanced lifestyle, safety features, and growing adoption of connected devices.
IoT SaaS Product Developments
Recent IoT SaaS product developments are centered on enhanced data analytics, AI-driven insights, and seamless integration across diverse platforms. Solutions are increasingly offering predictive maintenance capabilities, real-time anomaly detection, and personalized user experiences. Technological trends like edge computing are being integrated to enable faster decision-making at the device level. Competitive advantages are derived from robust security features, ease of deployment, and comprehensive ecosystem support, making solutions from companies like Pelion and Losant highly sought after for their advanced functionalities and market-specific applicability.
Report Scope & Segmentation Analysis
This report provides a comprehensive analysis of the IoT SaaS market, segmented by Application and Type. The Industrial segment is projected to reach a market size of several hundred million dollars by 2033, driven by critical needs for efficiency and safety. The Commercial segment is expected to grow at a rapid pace, fueled by smart building and retail analytics. The Others segment, encompassing consumer IoT, also shows significant expansion potential.
In terms of architecture, Public Cloud Architecture is anticipated to maintain its dominance due to scalability and cost-effectiveness, projected to hold a market share of over 70% by 2033. Private Cloud Architecture, while smaller, will remain crucial for specific high-security use cases, with steady growth expected.
Key Drivers of IoT SaaS Growth
Several factors are driving the exponential growth of the IoT SaaS market. Technologically, the widespread adoption of 5G networks is enabling faster data transfer and supporting more complex IoT deployments. The increasing affordability and sophistication of IoT devices, coupled with advancements in AI and machine learning for data analytics, are making IoT solutions more valuable and accessible. Economically, the demand for operational efficiency, cost reduction, and new revenue streams across industries is a significant catalyst. Regulatory frameworks, while sometimes posing challenges, also drive adoption as compliance mandates for data security and privacy become more stringent.
Challenges in the IoT SaaS Sector
Despite its promising growth, the IoT SaaS sector faces several challenges. Data security and privacy concerns remain paramount, as the vast amount of data generated by IoT devices presents potential vulnerabilities. Interoperability issues between different IoT platforms and devices can hinder seamless integration and deployment, impacting market adoption. The complexity of managing large-scale IoT deployments, coupled with a shortage of skilled professionals in IoT development and data science, poses significant operational hurdles. Furthermore, the initial investment cost for comprehensive IoT solutions, although decreasing, can still be a barrier for smaller businesses.
Emerging Opportunities in IoT SaaS
Emerging opportunities in the IoT SaaS sector are abundant. The burgeoning market for edge computing solutions, which enable local processing of IoT data, presents a significant growth avenue. The increasing demand for sustainable and green technology solutions is creating opportunities for IoT SaaS in energy management and environmental monitoring. Furthermore, the expansion of IoT into new verticals like precision agriculture and smart logistics, coupled with the growing adoption of AI for predictive analytics and automation, opens up vast potential for innovative IoT SaaS applications. The development of specialized IoT platforms tailored for niche industrial and commercial applications will also drive market expansion.
Leading Players in the IoT SaaS Market
- Pelion
- Losant
- Friendly Technologies
- Software AG
- Blynk
- Particle
- ThingBoard
- Golioth
- Tantiv4
- HyperNym
- Blackhawk
- IoTree
- Tencent
- Mesozoic
- Tuya
Key Developments in IoT SaaS Industry
- 2023: Increased focus on AI-driven analytics for predictive maintenance across manufacturing and energy sectors.
- 2023: Significant advancements in edge computing capabilities for real-time data processing in industrial IoT.
- 2024: Growing M&A activity as larger tech companies acquire specialized IoT SaaS providers to expand their portfolios.
- 2024: Enhanced cybersecurity features and compliance certifications becoming standard offerings for leading IoT SaaS platforms.
- 2025: Integration of generative AI for enhanced data visualization and insights generation within IoT platforms.
- 2025: Expansion of IoT SaaS solutions into emerging markets in Southeast Asia and Africa.
- 2026: Development of industry-specific IoT SaaS solutions catering to hyper-verticals like smart healthcare and connected retail.
- 2027: Maturation of 5G deployment leading to more sophisticated and latency-sensitive IoT applications.
- 2028-2030: Consolidation within the market, with dominant players acquiring smaller innovators to strengthen their competitive edge.
- 2030 onwards: Increased adoption of decentralized IoT architectures and blockchain for enhanced security and data integrity.
Strategic Outlook for IoT SaaS Market
The strategic outlook for the IoT SaaS market is exceptionally positive, driven by continuous technological innovation and escalating demand across all major industry segments. The integration of advanced AI and machine learning will unlock deeper insights and more intelligent automation, driving significant value creation. The ongoing expansion of 5G infrastructure will further enable the deployment of complex, real-time IoT solutions, opening up new market opportunities. Companies that focus on developing robust, secure, and scalable platforms, while fostering strong ecosystem partnerships, are well-positioned for sustained growth. The increasing adoption of IoT SaaS for sustainability initiatives and smart city development also presents considerable long-term growth potential.
IoT SaaS Segmentation
-
1. Application
- 1.1. Industrial
- 1.2. Commercial
- 1.3. Others
-
2. Types
- 2.1. Private Cloud Architecture
- 2.2. Public Cloud Architecture
IoT SaaS Segmentation By Geography
-
1. North America
- 1.1. United States
- 1.2. Canada
- 1.3. Mexico
-
2. South America
- 2.1. Brazil
- 2.2. Argentina
- 2.3. Rest of South America
-
3. Europe
- 3.1. United Kingdom
- 3.2. Germany
- 3.3. France
- 3.4. Italy
- 3.5. Spain
- 3.6. Russia
- 3.7. Benelux
- 3.8. Nordics
- 3.9. Rest of Europe
-
4. Middle East & Africa
- 4.1. Turkey
- 4.2. Israel
- 4.3. GCC
- 4.4. North Africa
- 4.5. South Africa
- 4.6. Rest of Middle East & Africa
-
5. Asia Pacific
- 5.1. China
- 5.2. India
- 5.3. Japan
- 5.4. South Korea
- 5.5. ASEAN
- 5.6. Oceania
- 5.7. Rest of Asia Pacific
IoT SaaS REPORT HIGHLIGHTS
| Aspects | Details |
|---|---|
| Study Period | 2019-2033 |
| Base Year | 2024 |
| Estimated Year | 2025 |
| Forecast Period | 2025-2033 |
| Historical Period | 2019-2024 |
| Growth Rate | CAGR of XX% from 2019-2033 |
| Segmentation |
|
Table of Contents
- 1. Introduction
- 1.1. Research Scope
- 1.2. Market Segmentation
- 1.3. Research Methodology
- 1.4. Definitions and Assumptions
- 2. Executive Summary
- 2.1. Introduction
- 3. Market Dynamics
- 3.1. Introduction
- 3.2. Market Drivers
- 3.3. Market Restrains
- 3.4. Market Trends
- 4. Market Factor Analysis
- 4.1. Porters Five Forces
- 4.2. Supply/Value Chain
- 4.3. PESTEL analysis
- 4.4. Market Entropy
- 4.5. Patent/Trademark Analysis
- 5. Global IoT SaaS Analysis, Insights and Forecast, 2019-2031
- 5.1. Market Analysis, Insights and Forecast - by Application
- 5.1.1. Industrial
- 5.1.2. Commercial
- 5.1.3. Others
- 5.2. Market Analysis, Insights and Forecast - by Types
- 5.2.1. Private Cloud Architecture
- 5.2.2. Public Cloud Architecture
- 5.3. Market Analysis, Insights and Forecast - by Region
- 5.3.1. North America
- 5.3.2. South America
- 5.3.3. Europe
- 5.3.4. Middle East & Africa
- 5.3.5. Asia Pacific
- 5.1. Market Analysis, Insights and Forecast - by Application
- 6. North America IoT SaaS Analysis, Insights and Forecast, 2019-2031
- 6.1. Market Analysis, Insights and Forecast - by Application
- 6.1.1. Industrial
- 6.1.2. Commercial
- 6.1.3. Others
- 6.2. Market Analysis, Insights and Forecast - by Types
- 6.2.1. Private Cloud Architecture
- 6.2.2. Public Cloud Architecture
- 6.1. Market Analysis, Insights and Forecast - by Application
- 7. South America IoT SaaS Analysis, Insights and Forecast, 2019-2031
- 7.1. Market Analysis, Insights and Forecast - by Application
- 7.1.1. Industrial
- 7.1.2. Commercial
- 7.1.3. Others
- 7.2. Market Analysis, Insights and Forecast - by Types
- 7.2.1. Private Cloud Architecture
- 7.2.2. Public Cloud Architecture
- 7.1. Market Analysis, Insights and Forecast - by Application
- 8. Europe IoT SaaS Analysis, Insights and Forecast, 2019-2031
- 8.1. Market Analysis, Insights and Forecast - by Application
- 8.1.1. Industrial
- 8.1.2. Commercial
- 8.1.3. Others
- 8.2. Market Analysis, Insights and Forecast - by Types
- 8.2.1. Private Cloud Architecture
- 8.2.2. Public Cloud Architecture
- 8.1. Market Analysis, Insights and Forecast - by Application
- 9. Middle East & Africa IoT SaaS Analysis, Insights and Forecast, 2019-2031
- 9.1. Market Analysis, Insights and Forecast - by Application
- 9.1.1. Industrial
- 9.1.2. Commercial
- 9.1.3. Others
- 9.2. Market Analysis, Insights and Forecast - by Types
- 9.2.1. Private Cloud Architecture
- 9.2.2. Public Cloud Architecture
- 9.1. Market Analysis, Insights and Forecast - by Application
- 10. Asia Pacific IoT SaaS Analysis, Insights and Forecast, 2019-2031
- 10.1. Market Analysis, Insights and Forecast - by Application
- 10.1.1. Industrial
- 10.1.2. Commercial
- 10.1.3. Others
- 10.2. Market Analysis, Insights and Forecast - by Types
- 10.2.1. Private Cloud Architecture
- 10.2.2. Public Cloud Architecture
- 10.1. Market Analysis, Insights and Forecast - by Application
- 11. Competitive Analysis
- 11.1. Global Market Share Analysis 2024
- 11.2. Company Profiles
- 11.2.1 Pelion
- 11.2.1.1. Overview
- 11.2.1.2. Products
- 11.2.1.3. SWOT Analysis
- 11.2.1.4. Recent Developments
- 11.2.1.5. Financials (Based on Availability)
- 11.2.2 Losant
- 11.2.2.1. Overview
- 11.2.2.2. Products
- 11.2.2.3. SWOT Analysis
- 11.2.2.4. Recent Developments
- 11.2.2.5. Financials (Based on Availability)
- 11.2.3 Friendly Technologies
- 11.2.3.1. Overview
- 11.2.3.2. Products
- 11.2.3.3. SWOT Analysis
- 11.2.3.4. Recent Developments
- 11.2.3.5. Financials (Based on Availability)
- 11.2.4 Software AG
- 11.2.4.1. Overview
- 11.2.4.2. Products
- 11.2.4.3. SWOT Analysis
- 11.2.4.4. Recent Developments
- 11.2.4.5. Financials (Based on Availability)
- 11.2.5 Blynk
- 11.2.5.1. Overview
- 11.2.5.2. Products
- 11.2.5.3. SWOT Analysis
- 11.2.5.4. Recent Developments
- 11.2.5.5. Financials (Based on Availability)
- 11.2.6 Particle
- 11.2.6.1. Overview
- 11.2.6.2. Products
- 11.2.6.3. SWOT Analysis
- 11.2.6.4. Recent Developments
- 11.2.6.5. Financials (Based on Availability)
- 11.2.7 ThingBoard
- 11.2.7.1. Overview
- 11.2.7.2. Products
- 11.2.7.3. SWOT Analysis
- 11.2.7.4. Recent Developments
- 11.2.7.5. Financials (Based on Availability)
- 11.2.8 Golioth
- 11.2.8.1. Overview
- 11.2.8.2. Products
- 11.2.8.3. SWOT Analysis
- 11.2.8.4. Recent Developments
- 11.2.8.5. Financials (Based on Availability)
- 11.2.9 Tantiv4
- 11.2.9.1. Overview
- 11.2.9.2. Products
- 11.2.9.3. SWOT Analysis
- 11.2.9.4. Recent Developments
- 11.2.9.5. Financials (Based on Availability)
- 11.2.10 HyperNym
- 11.2.10.1. Overview
- 11.2.10.2. Products
- 11.2.10.3. SWOT Analysis
- 11.2.10.4. Recent Developments
- 11.2.10.5. Financials (Based on Availability)
- 11.2.11 Blackhawk
- 11.2.11.1. Overview
- 11.2.11.2. Products
- 11.2.11.3. SWOT Analysis
- 11.2.11.4. Recent Developments
- 11.2.11.5. Financials (Based on Availability)
- 11.2.12 IoTree
- 11.2.12.1. Overview
- 11.2.12.2. Products
- 11.2.12.3. SWOT Analysis
- 11.2.12.4. Recent Developments
- 11.2.12.5. Financials (Based on Availability)
- 11.2.13 tencent
- 11.2.13.1. Overview
- 11.2.13.2. Products
- 11.2.13.3. SWOT Analysis
- 11.2.13.4. Recent Developments
- 11.2.13.5. Financials (Based on Availability)
- 11.2.14 Mesozoic
- 11.2.14.1. Overview
- 11.2.14.2. Products
- 11.2.14.3. SWOT Analysis
- 11.2.14.4. Recent Developments
- 11.2.14.5. Financials (Based on Availability)
- 11.2.15 tuya
- 11.2.15.1. Overview
- 11.2.15.2. Products
- 11.2.15.3. SWOT Analysis
- 11.2.15.4. Recent Developments
- 11.2.15.5. Financials (Based on Availability)
- 11.2.1 Pelion
List of Figures
- Figure 1: Global IoT SaaS Revenue Breakdown (million, %) by Region 2024 & 2032
- Figure 2: North America IoT SaaS Revenue (million), by Application 2024 & 2032
- Figure 3: North America IoT SaaS Revenue Share (%), by Application 2024 & 2032
- Figure 4: North America IoT SaaS Revenue (million), by Types 2024 & 2032
- Figure 5: North America IoT SaaS Revenue Share (%), by Types 2024 & 2032
- Figure 6: North America IoT SaaS Revenue (million), by Country 2024 & 2032
- Figure 7: North America IoT SaaS Revenue Share (%), by Country 2024 & 2032
- Figure 8: South America IoT SaaS Revenue (million), by Application 2024 & 2032
- Figure 9: South America IoT SaaS Revenue Share (%), by Application 2024 & 2032
- Figure 10: South America IoT SaaS Revenue (million), by Types 2024 & 2032
- Figure 11: South America IoT SaaS Revenue Share (%), by Types 2024 & 2032
- Figure 12: South America IoT SaaS Revenue (million), by Country 2024 & 2032
- Figure 13: South America IoT SaaS Revenue Share (%), by Country 2024 & 2032
- Figure 14: Europe IoT SaaS Revenue (million), by Application 2024 & 2032
- Figure 15: Europe IoT SaaS Revenue Share (%), by Application 2024 & 2032
- Figure 16: Europe IoT SaaS Revenue (million), by Types 2024 & 2032
- Figure 17: Europe IoT SaaS Revenue Share (%), by Types 2024 & 2032
- Figure 18: Europe IoT SaaS Revenue (million), by Country 2024 & 2032
- Figure 19: Europe IoT SaaS Revenue Share (%), by Country 2024 & 2032
- Figure 20: Middle East & Africa IoT SaaS Revenue (million), by Application 2024 & 2032
- Figure 21: Middle East & Africa IoT SaaS Revenue Share (%), by Application 2024 & 2032
- Figure 22: Middle East & Africa IoT SaaS Revenue (million), by Types 2024 & 2032
- Figure 23: Middle East & Africa IoT SaaS Revenue Share (%), by Types 2024 & 2032
- Figure 24: Middle East & Africa IoT SaaS Revenue (million), by Country 2024 & 2032
- Figure 25: Middle East & Africa IoT SaaS Revenue Share (%), by Country 2024 & 2032
- Figure 26: Asia Pacific IoT SaaS Revenue (million), by Application 2024 & 2032
- Figure 27: Asia Pacific IoT SaaS Revenue Share (%), by Application 2024 & 2032
- Figure 28: Asia Pacific IoT SaaS Revenue (million), by Types 2024 & 2032
- Figure 29: Asia Pacific IoT SaaS Revenue Share (%), by Types 2024 & 2032
- Figure 30: Asia Pacific IoT SaaS Revenue (million), by Country 2024 & 2032
- Figure 31: Asia Pacific IoT SaaS Revenue Share (%), by Country 2024 & 2032
List of Tables
- Table 1: Global IoT SaaS Revenue million Forecast, by Region 2019 & 2032
- Table 2: Global IoT SaaS Revenue million Forecast, by Application 2019 & 2032
- Table 3: Global IoT SaaS Revenue million Forecast, by Types 2019 & 2032
- Table 4: Global IoT SaaS Revenue million Forecast, by Region 2019 & 2032
- Table 5: Global IoT SaaS Revenue million Forecast, by Application 2019 & 2032
- Table 6: Global IoT SaaS Revenue million Forecast, by Types 2019 & 2032
- Table 7: Global IoT SaaS Revenue million Forecast, by Country 2019 & 2032
- Table 8: United States IoT SaaS Revenue (million) Forecast, by Application 2019 & 2032
- Table 9: Canada IoT SaaS Revenue (million) Forecast, by Application 2019 & 2032
- Table 10: Mexico IoT SaaS Revenue (million) Forecast, by Application 2019 & 2032
- Table 11: Global IoT SaaS Revenue million Forecast, by Application 2019 & 2032
- Table 12: Global IoT SaaS Revenue million Forecast, by Types 2019 & 2032
- Table 13: Global IoT SaaS Revenue million Forecast, by Country 2019 & 2032
- Table 14: Brazil IoT SaaS Revenue (million) Forecast, by Application 2019 & 2032
- Table 15: Argentina IoT SaaS Revenue (million) Forecast, by Application 2019 & 2032
- Table 16: Rest of South America IoT SaaS Revenue (million) Forecast, by Application 2019 & 2032
- Table 17: Global IoT SaaS Revenue million Forecast, by Application 2019 & 2032
- Table 18: Global IoT SaaS Revenue million Forecast, by Types 2019 & 2032
- Table 19: Global IoT SaaS Revenue million Forecast, by Country 2019 & 2032
- Table 20: United Kingdom IoT SaaS Revenue (million) Forecast, by Application 2019 & 2032
- Table 21: Germany IoT SaaS Revenue (million) Forecast, by Application 2019 & 2032
- Table 22: France IoT SaaS Revenue (million) Forecast, by Application 2019 & 2032
- Table 23: Italy IoT SaaS Revenue (million) Forecast, by Application 2019 & 2032
- Table 24: Spain IoT SaaS Revenue (million) Forecast, by Application 2019 & 2032
- Table 25: Russia IoT SaaS Revenue (million) Forecast, by Application 2019 & 2032
- Table 26: Benelux IoT SaaS Revenue (million) Forecast, by Application 2019 & 2032
- Table 27: Nordics IoT SaaS Revenue (million) Forecast, by Application 2019 & 2032
- Table 28: Rest of Europe IoT SaaS Revenue (million) Forecast, by Application 2019 & 2032
- Table 29: Global IoT SaaS Revenue million Forecast, by Application 2019 & 2032
- Table 30: Global IoT SaaS Revenue million Forecast, by Types 2019 & 2032
- Table 31: Global IoT SaaS Revenue million Forecast, by Country 2019 & 2032
- Table 32: Turkey IoT SaaS Revenue (million) Forecast, by Application 2019 & 2032
- Table 33: Israel IoT SaaS Revenue (million) Forecast, by Application 2019 & 2032
- Table 34: GCC IoT SaaS Revenue (million) Forecast, by Application 2019 & 2032
- Table 35: North Africa IoT SaaS Revenue (million) Forecast, by Application 2019 & 2032
- Table 36: South Africa IoT SaaS Revenue (million) Forecast, by Application 2019 & 2032
- Table 37: Rest of Middle East & Africa IoT SaaS Revenue (million) Forecast, by Application 2019 & 2032
- Table 38: Global IoT SaaS Revenue million Forecast, by Application 2019 & 2032
- Table 39: Global IoT SaaS Revenue million Forecast, by Types 2019 & 2032
- Table 40: Global IoT SaaS Revenue million Forecast, by Country 2019 & 2032
- Table 41: China IoT SaaS Revenue (million) Forecast, by Application 2019 & 2032
- Table 42: India IoT SaaS Revenue (million) Forecast, by Application 2019 & 2032
- Table 43: Japan IoT SaaS Revenue (million) Forecast, by Application 2019 & 2032
- Table 44: South Korea IoT SaaS Revenue (million) Forecast, by Application 2019 & 2032
- Table 45: ASEAN IoT SaaS Revenue (million) Forecast, by Application 2019 & 2032
- Table 46: Oceania IoT SaaS Revenue (million) Forecast, by Application 2019 & 2032
- Table 47: Rest of Asia Pacific IoT SaaS Revenue (million) Forecast, by Application 2019 & 2032
Frequently Asked Questions
1. What is the projected Compound Annual Growth Rate (CAGR) of the IoT SaaS?
The projected CAGR is approximately XX%.
2. Which companies are prominent players in the IoT SaaS?
Key companies in the market include Pelion, Losant, Friendly Technologies, Software AG, Blynk, Particle, ThingBoard, Golioth, Tantiv4, HyperNym, Blackhawk, IoTree, tencent, Mesozoic, tuya.
3. What are the main segments of the IoT SaaS?
The market segments include Application, Types.
4. Can you provide details about the market size?
The market size is estimated to be USD XXX million as of 2022.
5. What are some drivers contributing to market growth?
N/A
6. What are the notable trends driving market growth?
N/A
7. Are there any restraints impacting market growth?
N/A
8. Can you provide examples of recent developments in the market?
N/A
9. What pricing options are available for accessing the report?
Pricing options include single-user, multi-user, and enterprise licenses priced at USD 3350.00, USD 5025.00, and USD 6700.00 respectively.
10. Is the market size provided in terms of value or volume?
The market size is provided in terms of value, measured in million.
11. Are there any specific market keywords associated with the report?
Yes, the market keyword associated with the report is "IoT SaaS," which aids in identifying and referencing the specific market segment covered.
12. How do I determine which pricing option suits my needs best?
The pricing options vary based on user requirements and access needs. Individual users may opt for single-user licenses, while businesses requiring broader access may choose multi-user or enterprise licenses for cost-effective access to the report.
13. Are there any additional resources or data provided in the IoT SaaS report?
While the report offers comprehensive insights, it's advisable to review the specific contents or supplementary materials provided to ascertain if additional resources or data are available.
14. How can I stay updated on further developments or reports in the IoT SaaS?
To stay informed about further developments, trends, and reports in the IoT SaaS, consider subscribing to industry newsletters, following relevant companies and organizations, or regularly checking reputable industry news sources and publications.
Methodology
Step 1 - Identification of Relevant Samples Size from Population Database


Step 2 - Approaches for Defining Global Market Size (Value, Volume* & Price*)

Note*: In applicable scenarios
Step 3 - Data Sources
Primary Research
- Web Analytics
- Survey Reports
- Research Institute
- Latest Research Reports
- Opinion Leaders
Secondary Research
- Annual Reports
- White Paper
- Latest Press Release
- Industry Association
- Paid Database
- Investor Presentations

Step 4 - Data Triangulation
Involves using different sources of information in order to increase the validity of a study
These sources are likely to be stakeholders in a program - participants, other researchers, program staff, other community members, and so on.
Then we put all data in single framework & apply various statistical tools to find out the dynamic on the market.
During the analysis stage, feedback from the stakeholder groups would be compared to determine areas of agreement as well as areas of divergence


