
Key Insights
The Middle East and Africa Ready-to-Drink (RTD) Beverages market is experiencing robust growth, driven by factors such as rising disposable incomes, increasing urbanization, and a burgeoning young population with a preference for convenient and on-the-go consumption options. The market's expansion is further fueled by the introduction of innovative product variations, including functional beverages enriched with vitamins, minerals, and probiotics, catering to health-conscious consumers. While tea and coffee remain dominant segments, the energy drinks and fruit and vegetable juice categories are exhibiting particularly strong growth, reflecting changing lifestyles and a growing demand for healthier alternatives. Supermarkets and hypermarkets constitute the largest distribution channel, but the online segment is experiencing rapid expansion, driven by e-commerce penetration and convenient home delivery services. The market is also witnessing increased competition, with both international and regional players vying for market share. Challenges include fluctuating raw material prices, stringent regulations on food and beverage labeling, and the need for effective distribution infrastructure in some parts of the region. However, the long-term outlook for the MEA RTD beverage market remains positive, with sustained growth projected over the forecast period.
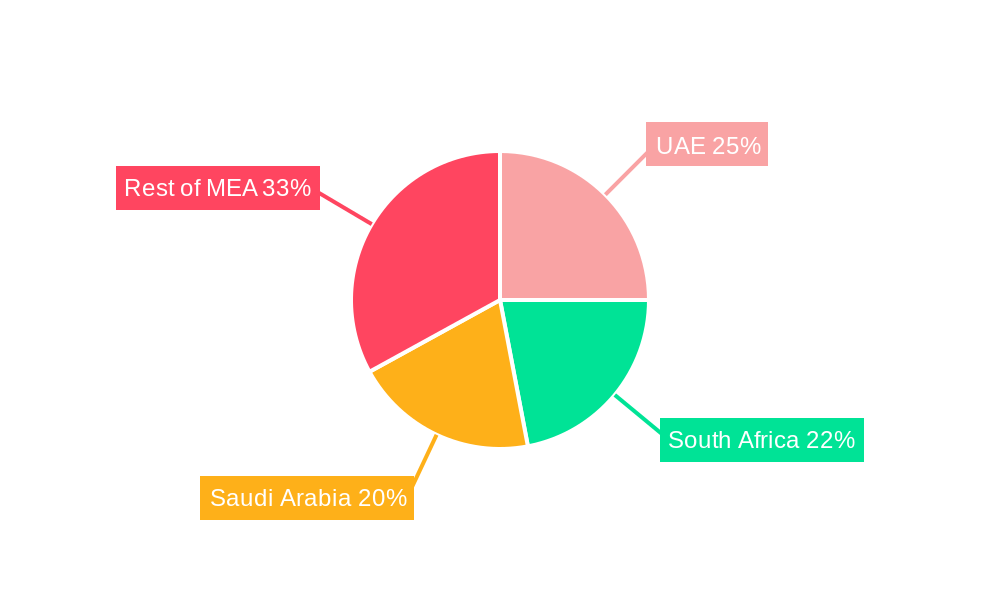
Growth is particularly strong in countries like the UAE and Saudi Arabia due to their higher per capita incomes and advanced retail infrastructure. South Africa also contributes significantly, with a large and growing consumer base. The "Other Product Types" segment, encompassing functional beverages and specialized drinks, is expected to witness above-average growth due to the increasing health-consciousness among consumers. Growth in the convenience store and online channels is likely to outpace traditional supermarkets in the coming years. The competitive landscape is dynamic, with multinational corporations strategically investing in the region alongside local players capitalizing on local preferences and tastes. The continued focus on product innovation, strategic partnerships, and expanding distribution networks will be key factors determining market success in the years to come.
Middle East and Africa Ready to Drink Beverages Market: A Comprehensive Report (2019-2033)
This detailed report provides a comprehensive analysis of the Middle East and Africa Ready-to-Drink (RTD) Beverages market, covering the historical period (2019-2024), base year (2025), and forecast period (2025-2033). It offers invaluable insights for industry stakeholders, including manufacturers, distributors, investors, and market researchers seeking to understand this dynamic market. The report leverages extensive data and in-depth analysis to unveil growth opportunities and challenges, with a focus on key segments, leading players, and emerging trends. The analysis spans various product types, distribution channels, and geographical regions, providing a granular perspective of the market landscape.
Middle East and Africa Ready to Drink Beverages Market Concentration & Innovation
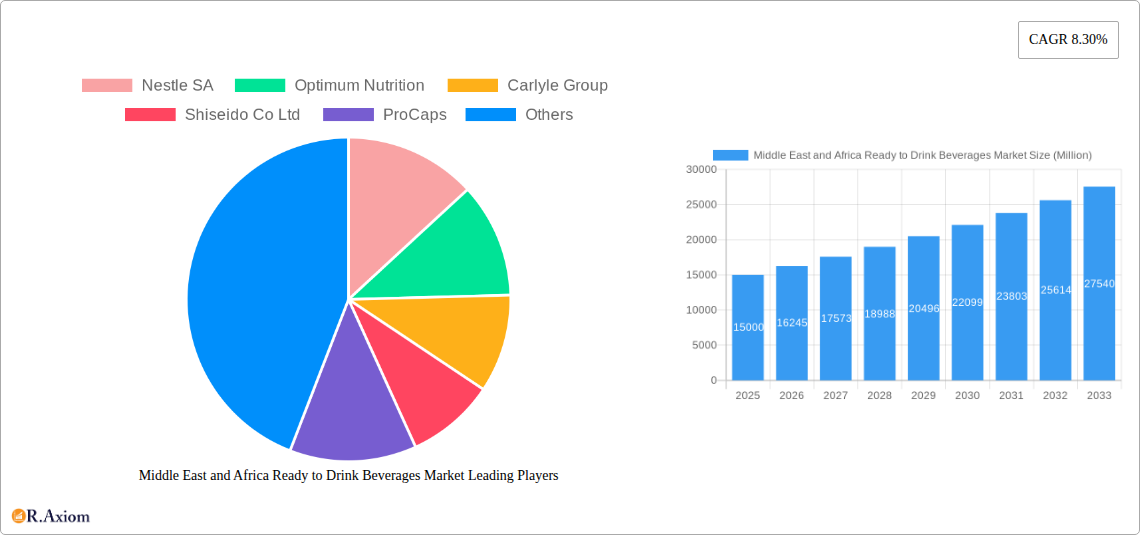
This section analyzes the market concentration, highlighting the market share of key players such as Nestle SA, Optimum Nutrition, and others. We assess the role of innovation drivers, including technological advancements in packaging and beverage formulation, in shaping market dynamics. The regulatory landscape's impact, including labeling requirements and health regulations, is also scrutinized. Furthermore, the report investigates the presence of substitute products and evolving end-user trends, such as increasing health consciousness and demand for functional beverages. The analysis includes an examination of recent mergers and acquisitions (M&A) activities, with a focus on deal values and their implications for market consolidation. The overall market concentration is estimated at xx% in 2025, indicating a moderately concentrated market. Several smaller players contribute to the remaining market share.
- Market Share Analysis: Nestle SA holds an estimated xx% market share in 2025, followed by Optimum Nutrition at xx%.
- M&A Activity: The report details specific M&A deals in the RTD beverage sector within the MEA region, including deal values and strategic rationale. For example, xx Million USD worth of deals were recorded in 2024 (predicted).
- Innovation Drivers: Growth of functional beverages, plant-based options, and sustainable packaging are key drivers.
- Regulatory Framework: The report includes an in-depth analysis of current regulations and their impact on market growth.
Middle East and Africa Ready to Drink Beverages Market Industry Trends & Insights
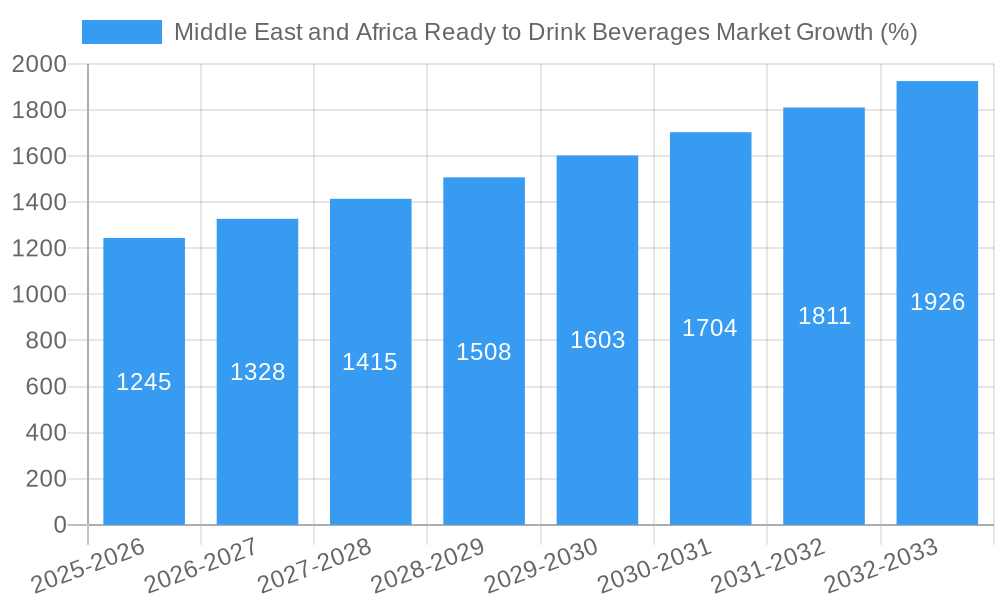
This section delves into the key trends shaping the MEA RTD beverage market. We project a Compound Annual Growth Rate (CAGR) of xx% from 2025 to 2033, driven by factors such as rising disposable incomes, urbanization, and changing consumer preferences. Technological advancements, particularly in beverage processing and packaging, are driving efficiency and innovation. The market penetration of RTD beverages is steadily increasing, with a projected penetration rate of xx% by 2033. Consumer preferences are shifting towards healthier options, such as low-sugar and functional beverages, creating both opportunities and challenges for market players. Competitive dynamics are characterized by intense competition among established players and the emergence of new entrants.
Dominant Markets & Segments in Middle East and Africa Ready to Drink Beverages Market
This section identifies the dominant segments within the MEA RTD beverage market. The analysis considers both product type (Tea, Coffee, Energy Drinks, Fruit and Vegetable Juice, Dairy-based Beverages, Other Product Types) and distribution channel (Supermarkets/Hypermarkets, Convenience Stores, Online Stores, Other Distribution Channels).
- Dominant Product Type: Fruit and Vegetable Juice is predicted to be the dominant product type in 2025, driven by growing health consciousness.
- Dominant Distribution Channel: Supermarkets/Hypermarkets are the leading distribution channel, with a significant market share, but online stores are experiencing rapid growth.
Key Drivers:
- Economic Policies: Government initiatives promoting local production and consumption contribute significantly to market growth.
- Infrastructure: Improved infrastructure (e.g., cold chain logistics) facilitates wider distribution of RTD beverages.
Detailed analysis of regional and country-level dominance within MEA is provided in the full report.
Middle East and Africa Ready to Drink Beverages Market Product Developments
The MEA RTD beverage market witnesses continuous product innovation, with a focus on health and wellness. Companies are introducing new flavors, functional ingredients (e.g., probiotics, vitamins), and sustainable packaging solutions to cater to evolving consumer demands. Technological advancements in processing and preservation techniques further enhance product quality and shelf life. This innovation fuels increased competitiveness and market expansion.
Report Scope & Segmentation Analysis
This report comprehensively segments the MEA RTD beverage market by both Product Type and Distribution Channel.
Product Type: Each segment (Tea, Coffee, Energy Drinks, Fruit and Vegetable Juice, Dairy-based Beverages, Other Product Types) is analyzed for market size, growth projections, and competitive dynamics. Market sizes are presented in Millions.
Distribution Channel: Market size, growth projections, and competitive dynamics are analyzed for each channel (Supermarkets/Hypermarkets, Convenience Stores, Online Stores, Other Distribution Channels).
Key Drivers of Middle East and Africa Ready to Drink Beverages Market Growth
The growth of the MEA RTD beverage market is driven by several factors. Rising disposable incomes and a growing middle class fuel higher consumption. Urbanization leads to increased demand for convenient beverages. Changing lifestyles and preferences, with a preference towards healthier options, are also key drivers.
Challenges in the Middle East and Africa Ready to Drink Beverages Market Sector
The market faces challenges such as fluctuating raw material prices, stringent regulatory requirements, and intense competition. Supply chain disruptions and logistical challenges in certain regions also impact market growth.
Emerging Opportunities in Middle East and Africa Ready to Drink Beverages Market
The market presents significant growth opportunities. Expanding e-commerce platforms provide new avenues for distribution. The increasing popularity of functional and health-conscious beverages creates opportunities for product diversification. Untapped markets in rural areas offer significant potential.
Leading Players in the Middle East and Africa Ready to Drink Beverages Market Market
- Nestle SA
- Optimum Nutrition
- Carlyle Group
- Shiseido Co Ltd
- ProCaps
- Laboratories LLC
- Rejuvenated Ltd
- Holland & Barrett
- Nutraformis Limited
- Naturals LLC
- Revive
Key Developments in Middle East and Africa Ready to Drink Beverages Market Industry
- July 2022: Arla Foods invested USD 43 Million to expand its RTD product line in the Middle East, Asia, and Europe.
- May 2022: Emirates Food Industries launched Hayatna ready-to-consume dairy products in the UAE.
- April 2021: The Coca-Cola Company's Honest Tea launched Honest Yebra Mate RTD tea in Saudi Arabia.
Strategic Outlook for Middle East and Africa Ready to Drink Beverages Market Market
The MEA RTD beverage market exhibits strong future potential, driven by sustained economic growth, urbanization, and evolving consumer preferences. Strategic investments in product innovation, efficient distribution networks, and brand building are crucial for success. Adapting to changing consumer demands and navigating the regulatory landscape will be vital for achieving sustainable growth.
Middle East and Africa Ready to Drink Beverages Market Segmentation
-
1. Product Type
- 1.1. Tea
- 1.2. Coffee
- 1.3. Energy Drinks
- 1.4. Fruit and Vegetable Juice
- 1.5. Dairy-based Beverages
- 1.6. Other Product Types
-
2. Distribution Channel
- 2.1. Supermarkets/Hypermarkets
- 2.2. Convenience Stores
- 2.3. Online Stores
- 2.4. Other Distribution Channels
-
3. Geography
- 3.1. Saudi Arabia
- 3.2. United Arab Emirates
- 3.3. South Africa
- 3.4. Rest of Middle East and Africa
Middle East and Africa Ready to Drink Beverages Market Segmentation By Geography
- 1. Saudi Arabia
- 2. United Arab Emirates
- 3. South Africa
- 4. Rest of Middle East and Africa
Middle East and Africa Ready to Drink Beverages Market REPORT HIGHLIGHTS
| Aspects | Details |
|---|---|
| Study Period | 2019-2033 |
| Base Year | 2024 |
| Estimated Year | 2025 |
| Forecast Period | 2025-2033 |
| Historical Period | 2019-2024 |
| Growth Rate | CAGR of 8.30% from 2019-2033 |
| Segmentation |
|
Table of Contents
- 1. Introduction
- 1.1. Research Scope
- 1.2. Market Segmentation
- 1.3. Research Methodology
- 1.4. Definitions and Assumptions
- 2. Executive Summary
- 2.1. Introduction
- 3. Market Dynamics
- 3.1. Introduction
- 3.2. Market Drivers
- 3.2.1. Demand for specialty and organic coffee pods and capsules; Innovations in packaging formats
- 3.3. Market Restrains
- 3.3.1. Availability of counterfeit products
- 3.4. Market Trends
- 3.4.1. Increasing Inclination Toward Healthy and Convenience Drinking Habits
- 4. Market Factor Analysis
- 4.1. Porters Five Forces
- 4.2. Supply/Value Chain
- 4.3. PESTEL analysis
- 4.4. Market Entropy
- 4.5. Patent/Trademark Analysis
- 5. Middle East and Africa Ready to Drink Beverages Market Analysis, Insights and Forecast, 2019-2031
- 5.1. Market Analysis, Insights and Forecast - by Product Type
- 5.1.1. Tea
- 5.1.2. Coffee
- 5.1.3. Energy Drinks
- 5.1.4. Fruit and Vegetable Juice
- 5.1.5. Dairy-based Beverages
- 5.1.6. Other Product Types
- 5.2. Market Analysis, Insights and Forecast - by Distribution Channel
- 5.2.1. Supermarkets/Hypermarkets
- 5.2.2. Convenience Stores
- 5.2.3. Online Stores
- 5.2.4. Other Distribution Channels
- 5.3. Market Analysis, Insights and Forecast - by Geography
- 5.3.1. Saudi Arabia
- 5.3.2. United Arab Emirates
- 5.3.3. South Africa
- 5.3.4. Rest of Middle East and Africa
- 5.4. Market Analysis, Insights and Forecast - by Region
- 5.4.1. Saudi Arabia
- 5.4.2. United Arab Emirates
- 5.4.3. South Africa
- 5.4.4. Rest of Middle East and Africa
- 5.1. Market Analysis, Insights and Forecast - by Product Type
- 6. Saudi Arabia Middle East and Africa Ready to Drink Beverages Market Analysis, Insights and Forecast, 2019-2031
- 6.1. Market Analysis, Insights and Forecast - by Product Type
- 6.1.1. Tea
- 6.1.2. Coffee
- 6.1.3. Energy Drinks
- 6.1.4. Fruit and Vegetable Juice
- 6.1.5. Dairy-based Beverages
- 6.1.6. Other Product Types
- 6.2. Market Analysis, Insights and Forecast - by Distribution Channel
- 6.2.1. Supermarkets/Hypermarkets
- 6.2.2. Convenience Stores
- 6.2.3. Online Stores
- 6.2.4. Other Distribution Channels
- 6.3. Market Analysis, Insights and Forecast - by Geography
- 6.3.1. Saudi Arabia
- 6.3.2. United Arab Emirates
- 6.3.3. South Africa
- 6.3.4. Rest of Middle East and Africa
- 6.1. Market Analysis, Insights and Forecast - by Product Type
- 7. United Arab Emirates Middle East and Africa Ready to Drink Beverages Market Analysis, Insights and Forecast, 2019-2031
- 7.1. Market Analysis, Insights and Forecast - by Product Type
- 7.1.1. Tea
- 7.1.2. Coffee
- 7.1.3. Energy Drinks
- 7.1.4. Fruit and Vegetable Juice
- 7.1.5. Dairy-based Beverages
- 7.1.6. Other Product Types
- 7.2. Market Analysis, Insights and Forecast - by Distribution Channel
- 7.2.1. Supermarkets/Hypermarkets
- 7.2.2. Convenience Stores
- 7.2.3. Online Stores
- 7.2.4. Other Distribution Channels
- 7.3. Market Analysis, Insights and Forecast - by Geography
- 7.3.1. Saudi Arabia
- 7.3.2. United Arab Emirates
- 7.3.3. South Africa
- 7.3.4. Rest of Middle East and Africa
- 7.1. Market Analysis, Insights and Forecast - by Product Type
- 8. South Africa Middle East and Africa Ready to Drink Beverages Market Analysis, Insights and Forecast, 2019-2031
- 8.1. Market Analysis, Insights and Forecast - by Product Type
- 8.1.1. Tea
- 8.1.2. Coffee
- 8.1.3. Energy Drinks
- 8.1.4. Fruit and Vegetable Juice
- 8.1.5. Dairy-based Beverages
- 8.1.6. Other Product Types
- 8.2. Market Analysis, Insights and Forecast - by Distribution Channel
- 8.2.1. Supermarkets/Hypermarkets
- 8.2.2. Convenience Stores
- 8.2.3. Online Stores
- 8.2.4. Other Distribution Channels
- 8.3. Market Analysis, Insights and Forecast - by Geography
- 8.3.1. Saudi Arabia
- 8.3.2. United Arab Emirates
- 8.3.3. South Africa
- 8.3.4. Rest of Middle East and Africa
- 8.1. Market Analysis, Insights and Forecast - by Product Type
- 9. Rest of Middle East and Africa Middle East and Africa Ready to Drink Beverages Market Analysis, Insights and Forecast, 2019-2031
- 9.1. Market Analysis, Insights and Forecast - by Product Type
- 9.1.1. Tea
- 9.1.2. Coffee
- 9.1.3. Energy Drinks
- 9.1.4. Fruit and Vegetable Juice
- 9.1.5. Dairy-based Beverages
- 9.1.6. Other Product Types
- 9.2. Market Analysis, Insights and Forecast - by Distribution Channel
- 9.2.1. Supermarkets/Hypermarkets
- 9.2.2. Convenience Stores
- 9.2.3. Online Stores
- 9.2.4. Other Distribution Channels
- 9.3. Market Analysis, Insights and Forecast - by Geography
- 9.3.1. Saudi Arabia
- 9.3.2. United Arab Emirates
- 9.3.3. South Africa
- 9.3.4. Rest of Middle East and Africa
- 9.1. Market Analysis, Insights and Forecast - by Product Type
- 10. UAE Middle East and Africa Ready to Drink Beverages Market Analysis, Insights and Forecast, 2019-2031
- 11. South Africa Middle East and Africa Ready to Drink Beverages Market Analysis, Insights and Forecast, 2019-2031
- 12. Saudi Arabia Middle East and Africa Ready to Drink Beverages Market Analysis, Insights and Forecast, 2019-2031
- 13. Rest of MEA Middle East and Africa Ready to Drink Beverages Market Analysis, Insights and Forecast, 2019-2031
- 14. Competitive Analysis
- 14.1. Market Share Analysis 2024
- 14.2. Company Profiles
- 14.2.1 Nestle SA
- 14.2.1.1. Overview
- 14.2.1.2. Products
- 14.2.1.3. SWOT Analysis
- 14.2.1.4. Recent Developments
- 14.2.1.5. Financials (Based on Availability)
- 14.2.2 Optimum Nutrition
- 14.2.2.1. Overview
- 14.2.2.2. Products
- 14.2.2.3. SWOT Analysis
- 14.2.2.4. Recent Developments
- 14.2.2.5. Financials (Based on Availability)
- 14.2.3 Carlyle Group
- 14.2.3.1. Overview
- 14.2.3.2. Products
- 14.2.3.3. SWOT Analysis
- 14.2.3.4. Recent Developments
- 14.2.3.5. Financials (Based on Availability)
- 14.2.4 Shiseido Co Ltd
- 14.2.4.1. Overview
- 14.2.4.2. Products
- 14.2.4.3. SWOT Analysis
- 14.2.4.4. Recent Developments
- 14.2.4.5. Financials (Based on Availability)
- 14.2.5 ProCaps
- 14.2.5.1. Overview
- 14.2.5.2. Products
- 14.2.5.3. SWOT Analysis
- 14.2.5.4. Recent Developments
- 14.2.5.5. Financials (Based on Availability)
- 14.2.6 Laboratories LLC
- 14.2.6.1. Overview
- 14.2.6.2. Products
- 14.2.6.3. SWOT Analysis
- 14.2.6.4. Recent Developments
- 14.2.6.5. Financials (Based on Availability)
- 14.2.7 Rejuvenated Ltd
- 14.2.7.1. Overview
- 14.2.7.2. Products
- 14.2.7.3. SWOT Analysis
- 14.2.7.4. Recent Developments
- 14.2.7.5. Financials (Based on Availability)
- 14.2.8 Holland & Barrett
- 14.2.8.1. Overview
- 14.2.8.2. Products
- 14.2.8.3. SWOT Analysis
- 14.2.8.4. Recent Developments
- 14.2.8.5. Financials (Based on Availability)
- 14.2.9 Nutraformis Limited
- 14.2.9.1. Overview
- 14.2.9.2. Products
- 14.2.9.3. SWOT Analysis
- 14.2.9.4. Recent Developments
- 14.2.9.5. Financials (Based on Availability)
- 14.2.10 Naturals LLC
- 14.2.10.1. Overview
- 14.2.10.2. Products
- 14.2.10.3. SWOT Analysis
- 14.2.10.4. Recent Developments
- 14.2.10.5. Financials (Based on Availability)
- 14.2.11 Revive
- 14.2.11.1. Overview
- 14.2.11.2. Products
- 14.2.11.3. SWOT Analysis
- 14.2.11.4. Recent Developments
- 14.2.11.5. Financials (Based on Availability)
- 14.2.1 Nestle SA
List of Figures
- Figure 1: Middle East and Africa Ready to Drink Beverages Market Revenue Breakdown (Million, %) by Product 2024 & 2032
- Figure 2: Middle East and Africa Ready to Drink Beverages Market Share (%) by Company 2024
List of Tables
- Table 1: Middle East and Africa Ready to Drink Beverages Market Revenue Million Forecast, by Region 2019 & 2032
- Table 2: Middle East and Africa Ready to Drink Beverages Market Revenue Million Forecast, by Product Type 2019 & 2032
- Table 3: Middle East and Africa Ready to Drink Beverages Market Revenue Million Forecast, by Distribution Channel 2019 & 2032
- Table 4: Middle East and Africa Ready to Drink Beverages Market Revenue Million Forecast, by Geography 2019 & 2032
- Table 5: Middle East and Africa Ready to Drink Beverages Market Revenue Million Forecast, by Region 2019 & 2032
- Table 6: Middle East and Africa Ready to Drink Beverages Market Revenue Million Forecast, by Country 2019 & 2032
- Table 7: UAE Middle East and Africa Ready to Drink Beverages Market Revenue (Million) Forecast, by Application 2019 & 2032
- Table 8: South Africa Middle East and Africa Ready to Drink Beverages Market Revenue (Million) Forecast, by Application 2019 & 2032
- Table 9: Saudi Arabia Middle East and Africa Ready to Drink Beverages Market Revenue (Million) Forecast, by Application 2019 & 2032
- Table 10: Rest of MEA Middle East and Africa Ready to Drink Beverages Market Revenue (Million) Forecast, by Application 2019 & 2032
- Table 11: Middle East and Africa Ready to Drink Beverages Market Revenue Million Forecast, by Product Type 2019 & 2032
- Table 12: Middle East and Africa Ready to Drink Beverages Market Revenue Million Forecast, by Distribution Channel 2019 & 2032
- Table 13: Middle East and Africa Ready to Drink Beverages Market Revenue Million Forecast, by Geography 2019 & 2032
- Table 14: Middle East and Africa Ready to Drink Beverages Market Revenue Million Forecast, by Country 2019 & 2032
- Table 15: Middle East and Africa Ready to Drink Beverages Market Revenue Million Forecast, by Product Type 2019 & 2032
- Table 16: Middle East and Africa Ready to Drink Beverages Market Revenue Million Forecast, by Distribution Channel 2019 & 2032
- Table 17: Middle East and Africa Ready to Drink Beverages Market Revenue Million Forecast, by Geography 2019 & 2032
- Table 18: Middle East and Africa Ready to Drink Beverages Market Revenue Million Forecast, by Country 2019 & 2032
- Table 19: Middle East and Africa Ready to Drink Beverages Market Revenue Million Forecast, by Product Type 2019 & 2032
- Table 20: Middle East and Africa Ready to Drink Beverages Market Revenue Million Forecast, by Distribution Channel 2019 & 2032
- Table 21: Middle East and Africa Ready to Drink Beverages Market Revenue Million Forecast, by Geography 2019 & 2032
- Table 22: Middle East and Africa Ready to Drink Beverages Market Revenue Million Forecast, by Country 2019 & 2032
- Table 23: Middle East and Africa Ready to Drink Beverages Market Revenue Million Forecast, by Product Type 2019 & 2032
- Table 24: Middle East and Africa Ready to Drink Beverages Market Revenue Million Forecast, by Distribution Channel 2019 & 2032
- Table 25: Middle East and Africa Ready to Drink Beverages Market Revenue Million Forecast, by Geography 2019 & 2032
- Table 26: Middle East and Africa Ready to Drink Beverages Market Revenue Million Forecast, by Country 2019 & 2032
Frequently Asked Questions
1. What is the projected Compound Annual Growth Rate (CAGR) of the Middle East and Africa Ready to Drink Beverages Market?
The projected CAGR is approximately 8.30%.
2. Which companies are prominent players in the Middle East and Africa Ready to Drink Beverages Market?
Key companies in the market include Nestle SA , Optimum Nutrition , Carlyle Group , Shiseido Co Ltd , ProCaps , Laboratories LLC , Rejuvenated Ltd , Holland & Barrett , Nutraformis Limited , Naturals LLC, Revive .
3. What are the main segments of the Middle East and Africa Ready to Drink Beverages Market?
The market segments include Product Type, Distribution Channel, Geography.
4. Can you provide details about the market size?
The market size is estimated to be USD XX Million as of 2022.
5. What are some drivers contributing to market growth?
Demand for specialty and organic coffee pods and capsules; Innovations in packaging formats.
6. What are the notable trends driving market growth?
Increasing Inclination Toward Healthy and Convenience Drinking Habits.
7. Are there any restraints impacting market growth?
Availability of counterfeit products.
8. Can you provide examples of recent developments in the market?
July 2022: Arla Foods declared an investment of USD 43 million for expanding its ready to drink product line in the Middle East, Asia, and Europe regions.
9. What pricing options are available for accessing the report?
Pricing options include single-user, multi-user, and enterprise licenses priced at USD 4750, USD 5250, and USD 8750 respectively.
10. Is the market size provided in terms of value or volume?
The market size is provided in terms of value, measured in Million.
11. Are there any specific market keywords associated with the report?
Yes, the market keyword associated with the report is "Middle East and Africa Ready to Drink Beverages Market," which aids in identifying and referencing the specific market segment covered.
12. How do I determine which pricing option suits my needs best?
The pricing options vary based on user requirements and access needs. Individual users may opt for single-user licenses, while businesses requiring broader access may choose multi-user or enterprise licenses for cost-effective access to the report.
13. Are there any additional resources or data provided in the Middle East and Africa Ready to Drink Beverages Market report?
While the report offers comprehensive insights, it's advisable to review the specific contents or supplementary materials provided to ascertain if additional resources or data are available.
14. How can I stay updated on further developments or reports in the Middle East and Africa Ready to Drink Beverages Market?
To stay informed about further developments, trends, and reports in the Middle East and Africa Ready to Drink Beverages Market, consider subscribing to industry newsletters, following relevant companies and organizations, or regularly checking reputable industry news sources and publications.
Methodology
Step 1 - Identification of Relevant Samples Size from Population Database


Step 2 - Approaches for Defining Global Market Size (Value, Volume* & Price*)

Note*: In applicable scenarios
Step 3 - Data Sources
Primary Research
- Web Analytics
- Survey Reports
- Research Institute
- Latest Research Reports
- Opinion Leaders
Secondary Research
- Annual Reports
- White Paper
- Latest Press Release
- Industry Association
- Paid Database
- Investor Presentations

Step 4 - Data Triangulation
Involves using different sources of information in order to increase the validity of a study
These sources are likely to be stakeholders in a program - participants, other researchers, program staff, other community members, and so on.
Then we put all data in single framework & apply various statistical tools to find out the dynamic on the market.
During the analysis stage, feedback from the stakeholder groups would be compared to determine areas of agreement as well as areas of divergence


