
Key Insights
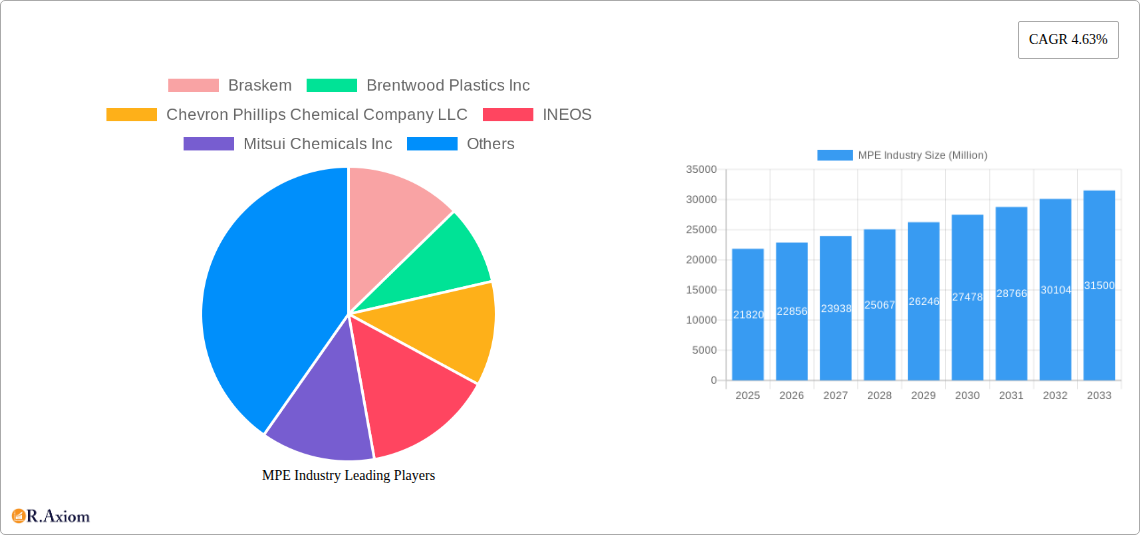
The global market for Metallocene Polyethylene (MPE) is experiencing steady growth, projected to reach $21.82 billion in 2025 and maintain a Compound Annual Growth Rate (CAGR) of 4.63% from 2025 to 2033. This expansion is driven by several key factors. Increasing demand from the packaging industry, particularly for flexible films requiring high strength and clarity, is a major contributor. The automotive sector's adoption of MPE in lightweight components for improved fuel efficiency further fuels market growth. Advances in MPE technology, leading to enhanced performance characteristics like improved barrier properties and melt strength, are also driving adoption across diverse applications. Furthermore, the growing focus on sustainable packaging solutions and the inherent recyclability of MPE are contributing to its increased market penetration. Major players like Braskem, Chevron Phillips Chemical, and SABIC are actively investing in expanding their MPE production capacity and developing innovative product variations to cater to this growing demand.
The market, however, faces certain restraints. Fluctuations in raw material prices, particularly ethylene, can impact production costs and profitability. Competition from other polyethylene types, such as linear low-density polyethylene (LLDPE) and high-density polyethylene (HDPE), continues to put pressure on market share. Moreover, regulatory changes related to plastic waste management and potential environmental concerns could influence the growth trajectory in certain regions. Despite these challenges, the overall outlook for the MPE market remains positive, driven by the aforementioned growth drivers and the ongoing innovation within the industry, which is focused on enhancing product properties and expanding its application range. Segmentation analysis, while not provided, would likely reveal significant variations in growth rates across different applications and geographical markets reflecting varying levels of adoption and regulatory influence.
Deep Dive into the MPE Industry: A Comprehensive Market Report (2019-2033)
This comprehensive report provides a detailed analysis of the MPE (Metallocene Polyethylene) industry, offering invaluable insights for stakeholders across the value chain. The study covers the period 2019-2033, with a focus on the forecast period 2025-2033 and a base year of 2025. The report leverages extensive market research to provide a robust understanding of market dynamics, competitive landscape, and future growth potential. The total market size is estimated at xx Million in 2025 and is projected to reach xx Million by 2033.
MPE Industry Market Concentration & Innovation
This section analyzes the competitive landscape of the MPE industry, exploring market concentration, innovation drivers, regulatory influences, and strategic activities. Key players like Braskem, Brentwood Plastics Inc, Chevron Phillips Chemical Company LLC, INEOS, Mitsui Chemicals Inc, Prime Polymer Co Ltd, SABIC, TotalEnergies, Univation Technologies LLC, and W R Grace & Co -Conn (list not exhaustive) are examined for their market share and strategic moves.
- Market Concentration: The MPE market exhibits a moderately concentrated structure, with the top 5 players holding an estimated xx% market share in 2025. This concentration is influenced by significant economies of scale and high capital investment requirements.
- Innovation Drivers: Innovation in MPE focuses on enhancing material properties like strength, flexibility, and barrier properties to cater to diverse applications. Research and development efforts are concentrated on improving process efficiency and reducing environmental impact.
- Regulatory Frameworks: Government regulations concerning plastic waste and environmental sustainability are significantly impacting the MPE market. Regulations promoting the use of recyclable and biodegradable polymers are driving innovation in MPE formulations.
- Product Substitutes: Competition from other polymers like HDPE, LDPE, and bioplastics is impacting market growth. The MPE industry is responding by developing products with superior properties and cost-effectiveness.
- End-User Trends: The growth of the MPE market is driven by increasing demand from packaging, automotive, and renewable energy sectors. Consumer preference for sustainable and lightweight packaging solutions further boosts market demand.
- M&A Activities: The MPE industry has witnessed several mergers and acquisitions in recent years, valued at approximately xx Million collectively. These activities are aimed at expanding market reach, enhancing product portfolios, and gaining access to advanced technologies.
MPE Industry Industry Trends & Insights
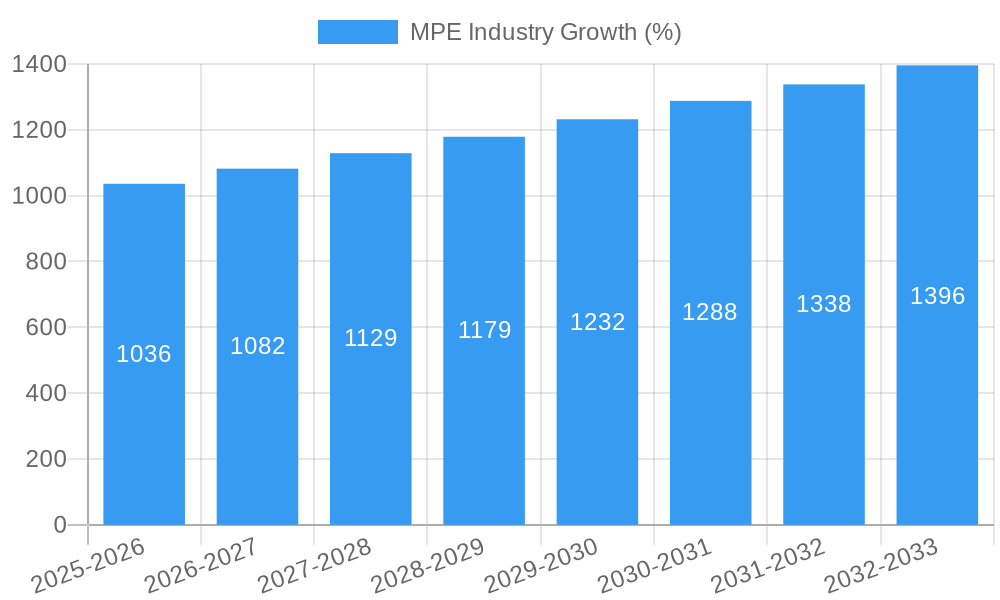
This section delves into the key trends and insights shaping the MPE industry. The market is witnessing robust growth driven by increasing demand from various end-use sectors, technological advancements, and shifting consumer preferences. The Compound Annual Growth Rate (CAGR) is projected to be xx% during the forecast period. Market penetration of MPE in various applications is steadily increasing, especially in the flexible packaging and automotive sectors.
Technological advancements in polymerization processes and the development of innovative MPE grades with enhanced properties are driving market growth. Consumer preferences for sustainable and eco-friendly products are further bolstering demand for MPE, which offers superior recyclability compared to some other polymer types. Competitive dynamics are characterized by intense competition among major players, with companies focusing on innovation, cost reduction, and strategic partnerships to gain a competitive edge. The market is also witnessing increasing entry of new players, especially in niche applications.
Dominant Markets & Segments in MPE Industry
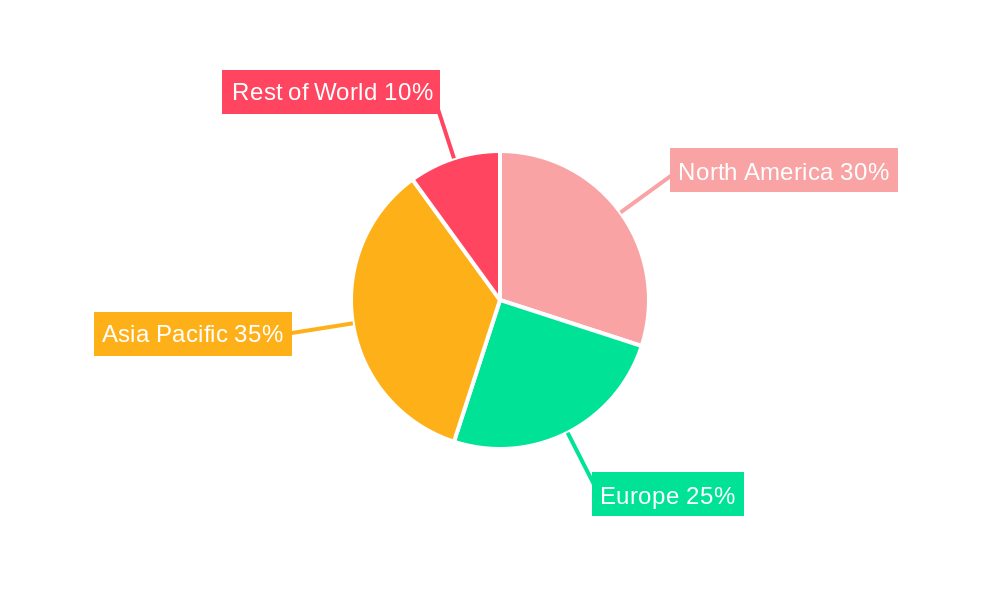
The Asia-Pacific region is currently the dominant market for MPE, driven by rapid industrialization, increasing disposable incomes, and burgeoning demand from various end-use sectors such as packaging and automotive. China and India are the key contributors to this regional dominance.
- Key Drivers for Asia-Pacific Dominance:
- Robust economic growth
- Expanding manufacturing sector
- Favorable government policies promoting industrial development
- Growing consumer base
The detailed dominance analysis reveals that Asia-Pacific's strong manufacturing base and rapid economic growth have created a significant demand for MPE. This is further fueled by supportive government policies and the region's large and growing population. While other regions, such as North America and Europe, also show significant demand, the sheer scale of growth in Asia-Pacific makes it the leading market.
MPE Industry Product Developments
Recent product innovations in the MPE industry focus on enhancing material properties like strength, flexibility, and barrier properties, enabling applications in advanced packaging solutions, high-performance films, and automotive components. The development of MPE grades with enhanced biodegradability and recyclability is also gaining traction, addressing increasing consumer demand for eco-friendly materials. These technological trends enable MPE to effectively compete with existing and emerging polymers, creating a strong market fit for various applications.
Report Scope & Segmentation Analysis
This report segments the MPE market by type (linear low-density polyethylene (LLDPE), high-density polyethylene (HDPE), etc.), application (packaging, automotive, consumer goods, etc.), and region (North America, Europe, Asia-Pacific, etc.). Each segment exhibits unique growth projections, market sizes, and competitive dynamics. Growth projections vary based on several factors, with the packaging segment experiencing the fastest growth due to the rising demand for flexible packaging. Competition within segments is fierce, driven by innovation, pricing strategies, and supply chain efficiencies.
Key Drivers of MPE Industry Growth
Several factors are driving the growth of the MPE industry. Technological advancements in polymerization processes are leading to the development of more efficient and sustainable MPE grades. Economic growth, particularly in developing economies, is boosting demand for MPE in various applications. Favorable government policies promoting the use of recyclable plastics and reducing plastic waste further support industry growth. For instance, the growing use of MPE in solar panel encapsulation, driven by government incentives for renewable energy, is a significant growth factor.
Challenges in the MPE Industry Sector
The MPE industry faces challenges such as stringent environmental regulations, fluctuating raw material prices, and intense competition from substitute materials. Supply chain disruptions, particularly related to raw materials and energy costs, can significantly impact production costs and profitability. Stringent regulatory requirements for plastic waste management add to the cost burden for producers. These challenges are estimated to negatively impact the industry's growth by approximately xx% in the next five years.
Emerging Opportunities in MPE Industry
Emerging opportunities for the MPE industry include applications in renewable energy technologies (solar panels, wind turbine components), advanced medical devices, and sustainable packaging solutions. The rising demand for lightweight and high-performance materials in the automotive industry presents significant growth potential. Growing consumer awareness of sustainability is driving demand for recyclable and biodegradable MPE grades, representing a major opportunity for innovation and market expansion.
Leading Players in the MPE Industry Market
- Braskem
- Brentwood Plastics Inc
- Chevron Phillips Chemical Company LLC
- INEOS
- Mitsui Chemicals Inc
- Prime Polymer Co Ltd
- SABIC
- TotalEnergies
- Univation Technologies LLC
- W R Grace & Co -Conn
Key Developments in MPE Industry Industry
- August 2022: SABIC SK Nexlene Company (SSNC), a joint venture of SABIC and SK Geo Centric, announced plans to expand the capacity of its Ulsan plant to produce mPE. This expansion targets the growing demand from applications in solar panels, vehicles, footwear, and flexible packaging, indicating strong growth expectations in these sectors.
Strategic Outlook for MPE Industry Market
The MPE industry is poised for significant growth, driven by continuous technological advancements, increasing demand from diverse end-use sectors, and a growing focus on sustainable solutions. The development of high-performance, eco-friendly MPE grades will be key to capturing market share and meeting evolving consumer preferences. Strategic partnerships and collaborations will play a crucial role in driving innovation and expanding market reach, leading to a positive outlook for the MPE industry in the coming years.
MPE Industry Segmentation
-
1. Type
- 1.1. Metalloc
- 1.2. Metallocene High-density Polyethylene (mHDPE)
- 1.3. Other Ty
-
2. Application
- 2.1. Films
- 2.2. Sheets
- 2.3. Other Applications
-
3. End-User Industry
- 3.1. Packaging
- 3.2. Agriculture
- 3.3. Automotive
- 3.4. Building and Construction
- 3.5. Other End-User Industries
MPE Industry Segmentation By Geography
-
1. Asia Pacific
- 1.1. China
- 1.2. India
- 1.3. Japan
- 1.4. South Korea
- 1.5. Rest of Asia Pacific
-
2. North America
- 2.1. United States
- 2.2. Canada
- 2.3. Mexico
-
3. Europe
- 3.1. Germany
- 3.2. United Kingdom
- 3.3. Italy
- 3.4. France
- 3.5. Rest of Europe
-
4. South America
- 4.1. Brazil
- 4.2. Argentina
- 4.3. Rest of South America
- 5. Middle East
-
6. Saudi Arabia
- 6.1. South Africa
- 6.2. Rest of Middle East
MPE Industry REPORT HIGHLIGHTS
| Aspects | Details |
|---|---|
| Study Period | 2019-2033 |
| Base Year | 2024 |
| Estimated Year | 2025 |
| Forecast Period | 2025-2033 |
| Historical Period | 2019-2024 |
| Growth Rate | CAGR of 4.63% from 2019-2033 |
| Segmentation |
|
Table of Contents
- 1. Introduction
- 1.1. Research Scope
- 1.2. Market Segmentation
- 1.3. Research Methodology
- 1.4. Definitions and Assumptions
- 2. Executive Summary
- 2.1. Introduction
- 3. Market Dynamics
- 3.1. Introduction
- 3.2. Market Drivers
- 3.2.1. Growing Demand for mPE from Various End User Industries; Surge in Adoption of Films and Sheets in Packaging Industry; Other Drivers
- 3.3. Market Restrains
- 3.3.1. Growing Demand for mPE from Various End User Industries; Surge in Adoption of Films and Sheets in Packaging Industry; Other Drivers
- 3.4. Market Trends
- 3.4.1. Increasing Demand for mPE from Packaging Industry
- 4. Market Factor Analysis
- 4.1. Porters Five Forces
- 4.2. Supply/Value Chain
- 4.3. PESTEL analysis
- 4.4. Market Entropy
- 4.5. Patent/Trademark Analysis
- 5. Global MPE Industry Analysis, Insights and Forecast, 2019-2031
- 5.1. Market Analysis, Insights and Forecast - by Type
- 5.1.1. Metalloc
- 5.1.2. Metallocene High-density Polyethylene (mHDPE)
- 5.1.3. Other Ty
- 5.2. Market Analysis, Insights and Forecast - by Application
- 5.2.1. Films
- 5.2.2. Sheets
- 5.2.3. Other Applications
- 5.3. Market Analysis, Insights and Forecast - by End-User Industry
- 5.3.1. Packaging
- 5.3.2. Agriculture
- 5.3.3. Automotive
- 5.3.4. Building and Construction
- 5.3.5. Other End-User Industries
- 5.4. Market Analysis, Insights and Forecast - by Region
- 5.4.1. Asia Pacific
- 5.4.2. North America
- 5.4.3. Europe
- 5.4.4. South America
- 5.4.5. Middle East
- 5.4.6. Saudi Arabia
- 5.1. Market Analysis, Insights and Forecast - by Type
- 6. Asia Pacific MPE Industry Analysis, Insights and Forecast, 2019-2031
- 6.1. Market Analysis, Insights and Forecast - by Type
- 6.1.1. Metalloc
- 6.1.2. Metallocene High-density Polyethylene (mHDPE)
- 6.1.3. Other Ty
- 6.2. Market Analysis, Insights and Forecast - by Application
- 6.2.1. Films
- 6.2.2. Sheets
- 6.2.3. Other Applications
- 6.3. Market Analysis, Insights and Forecast - by End-User Industry
- 6.3.1. Packaging
- 6.3.2. Agriculture
- 6.3.3. Automotive
- 6.3.4. Building and Construction
- 6.3.5. Other End-User Industries
- 6.1. Market Analysis, Insights and Forecast - by Type
- 7. North America MPE Industry Analysis, Insights and Forecast, 2019-2031
- 7.1. Market Analysis, Insights and Forecast - by Type
- 7.1.1. Metalloc
- 7.1.2. Metallocene High-density Polyethylene (mHDPE)
- 7.1.3. Other Ty
- 7.2. Market Analysis, Insights and Forecast - by Application
- 7.2.1. Films
- 7.2.2. Sheets
- 7.2.3. Other Applications
- 7.3. Market Analysis, Insights and Forecast - by End-User Industry
- 7.3.1. Packaging
- 7.3.2. Agriculture
- 7.3.3. Automotive
- 7.3.4. Building and Construction
- 7.3.5. Other End-User Industries
- 7.1. Market Analysis, Insights and Forecast - by Type
- 8. Europe MPE Industry Analysis, Insights and Forecast, 2019-2031
- 8.1. Market Analysis, Insights and Forecast - by Type
- 8.1.1. Metalloc
- 8.1.2. Metallocene High-density Polyethylene (mHDPE)
- 8.1.3. Other Ty
- 8.2. Market Analysis, Insights and Forecast - by Application
- 8.2.1. Films
- 8.2.2. Sheets
- 8.2.3. Other Applications
- 8.3. Market Analysis, Insights and Forecast - by End-User Industry
- 8.3.1. Packaging
- 8.3.2. Agriculture
- 8.3.3. Automotive
- 8.3.4. Building and Construction
- 8.3.5. Other End-User Industries
- 8.1. Market Analysis, Insights and Forecast - by Type
- 9. South America MPE Industry Analysis, Insights and Forecast, 2019-2031
- 9.1. Market Analysis, Insights and Forecast - by Type
- 9.1.1. Metalloc
- 9.1.2. Metallocene High-density Polyethylene (mHDPE)
- 9.1.3. Other Ty
- 9.2. Market Analysis, Insights and Forecast - by Application
- 9.2.1. Films
- 9.2.2. Sheets
- 9.2.3. Other Applications
- 9.3. Market Analysis, Insights and Forecast - by End-User Industry
- 9.3.1. Packaging
- 9.3.2. Agriculture
- 9.3.3. Automotive
- 9.3.4. Building and Construction
- 9.3.5. Other End-User Industries
- 9.1. Market Analysis, Insights and Forecast - by Type
- 10. Middle East MPE Industry Analysis, Insights and Forecast, 2019-2031
- 10.1. Market Analysis, Insights and Forecast - by Type
- 10.1.1. Metalloc
- 10.1.2. Metallocene High-density Polyethylene (mHDPE)
- 10.1.3. Other Ty
- 10.2. Market Analysis, Insights and Forecast - by Application
- 10.2.1. Films
- 10.2.2. Sheets
- 10.2.3. Other Applications
- 10.3. Market Analysis, Insights and Forecast - by End-User Industry
- 10.3.1. Packaging
- 10.3.2. Agriculture
- 10.3.3. Automotive
- 10.3.4. Building and Construction
- 10.3.5. Other End-User Industries
- 10.1. Market Analysis, Insights and Forecast - by Type
- 11. Saudi Arabia MPE Industry Analysis, Insights and Forecast, 2019-2031
- 11.1. Market Analysis, Insights and Forecast - by Type
- 11.1.1. Metalloc
- 11.1.2. Metallocene High-density Polyethylene (mHDPE)
- 11.1.3. Other Ty
- 11.2. Market Analysis, Insights and Forecast - by Application
- 11.2.1. Films
- 11.2.2. Sheets
- 11.2.3. Other Applications
- 11.3. Market Analysis, Insights and Forecast - by End-User Industry
- 11.3.1. Packaging
- 11.3.2. Agriculture
- 11.3.3. Automotive
- 11.3.4. Building and Construction
- 11.3.5. Other End-User Industries
- 11.1. Market Analysis, Insights and Forecast - by Type
- 12. Competitive Analysis
- 12.1. Global Market Share Analysis 2024
- 12.2. Company Profiles
- 12.2.1 Braskem
- 12.2.1.1. Overview
- 12.2.1.2. Products
- 12.2.1.3. SWOT Analysis
- 12.2.1.4. Recent Developments
- 12.2.1.5. Financials (Based on Availability)
- 12.2.2 Brentwood Plastics Inc
- 12.2.2.1. Overview
- 12.2.2.2. Products
- 12.2.2.3. SWOT Analysis
- 12.2.2.4. Recent Developments
- 12.2.2.5. Financials (Based on Availability)
- 12.2.3 Chevron Phillips Chemical Company LLC
- 12.2.3.1. Overview
- 12.2.3.2. Products
- 12.2.3.3. SWOT Analysis
- 12.2.3.4. Recent Developments
- 12.2.3.5. Financials (Based on Availability)
- 12.2.4 INEOS
- 12.2.4.1. Overview
- 12.2.4.2. Products
- 12.2.4.3. SWOT Analysis
- 12.2.4.4. Recent Developments
- 12.2.4.5. Financials (Based on Availability)
- 12.2.5 Mitsui Chemicals Inc
- 12.2.5.1. Overview
- 12.2.5.2. Products
- 12.2.5.3. SWOT Analysis
- 12.2.5.4. Recent Developments
- 12.2.5.5. Financials (Based on Availability)
- 12.2.6 Prime Polymer Co Ltd
- 12.2.6.1. Overview
- 12.2.6.2. Products
- 12.2.6.3. SWOT Analysis
- 12.2.6.4. Recent Developments
- 12.2.6.5. Financials (Based on Availability)
- 12.2.7 SABIC
- 12.2.7.1. Overview
- 12.2.7.2. Products
- 12.2.7.3. SWOT Analysis
- 12.2.7.4. Recent Developments
- 12.2.7.5. Financials (Based on Availability)
- 12.2.8 TotalEnergies
- 12.2.8.1. Overview
- 12.2.8.2. Products
- 12.2.8.3. SWOT Analysis
- 12.2.8.4. Recent Developments
- 12.2.8.5. Financials (Based on Availability)
- 12.2.9 Univation Technologies LLC
- 12.2.9.1. Overview
- 12.2.9.2. Products
- 12.2.9.3. SWOT Analysis
- 12.2.9.4. Recent Developments
- 12.2.9.5. Financials (Based on Availability)
- 12.2.10 W R Grace & Co -Conn*List Not Exhaustive
- 12.2.10.1. Overview
- 12.2.10.2. Products
- 12.2.10.3. SWOT Analysis
- 12.2.10.4. Recent Developments
- 12.2.10.5. Financials (Based on Availability)
- 12.2.1 Braskem
List of Figures
- Figure 1: Global MPE Industry Revenue Breakdown (Million, %) by Region 2024 & 2032
- Figure 2: Global MPE Industry Volume Breakdown (Billion, %) by Region 2024 & 2032
- Figure 3: Asia Pacific MPE Industry Revenue (Million), by Type 2024 & 2032
- Figure 4: Asia Pacific MPE Industry Volume (Billion), by Type 2024 & 2032
- Figure 5: Asia Pacific MPE Industry Revenue Share (%), by Type 2024 & 2032
- Figure 6: Asia Pacific MPE Industry Volume Share (%), by Type 2024 & 2032
- Figure 7: Asia Pacific MPE Industry Revenue (Million), by Application 2024 & 2032
- Figure 8: Asia Pacific MPE Industry Volume (Billion), by Application 2024 & 2032
- Figure 9: Asia Pacific MPE Industry Revenue Share (%), by Application 2024 & 2032
- Figure 10: Asia Pacific MPE Industry Volume Share (%), by Application 2024 & 2032
- Figure 11: Asia Pacific MPE Industry Revenue (Million), by End-User Industry 2024 & 2032
- Figure 12: Asia Pacific MPE Industry Volume (Billion), by End-User Industry 2024 & 2032
- Figure 13: Asia Pacific MPE Industry Revenue Share (%), by End-User Industry 2024 & 2032
- Figure 14: Asia Pacific MPE Industry Volume Share (%), by End-User Industry 2024 & 2032
- Figure 15: Asia Pacific MPE Industry Revenue (Million), by Country 2024 & 2032
- Figure 16: Asia Pacific MPE Industry Volume (Billion), by Country 2024 & 2032
- Figure 17: Asia Pacific MPE Industry Revenue Share (%), by Country 2024 & 2032
- Figure 18: Asia Pacific MPE Industry Volume Share (%), by Country 2024 & 2032
- Figure 19: North America MPE Industry Revenue (Million), by Type 2024 & 2032
- Figure 20: North America MPE Industry Volume (Billion), by Type 2024 & 2032
- Figure 21: North America MPE Industry Revenue Share (%), by Type 2024 & 2032
- Figure 22: North America MPE Industry Volume Share (%), by Type 2024 & 2032
- Figure 23: North America MPE Industry Revenue (Million), by Application 2024 & 2032
- Figure 24: North America MPE Industry Volume (Billion), by Application 2024 & 2032
- Figure 25: North America MPE Industry Revenue Share (%), by Application 2024 & 2032
- Figure 26: North America MPE Industry Volume Share (%), by Application 2024 & 2032
- Figure 27: North America MPE Industry Revenue (Million), by End-User Industry 2024 & 2032
- Figure 28: North America MPE Industry Volume (Billion), by End-User Industry 2024 & 2032
- Figure 29: North America MPE Industry Revenue Share (%), by End-User Industry 2024 & 2032
- Figure 30: North America MPE Industry Volume Share (%), by End-User Industry 2024 & 2032
- Figure 31: North America MPE Industry Revenue (Million), by Country 2024 & 2032
- Figure 32: North America MPE Industry Volume (Billion), by Country 2024 & 2032
- Figure 33: North America MPE Industry Revenue Share (%), by Country 2024 & 2032
- Figure 34: North America MPE Industry Volume Share (%), by Country 2024 & 2032
- Figure 35: Europe MPE Industry Revenue (Million), by Type 2024 & 2032
- Figure 36: Europe MPE Industry Volume (Billion), by Type 2024 & 2032
- Figure 37: Europe MPE Industry Revenue Share (%), by Type 2024 & 2032
- Figure 38: Europe MPE Industry Volume Share (%), by Type 2024 & 2032
- Figure 39: Europe MPE Industry Revenue (Million), by Application 2024 & 2032
- Figure 40: Europe MPE Industry Volume (Billion), by Application 2024 & 2032
- Figure 41: Europe MPE Industry Revenue Share (%), by Application 2024 & 2032
- Figure 42: Europe MPE Industry Volume Share (%), by Application 2024 & 2032
- Figure 43: Europe MPE Industry Revenue (Million), by End-User Industry 2024 & 2032
- Figure 44: Europe MPE Industry Volume (Billion), by End-User Industry 2024 & 2032
- Figure 45: Europe MPE Industry Revenue Share (%), by End-User Industry 2024 & 2032
- Figure 46: Europe MPE Industry Volume Share (%), by End-User Industry 2024 & 2032
- Figure 47: Europe MPE Industry Revenue (Million), by Country 2024 & 2032
- Figure 48: Europe MPE Industry Volume (Billion), by Country 2024 & 2032
- Figure 49: Europe MPE Industry Revenue Share (%), by Country 2024 & 2032
- Figure 50: Europe MPE Industry Volume Share (%), by Country 2024 & 2032
- Figure 51: South America MPE Industry Revenue (Million), by Type 2024 & 2032
- Figure 52: South America MPE Industry Volume (Billion), by Type 2024 & 2032
- Figure 53: South America MPE Industry Revenue Share (%), by Type 2024 & 2032
- Figure 54: South America MPE Industry Volume Share (%), by Type 2024 & 2032
- Figure 55: South America MPE Industry Revenue (Million), by Application 2024 & 2032
- Figure 56: South America MPE Industry Volume (Billion), by Application 2024 & 2032
- Figure 57: South America MPE Industry Revenue Share (%), by Application 2024 & 2032
- Figure 58: South America MPE Industry Volume Share (%), by Application 2024 & 2032
- Figure 59: South America MPE Industry Revenue (Million), by End-User Industry 2024 & 2032
- Figure 60: South America MPE Industry Volume (Billion), by End-User Industry 2024 & 2032
- Figure 61: South America MPE Industry Revenue Share (%), by End-User Industry 2024 & 2032
- Figure 62: South America MPE Industry Volume Share (%), by End-User Industry 2024 & 2032
- Figure 63: South America MPE Industry Revenue (Million), by Country 2024 & 2032
- Figure 64: South America MPE Industry Volume (Billion), by Country 2024 & 2032
- Figure 65: South America MPE Industry Revenue Share (%), by Country 2024 & 2032
- Figure 66: South America MPE Industry Volume Share (%), by Country 2024 & 2032
- Figure 67: Middle East MPE Industry Revenue (Million), by Type 2024 & 2032
- Figure 68: Middle East MPE Industry Volume (Billion), by Type 2024 & 2032
- Figure 69: Middle East MPE Industry Revenue Share (%), by Type 2024 & 2032
- Figure 70: Middle East MPE Industry Volume Share (%), by Type 2024 & 2032
- Figure 71: Middle East MPE Industry Revenue (Million), by Application 2024 & 2032
- Figure 72: Middle East MPE Industry Volume (Billion), by Application 2024 & 2032
- Figure 73: Middle East MPE Industry Revenue Share (%), by Application 2024 & 2032
- Figure 74: Middle East MPE Industry Volume Share (%), by Application 2024 & 2032
- Figure 75: Middle East MPE Industry Revenue (Million), by End-User Industry 2024 & 2032
- Figure 76: Middle East MPE Industry Volume (Billion), by End-User Industry 2024 & 2032
- Figure 77: Middle East MPE Industry Revenue Share (%), by End-User Industry 2024 & 2032
- Figure 78: Middle East MPE Industry Volume Share (%), by End-User Industry 2024 & 2032
- Figure 79: Middle East MPE Industry Revenue (Million), by Country 2024 & 2032
- Figure 80: Middle East MPE Industry Volume (Billion), by Country 2024 & 2032
- Figure 81: Middle East MPE Industry Revenue Share (%), by Country 2024 & 2032
- Figure 82: Middle East MPE Industry Volume Share (%), by Country 2024 & 2032
- Figure 83: Saudi Arabia MPE Industry Revenue (Million), by Type 2024 & 2032
- Figure 84: Saudi Arabia MPE Industry Volume (Billion), by Type 2024 & 2032
- Figure 85: Saudi Arabia MPE Industry Revenue Share (%), by Type 2024 & 2032
- Figure 86: Saudi Arabia MPE Industry Volume Share (%), by Type 2024 & 2032
- Figure 87: Saudi Arabia MPE Industry Revenue (Million), by Application 2024 & 2032
- Figure 88: Saudi Arabia MPE Industry Volume (Billion), by Application 2024 & 2032
- Figure 89: Saudi Arabia MPE Industry Revenue Share (%), by Application 2024 & 2032
- Figure 90: Saudi Arabia MPE Industry Volume Share (%), by Application 2024 & 2032
- Figure 91: Saudi Arabia MPE Industry Revenue (Million), by End-User Industry 2024 & 2032
- Figure 92: Saudi Arabia MPE Industry Volume (Billion), by End-User Industry 2024 & 2032
- Figure 93: Saudi Arabia MPE Industry Revenue Share (%), by End-User Industry 2024 & 2032
- Figure 94: Saudi Arabia MPE Industry Volume Share (%), by End-User Industry 2024 & 2032
- Figure 95: Saudi Arabia MPE Industry Revenue (Million), by Country 2024 & 2032
- Figure 96: Saudi Arabia MPE Industry Volume (Billion), by Country 2024 & 2032
- Figure 97: Saudi Arabia MPE Industry Revenue Share (%), by Country 2024 & 2032
- Figure 98: Saudi Arabia MPE Industry Volume Share (%), by Country 2024 & 2032
List of Tables
- Table 1: Global MPE Industry Revenue Million Forecast, by Region 2019 & 2032
- Table 2: Global MPE Industry Volume Billion Forecast, by Region 2019 & 2032
- Table 3: Global MPE Industry Revenue Million Forecast, by Type 2019 & 2032
- Table 4: Global MPE Industry Volume Billion Forecast, by Type 2019 & 2032
- Table 5: Global MPE Industry Revenue Million Forecast, by Application 2019 & 2032
- Table 6: Global MPE Industry Volume Billion Forecast, by Application 2019 & 2032
- Table 7: Global MPE Industry Revenue Million Forecast, by End-User Industry 2019 & 2032
- Table 8: Global MPE Industry Volume Billion Forecast, by End-User Industry 2019 & 2032
- Table 9: Global MPE Industry Revenue Million Forecast, by Region 2019 & 2032
- Table 10: Global MPE Industry Volume Billion Forecast, by Region 2019 & 2032
- Table 11: Global MPE Industry Revenue Million Forecast, by Type 2019 & 2032
- Table 12: Global MPE Industry Volume Billion Forecast, by Type 2019 & 2032
- Table 13: Global MPE Industry Revenue Million Forecast, by Application 2019 & 2032
- Table 14: Global MPE Industry Volume Billion Forecast, by Application 2019 & 2032
- Table 15: Global MPE Industry Revenue Million Forecast, by End-User Industry 2019 & 2032
- Table 16: Global MPE Industry Volume Billion Forecast, by End-User Industry 2019 & 2032
- Table 17: Global MPE Industry Revenue Million Forecast, by Country 2019 & 2032
- Table 18: Global MPE Industry Volume Billion Forecast, by Country 2019 & 2032
- Table 19: China MPE Industry Revenue (Million) Forecast, by Application 2019 & 2032
- Table 20: China MPE Industry Volume (Billion) Forecast, by Application 2019 & 2032
- Table 21: India MPE Industry Revenue (Million) Forecast, by Application 2019 & 2032
- Table 22: India MPE Industry Volume (Billion) Forecast, by Application 2019 & 2032
- Table 23: Japan MPE Industry Revenue (Million) Forecast, by Application 2019 & 2032
- Table 24: Japan MPE Industry Volume (Billion) Forecast, by Application 2019 & 2032
- Table 25: South Korea MPE Industry Revenue (Million) Forecast, by Application 2019 & 2032
- Table 26: South Korea MPE Industry Volume (Billion) Forecast, by Application 2019 & 2032
- Table 27: Rest of Asia Pacific MPE Industry Revenue (Million) Forecast, by Application 2019 & 2032
- Table 28: Rest of Asia Pacific MPE Industry Volume (Billion) Forecast, by Application 2019 & 2032
- Table 29: Global MPE Industry Revenue Million Forecast, by Type 2019 & 2032
- Table 30: Global MPE Industry Volume Billion Forecast, by Type 2019 & 2032
- Table 31: Global MPE Industry Revenue Million Forecast, by Application 2019 & 2032
- Table 32: Global MPE Industry Volume Billion Forecast, by Application 2019 & 2032
- Table 33: Global MPE Industry Revenue Million Forecast, by End-User Industry 2019 & 2032
- Table 34: Global MPE Industry Volume Billion Forecast, by End-User Industry 2019 & 2032
- Table 35: Global MPE Industry Revenue Million Forecast, by Country 2019 & 2032
- Table 36: Global MPE Industry Volume Billion Forecast, by Country 2019 & 2032
- Table 37: United States MPE Industry Revenue (Million) Forecast, by Application 2019 & 2032
- Table 38: United States MPE Industry Volume (Billion) Forecast, by Application 2019 & 2032
- Table 39: Canada MPE Industry Revenue (Million) Forecast, by Application 2019 & 2032
- Table 40: Canada MPE Industry Volume (Billion) Forecast, by Application 2019 & 2032
- Table 41: Mexico MPE Industry Revenue (Million) Forecast, by Application 2019 & 2032
- Table 42: Mexico MPE Industry Volume (Billion) Forecast, by Application 2019 & 2032
- Table 43: Global MPE Industry Revenue Million Forecast, by Type 2019 & 2032
- Table 44: Global MPE Industry Volume Billion Forecast, by Type 2019 & 2032
- Table 45: Global MPE Industry Revenue Million Forecast, by Application 2019 & 2032
- Table 46: Global MPE Industry Volume Billion Forecast, by Application 2019 & 2032
- Table 47: Global MPE Industry Revenue Million Forecast, by End-User Industry 2019 & 2032
- Table 48: Global MPE Industry Volume Billion Forecast, by End-User Industry 2019 & 2032
- Table 49: Global MPE Industry Revenue Million Forecast, by Country 2019 & 2032
- Table 50: Global MPE Industry Volume Billion Forecast, by Country 2019 & 2032
- Table 51: Germany MPE Industry Revenue (Million) Forecast, by Application 2019 & 2032
- Table 52: Germany MPE Industry Volume (Billion) Forecast, by Application 2019 & 2032
- Table 53: United Kingdom MPE Industry Revenue (Million) Forecast, by Application 2019 & 2032
- Table 54: United Kingdom MPE Industry Volume (Billion) Forecast, by Application 2019 & 2032
- Table 55: Italy MPE Industry Revenue (Million) Forecast, by Application 2019 & 2032
- Table 56: Italy MPE Industry Volume (Billion) Forecast, by Application 2019 & 2032
- Table 57: France MPE Industry Revenue (Million) Forecast, by Application 2019 & 2032
- Table 58: France MPE Industry Volume (Billion) Forecast, by Application 2019 & 2032
- Table 59: Rest of Europe MPE Industry Revenue (Million) Forecast, by Application 2019 & 2032
- Table 60: Rest of Europe MPE Industry Volume (Billion) Forecast, by Application 2019 & 2032
- Table 61: Global MPE Industry Revenue Million Forecast, by Type 2019 & 2032
- Table 62: Global MPE Industry Volume Billion Forecast, by Type 2019 & 2032
- Table 63: Global MPE Industry Revenue Million Forecast, by Application 2019 & 2032
- Table 64: Global MPE Industry Volume Billion Forecast, by Application 2019 & 2032
- Table 65: Global MPE Industry Revenue Million Forecast, by End-User Industry 2019 & 2032
- Table 66: Global MPE Industry Volume Billion Forecast, by End-User Industry 2019 & 2032
- Table 67: Global MPE Industry Revenue Million Forecast, by Country 2019 & 2032
- Table 68: Global MPE Industry Volume Billion Forecast, by Country 2019 & 2032
- Table 69: Brazil MPE Industry Revenue (Million) Forecast, by Application 2019 & 2032
- Table 70: Brazil MPE Industry Volume (Billion) Forecast, by Application 2019 & 2032
- Table 71: Argentina MPE Industry Revenue (Million) Forecast, by Application 2019 & 2032
- Table 72: Argentina MPE Industry Volume (Billion) Forecast, by Application 2019 & 2032
- Table 73: Rest of South America MPE Industry Revenue (Million) Forecast, by Application 2019 & 2032
- Table 74: Rest of South America MPE Industry Volume (Billion) Forecast, by Application 2019 & 2032
- Table 75: Global MPE Industry Revenue Million Forecast, by Type 2019 & 2032
- Table 76: Global MPE Industry Volume Billion Forecast, by Type 2019 & 2032
- Table 77: Global MPE Industry Revenue Million Forecast, by Application 2019 & 2032
- Table 78: Global MPE Industry Volume Billion Forecast, by Application 2019 & 2032
- Table 79: Global MPE Industry Revenue Million Forecast, by End-User Industry 2019 & 2032
- Table 80: Global MPE Industry Volume Billion Forecast, by End-User Industry 2019 & 2032
- Table 81: Global MPE Industry Revenue Million Forecast, by Country 2019 & 2032
- Table 82: Global MPE Industry Volume Billion Forecast, by Country 2019 & 2032
- Table 83: Global MPE Industry Revenue Million Forecast, by Type 2019 & 2032
- Table 84: Global MPE Industry Volume Billion Forecast, by Type 2019 & 2032
- Table 85: Global MPE Industry Revenue Million Forecast, by Application 2019 & 2032
- Table 86: Global MPE Industry Volume Billion Forecast, by Application 2019 & 2032
- Table 87: Global MPE Industry Revenue Million Forecast, by End-User Industry 2019 & 2032
- Table 88: Global MPE Industry Volume Billion Forecast, by End-User Industry 2019 & 2032
- Table 89: Global MPE Industry Revenue Million Forecast, by Country 2019 & 2032
- Table 90: Global MPE Industry Volume Billion Forecast, by Country 2019 & 2032
- Table 91: South Africa MPE Industry Revenue (Million) Forecast, by Application 2019 & 2032
- Table 92: South Africa MPE Industry Volume (Billion) Forecast, by Application 2019 & 2032
- Table 93: Rest of Middle East MPE Industry Revenue (Million) Forecast, by Application 2019 & 2032
- Table 94: Rest of Middle East MPE Industry Volume (Billion) Forecast, by Application 2019 & 2032
Frequently Asked Questions
1. What is the projected Compound Annual Growth Rate (CAGR) of the MPE Industry?
The projected CAGR is approximately 4.63%.
2. Which companies are prominent players in the MPE Industry?
Key companies in the market include Braskem, Brentwood Plastics Inc, Chevron Phillips Chemical Company LLC, INEOS, Mitsui Chemicals Inc, Prime Polymer Co Ltd, SABIC, TotalEnergies, Univation Technologies LLC, W R Grace & Co -Conn*List Not Exhaustive.
3. What are the main segments of the MPE Industry?
The market segments include Type, Application, End-User Industry.
4. Can you provide details about the market size?
The market size is estimated to be USD 21.82 Million as of 2022.
5. What are some drivers contributing to market growth?
Growing Demand for mPE from Various End User Industries; Surge in Adoption of Films and Sheets in Packaging Industry; Other Drivers.
6. What are the notable trends driving market growth?
Increasing Demand for mPE from Packaging Industry.
7. Are there any restraints impacting market growth?
Growing Demand for mPE from Various End User Industries; Surge in Adoption of Films and Sheets in Packaging Industry; Other Drivers.
8. Can you provide examples of recent developments in the market?
August 2022: SABIC SK Nexlene Company (SSNC), a joint venture of SABIC and SK Geo Centric, announced plans to expand the capacity of its Ulsan plant to produce mPE to address the growing demand from applications in solar panels, vehicles, footwear, and flexible packaging.
9. What pricing options are available for accessing the report?
Pricing options include single-user, multi-user, and enterprise licenses priced at USD 4750, USD 5250, and USD 8750 respectively.
10. Is the market size provided in terms of value or volume?
The market size is provided in terms of value, measured in Million and volume, measured in Billion.
11. Are there any specific market keywords associated with the report?
Yes, the market keyword associated with the report is "MPE Industry," which aids in identifying and referencing the specific market segment covered.
12. How do I determine which pricing option suits my needs best?
The pricing options vary based on user requirements and access needs. Individual users may opt for single-user licenses, while businesses requiring broader access may choose multi-user or enterprise licenses for cost-effective access to the report.
13. Are there any additional resources or data provided in the MPE Industry report?
While the report offers comprehensive insights, it's advisable to review the specific contents or supplementary materials provided to ascertain if additional resources or data are available.
14. How can I stay updated on further developments or reports in the MPE Industry?
To stay informed about further developments, trends, and reports in the MPE Industry, consider subscribing to industry newsletters, following relevant companies and organizations, or regularly checking reputable industry news sources and publications.
Methodology
Step 1 - Identification of Relevant Samples Size from Population Database


Step 2 - Approaches for Defining Global Market Size (Value, Volume* & Price*)

Note*: In applicable scenarios
Step 3 - Data Sources
Primary Research
- Web Analytics
- Survey Reports
- Research Institute
- Latest Research Reports
- Opinion Leaders
Secondary Research
- Annual Reports
- White Paper
- Latest Press Release
- Industry Association
- Paid Database
- Investor Presentations

Step 4 - Data Triangulation
Involves using different sources of information in order to increase the validity of a study
These sources are likely to be stakeholders in a program - participants, other researchers, program staff, other community members, and so on.
Then we put all data in single framework & apply various statistical tools to find out the dynamic on the market.
During the analysis stage, feedback from the stakeholder groups would be compared to determine areas of agreement as well as areas of divergence


