
Key Insights
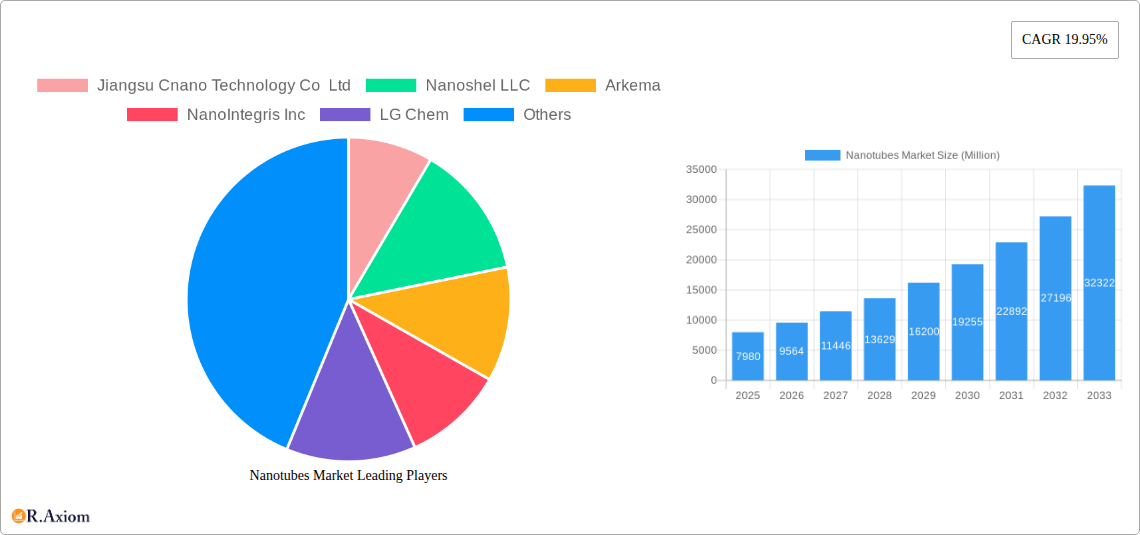
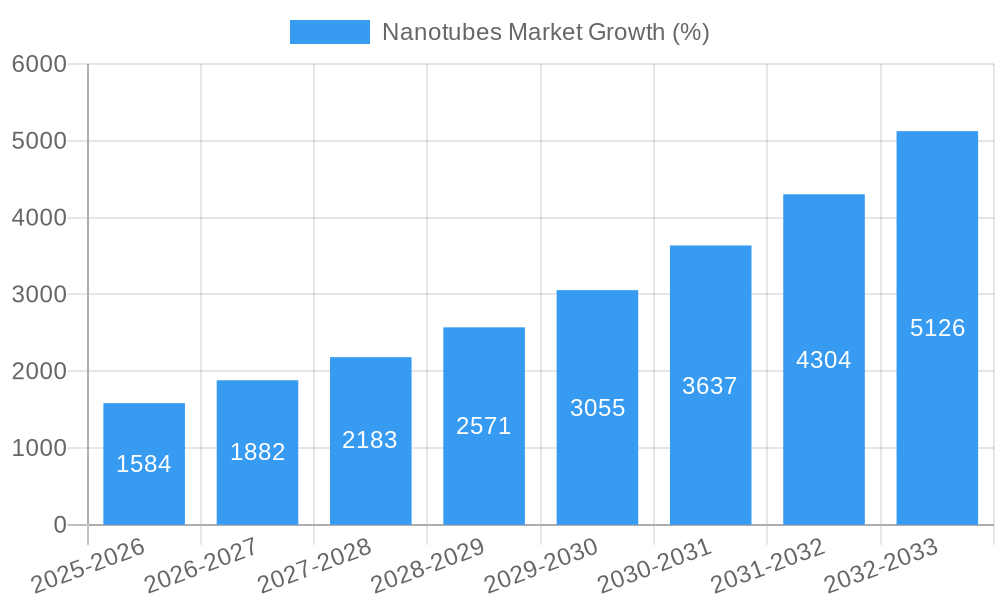
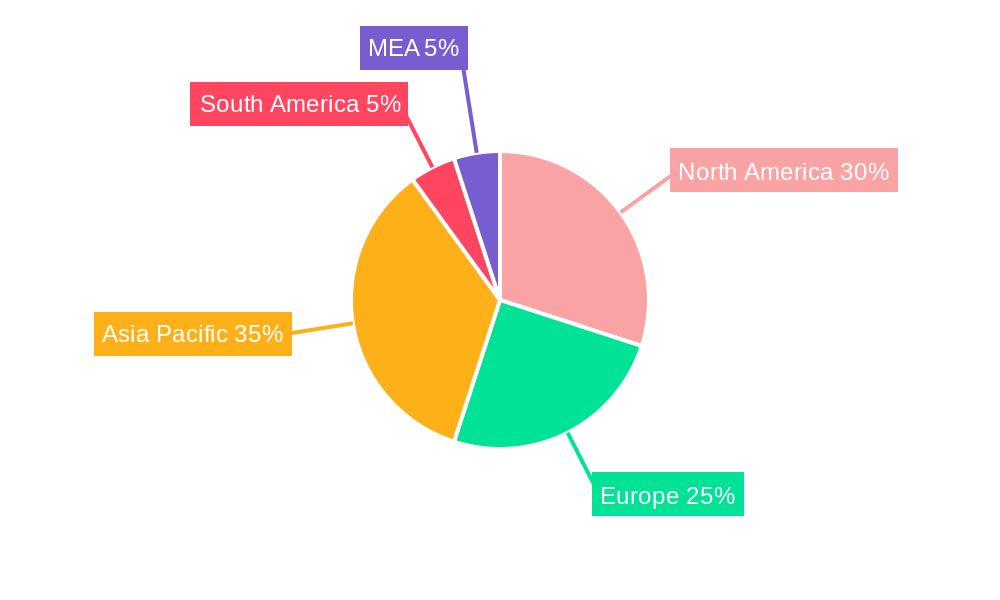
The global nanotubes market, valued at $7.98 billion in 2025, is projected to experience robust growth, driven by a compound annual growth rate (CAGR) of 19.95% from 2025 to 2033. This expansion is fueled by the increasing adoption of nanotubes across diverse sectors, primarily driven by their exceptional electrical conductivity, high strength-to-weight ratio, and unique thermal properties. Key application areas include energy storage (particularly Li-ion batteries and hydrogen storage devices), electronics (semiconductor devices and conductive plastics), and healthcare (biosensors and polymeric biomaterials). The rising demand for lightweight and high-performance materials in the automotive and aerospace industries further contributes to market growth. Significant advancements in synthesis techniques and the decreasing production costs of nanotubes are also expected to accelerate market penetration. Competition among major players like Jiangsu Cnano Technology Co Ltd, Nanoshel LLC, and Arkema, is fostering innovation and driving the availability of high-quality nanotubes at competitive prices. Segment-wise, carbon nanotubes currently dominate the market due to their widespread applications and established manufacturing processes; however, other types, including silicon and inorganic nanotubes, are gaining traction, driven by research and development efforts focusing on specialized applications. The Asia-Pacific region, particularly China, is expected to remain a key growth driver, owing to its substantial manufacturing base and increasing investments in nanotechnology research.
While the market enjoys considerable growth potential, certain restraints exist. Challenges related to scalability and cost-effectiveness of nanotube production, especially for less prevalent types, remain significant. Furthermore, concerns regarding the potential environmental and health impacts of nanotubes necessitate careful regulation and responsible manufacturing practices. Overcoming these hurdles through collaborative efforts between research institutions, manufacturers, and regulatory bodies will be crucial in unlocking the full potential of the nanotubes market. Despite these challenges, the overall market outlook remains optimistic, with significant growth expected throughout the forecast period. The diverse applications and unique properties of nanotubes make them an attractive material for numerous industries, promising substantial economic and technological advancements in the years to come.
Nanotubes Market: A Comprehensive Analysis (2019-2033)
This detailed report provides a comprehensive analysis of the Nanotubes Market, encompassing market size, segmentation, growth drivers, challenges, and key players. The study period covers 2019-2033, with 2025 as the base and estimated year. The report offers actionable insights for industry stakeholders, investors, and businesses seeking to navigate this dynamic market. Key segments analyzed include carbon nanotubes, silicon nanotubes, inorganic nanotubes, and various applications across diverse end-user industries.
Nanotubes Market Concentration & Innovation
The Nanotubes market exhibits a moderately concentrated landscape, with several key players holding significant market share. However, the market is also characterized by ongoing innovation and the emergence of new players, leading to a dynamic competitive environment. Market share data for 2024 reveals that the top five players collectively hold approximately xx% of the global market, with Jiangsu Cnano Technology Co Ltd, LG Chem, and Resonac Holdings Corporation among the leading companies. The average M&A deal value in the last five years has been approximately $xx Million.
Innovation is driven by advancements in materials science, nanotechnology, and manufacturing processes. The development of high-performance nanotubes with enhanced properties (strength, conductivity, etc.) is a key driver. Regulatory frameworks regarding the safe handling and application of nanotubes are evolving, impacting market growth and adoption. Product substitutes, such as graphene and other advanced materials, present competitive pressures. End-user trends, particularly in the electronics and energy sectors, significantly influence market demand. The increasing adoption of electric vehicles and renewable energy technologies is fueling demand for high-performance nanotubes in Li-ion batteries and energy storage devices.
- Market Concentration: Top 5 players hold approximately xx% market share in 2024.
- M&A Activity: Average deal value ~$xx Million in the past 5 years.
- Key Innovation Drivers: Advanced materials science, nanotechnology, and improved manufacturing processes.
- Regulatory Landscape: Evolving regulations influence market growth and adoption.
- Substitute Products: Graphene and other advanced materials pose competitive pressure.
- End-User Trends: Growing demand from electronics and energy sectors.
Nanotubes Market Industry Trends & Insights
The Nanotubes market is experiencing robust growth, driven by rising demand across diverse applications. The Compound Annual Growth Rate (CAGR) during the forecast period (2025-2033) is projected to be xx%. Technological disruptions, particularly in energy storage, electronics, and healthcare, are significantly influencing market expansion. Consumer preferences for sustainable and high-performance products are driving innovation and adoption of nanotubes in various applications. Competitive dynamics are shaped by factors such as pricing strategies, technological advancements, and strategic partnerships. Market penetration is increasing steadily across various end-user industries, with electronics and energy sectors leading the way. The market is expected to surpass $xx Million by 2033. The increasing demand for lightweight and high-strength materials in the automotive and aerospace sectors is also driving market growth.
Dominant Markets & Segments in Nanotubes Market
The Asia-Pacific region dominates the global nanotubes market, driven by robust economic growth, expanding industrial infrastructure, and substantial government support for nanotechnology research and development. China and Japan are particularly prominent within this region.
- Leading Region: Asia-Pacific.
- Key Drivers in Asia-Pacific: Rapid economic growth, supportive government policies, and expanding industrial infrastructure.
Dominant Segments:
- Type: Carbon nanotubes are the dominant segment due to their superior properties and wider range of applications. Silicon nanotubes and other types are also witnessing growth, although at a slower pace.
- Structure Type: Non-polymer organic nanomaterials hold a significant share due to their established applications in various industries. Polymeric nanomaterials are also gaining traction.
- Application: Li-ion batteries and conductive plastics are prominent application areas, driven by the growing demand for electric vehicles and electronics. Hydrogen storage devices and sensors are emerging applications.
- End-user Industry: The electronics industry is the leading end-user, followed by the energy and healthcare sectors. Automotive and aerospace industries are emerging as significant end-users.
The dominance of each segment is based on factors like established applications, technological advancements, material properties, and end-user demand.
Nanotubes Market Product Developments
Recent product innovations focus on improving nanotube properties (strength, conductivity, dispersibility) and expanding applications. Companies are developing customized nanotube solutions tailored to specific end-user needs, leading to a competitive edge. Technological advancements are centered around enhancing the scalability and cost-effectiveness of nanotube manufacturing processes. The improved market fit of specialized nanotubes, such as those with enhanced dispersion or functionalization, is driving their adoption in high-value applications.
Report Scope & Segmentation Analysis
This report segments the Nanotubes Market based on Type (Carbon Nanotubes, Silicon Nanotubes, Inorganic Nanotubes, Other Types), Structure Type (Non-polymer Organic Nanomaterials, Polymeric Nanomaterials), Application (Hydrogen Storage Devices, Sensors, Polymeric Biomaterials, Li-ion Batteries, Luminescent Display Devices, Biosensors, Nanoelectrodes, Water Purification Filters, Semiconductor Devices, Conductive Plastics), and End-user Industry (Healthcare, Electronics, Energy, Automotive, Aerospace and Defense, Textile, Other End-user Industries). Each segment's growth projection, market size, and competitive dynamics are analyzed in detail. Carbon nanotubes dominate the type segment, while Li-ion batteries are a leading application. The electronics sector remains a major end-user.
Key Drivers of Nanotubes Market Growth
Technological advancements leading to enhanced nanotube properties (strength, conductivity, etc.) are a major driver. Government initiatives promoting nanotechnology research and development further fuel market growth. The increasing demand for high-performance materials in various industries, coupled with supportive economic policies, provides further impetus for growth. For example, the rise of electric vehicles has boosted demand for nanotubes in Li-ion batteries.
Challenges in the Nanotubes Market Sector
High production costs and scalability challenges hinder widespread adoption. Supply chain issues related to raw materials and manufacturing processes also pose constraints. The need for efficient dispersion and functionalization of nanotubes presents another challenge. Competitive pressures from substitute materials and the need to address environmental and safety concerns represent further hurdles.
Emerging Opportunities in Nanotubes Market
Emerging applications in areas such as flexible electronics, wearable technology, and advanced biomedical devices present significant growth opportunities. The development of new functionalization methods to enhance nanotube properties for specific applications creates new market avenues. Growing demand for lightweight and high-strength materials in the aerospace and automotive sectors also offers considerable potential.
Leading Players in the Nanotubes Market Market
- Jiangsu Cnano Technology Co Ltd
- Nanoshel LLC
- Arkema
- NanoIntegris Inc
- LG Chem
- Cheap Tubes
- Carbon Solutions Inc
- Hyperion Catalysis International
- Resonac Holdings Corporation
- Nano-C
- Thomas Swan & Co Ltd
- Nanocyl SA (Birla Carbon)
Key Developments in Nanotubes Market Industry
- October 2023: Birla Carbon (Aditya Birla Group) acquired Nanocyl SA, strengthening its position in battery materials for lithium-ion batteries. This significantly enhances its nanotubes business segment.
- May 2023: LG Chem started construction of its fourth carbon nanotube (CNT) plant, set to double its annual CNT production to 6,100 tons by 2025. This expansion signifies the substantial growth expected in the CNT market.
Strategic Outlook for Nanotubes Market Market
The Nanotubes market holds significant future potential, driven by continuous technological advancements, expanding applications, and increasing demand across diverse end-user industries. Strategic partnerships, collaborations, and investments in research and development will further propel market growth. Focusing on improving cost-effectiveness, scalability, and addressing environmental concerns are vital for long-term success in this dynamic market.
Nanotubes Market Segmentation
-
1. Type
- 1.1. Carbon Nanotubes
- 1.2. Silicon Nanotubes
- 1.3. Inorganic Nanotubes
- 1.4. Other Types (Membrane Nanotubes, Etc.)
-
2. Structure Type
- 2.1. Non-polymer Organic Nanomaterials
- 2.2. Polymeric Nanomaterials
-
3. Application
- 3.1. Hydrogen Storage Devices
- 3.2. Sensors
- 3.3. Polymeric Biomaterials
- 3.4. Li-ion Batteries
- 3.5. Luminescent Display Devices
- 3.6. Biosensors
- 3.7. Nanoelectrodes
- 3.8. Water Purification Filters
- 3.9. Semiconductor Devices
- 3.10. Conductive Plastics
-
4. End-user Industry
- 4.1. Healthcare
- 4.2. Electronics
- 4.3. Energy
- 4.4. Automotive
- 4.5. Aerospace and Defense
- 4.6. Textile
- 4.7. Other En
Nanotubes Market Segmentation By Geography
-
1. Asia Pacific
- 1.1. China
- 1.2. India
- 1.3. Japan
- 1.4. South Korea
- 1.5. Rest of Asia Pacific
-
2. North America
- 2.1. United States
- 2.2. Canada
- 2.3. Mexico
-
3. Europe
- 3.1. Germany
- 3.2. United Kingdom
- 3.3. France
- 3.4. Italy
- 3.5. Rest of Europe
-
4. South America
- 4.1. Brazil
- 4.2. Argentina
- 4.3. Rest of South America
-
5. Middle East and Africa
- 5.1. Saudi Arabia
- 5.2. South Africa
- 5.3. Rest of Middle East and Africa
Nanotubes Market REPORT HIGHLIGHTS
| Aspects | Details |
|---|---|
| Study Period | 2019-2033 |
| Base Year | 2024 |
| Estimated Year | 2025 |
| Forecast Period | 2025-2033 |
| Historical Period | 2019-2024 |
| Growth Rate | CAGR of 19.95% from 2019-2033 |
| Segmentation |
|
Table of Contents
- 1. Introduction
- 1.1. Research Scope
- 1.2. Market Segmentation
- 1.3. Research Methodology
- 1.4. Definitions and Assumptions
- 2. Executive Summary
- 2.1. Introduction
- 3. Market Dynamics
- 3.1. Introduction
- 3.2. Market Drivers
- 3.2.1. Advancement in Nanotubes Technologies; Growing Adoption of Carbon Nanotubes; Other Drivers
- 3.3. Market Restrains
- 3.3.1. High Manufacturing and R&D Cost; Other Restraints
- 3.4. Market Trends
- 3.4.1. Electronics and Semiconductor Segment to Dominate the Market Demand
- 4. Market Factor Analysis
- 4.1. Porters Five Forces
- 4.2. Supply/Value Chain
- 4.3. PESTEL analysis
- 4.4. Market Entropy
- 4.5. Patent/Trademark Analysis
- 5. Global Nanotubes Market Analysis, Insights and Forecast, 2019-2031
- 5.1. Market Analysis, Insights and Forecast - by Type
- 5.1.1. Carbon Nanotubes
- 5.1.2. Silicon Nanotubes
- 5.1.3. Inorganic Nanotubes
- 5.1.4. Other Types (Membrane Nanotubes, Etc.)
- 5.2. Market Analysis, Insights and Forecast - by Structure Type
- 5.2.1. Non-polymer Organic Nanomaterials
- 5.2.2. Polymeric Nanomaterials
- 5.3. Market Analysis, Insights and Forecast - by Application
- 5.3.1. Hydrogen Storage Devices
- 5.3.2. Sensors
- 5.3.3. Polymeric Biomaterials
- 5.3.4. Li-ion Batteries
- 5.3.5. Luminescent Display Devices
- 5.3.6. Biosensors
- 5.3.7. Nanoelectrodes
- 5.3.8. Water Purification Filters
- 5.3.9. Semiconductor Devices
- 5.3.10. Conductive Plastics
- 5.4. Market Analysis, Insights and Forecast - by End-user Industry
- 5.4.1. Healthcare
- 5.4.2. Electronics
- 5.4.3. Energy
- 5.4.4. Automotive
- 5.4.5. Aerospace and Defense
- 5.4.6. Textile
- 5.4.7. Other En
- 5.5. Market Analysis, Insights and Forecast - by Region
- 5.5.1. Asia Pacific
- 5.5.2. North America
- 5.5.3. Europe
- 5.5.4. South America
- 5.5.5. Middle East and Africa
- 5.1. Market Analysis, Insights and Forecast - by Type
- 6. Asia Pacific Nanotubes Market Analysis, Insights and Forecast, 2019-2031
- 6.1. Market Analysis, Insights and Forecast - by Type
- 6.1.1. Carbon Nanotubes
- 6.1.2. Silicon Nanotubes
- 6.1.3. Inorganic Nanotubes
- 6.1.4. Other Types (Membrane Nanotubes, Etc.)
- 6.2. Market Analysis, Insights and Forecast - by Structure Type
- 6.2.1. Non-polymer Organic Nanomaterials
- 6.2.2. Polymeric Nanomaterials
- 6.3. Market Analysis, Insights and Forecast - by Application
- 6.3.1. Hydrogen Storage Devices
- 6.3.2. Sensors
- 6.3.3. Polymeric Biomaterials
- 6.3.4. Li-ion Batteries
- 6.3.5. Luminescent Display Devices
- 6.3.6. Biosensors
- 6.3.7. Nanoelectrodes
- 6.3.8. Water Purification Filters
- 6.3.9. Semiconductor Devices
- 6.3.10. Conductive Plastics
- 6.4. Market Analysis, Insights and Forecast - by End-user Industry
- 6.4.1. Healthcare
- 6.4.2. Electronics
- 6.4.3. Energy
- 6.4.4. Automotive
- 6.4.5. Aerospace and Defense
- 6.4.6. Textile
- 6.4.7. Other En
- 6.1. Market Analysis, Insights and Forecast - by Type
- 7. North America Nanotubes Market Analysis, Insights and Forecast, 2019-2031
- 7.1. Market Analysis, Insights and Forecast - by Type
- 7.1.1. Carbon Nanotubes
- 7.1.2. Silicon Nanotubes
- 7.1.3. Inorganic Nanotubes
- 7.1.4. Other Types (Membrane Nanotubes, Etc.)
- 7.2. Market Analysis, Insights and Forecast - by Structure Type
- 7.2.1. Non-polymer Organic Nanomaterials
- 7.2.2. Polymeric Nanomaterials
- 7.3. Market Analysis, Insights and Forecast - by Application
- 7.3.1. Hydrogen Storage Devices
- 7.3.2. Sensors
- 7.3.3. Polymeric Biomaterials
- 7.3.4. Li-ion Batteries
- 7.3.5. Luminescent Display Devices
- 7.3.6. Biosensors
- 7.3.7. Nanoelectrodes
- 7.3.8. Water Purification Filters
- 7.3.9. Semiconductor Devices
- 7.3.10. Conductive Plastics
- 7.4. Market Analysis, Insights and Forecast - by End-user Industry
- 7.4.1. Healthcare
- 7.4.2. Electronics
- 7.4.3. Energy
- 7.4.4. Automotive
- 7.4.5. Aerospace and Defense
- 7.4.6. Textile
- 7.4.7. Other En
- 7.1. Market Analysis, Insights and Forecast - by Type
- 8. Europe Nanotubes Market Analysis, Insights and Forecast, 2019-2031
- 8.1. Market Analysis, Insights and Forecast - by Type
- 8.1.1. Carbon Nanotubes
- 8.1.2. Silicon Nanotubes
- 8.1.3. Inorganic Nanotubes
- 8.1.4. Other Types (Membrane Nanotubes, Etc.)
- 8.2. Market Analysis, Insights and Forecast - by Structure Type
- 8.2.1. Non-polymer Organic Nanomaterials
- 8.2.2. Polymeric Nanomaterials
- 8.3. Market Analysis, Insights and Forecast - by Application
- 8.3.1. Hydrogen Storage Devices
- 8.3.2. Sensors
- 8.3.3. Polymeric Biomaterials
- 8.3.4. Li-ion Batteries
- 8.3.5. Luminescent Display Devices
- 8.3.6. Biosensors
- 8.3.7. Nanoelectrodes
- 8.3.8. Water Purification Filters
- 8.3.9. Semiconductor Devices
- 8.3.10. Conductive Plastics
- 8.4. Market Analysis, Insights and Forecast - by End-user Industry
- 8.4.1. Healthcare
- 8.4.2. Electronics
- 8.4.3. Energy
- 8.4.4. Automotive
- 8.4.5. Aerospace and Defense
- 8.4.6. Textile
- 8.4.7. Other En
- 8.1. Market Analysis, Insights and Forecast - by Type
- 9. South America Nanotubes Market Analysis, Insights and Forecast, 2019-2031
- 9.1. Market Analysis, Insights and Forecast - by Type
- 9.1.1. Carbon Nanotubes
- 9.1.2. Silicon Nanotubes
- 9.1.3. Inorganic Nanotubes
- 9.1.4. Other Types (Membrane Nanotubes, Etc.)
- 9.2. Market Analysis, Insights and Forecast - by Structure Type
- 9.2.1. Non-polymer Organic Nanomaterials
- 9.2.2. Polymeric Nanomaterials
- 9.3. Market Analysis, Insights and Forecast - by Application
- 9.3.1. Hydrogen Storage Devices
- 9.3.2. Sensors
- 9.3.3. Polymeric Biomaterials
- 9.3.4. Li-ion Batteries
- 9.3.5. Luminescent Display Devices
- 9.3.6. Biosensors
- 9.3.7. Nanoelectrodes
- 9.3.8. Water Purification Filters
- 9.3.9. Semiconductor Devices
- 9.3.10. Conductive Plastics
- 9.4. Market Analysis, Insights and Forecast - by End-user Industry
- 9.4.1. Healthcare
- 9.4.2. Electronics
- 9.4.3. Energy
- 9.4.4. Automotive
- 9.4.5. Aerospace and Defense
- 9.4.6. Textile
- 9.4.7. Other En
- 9.1. Market Analysis, Insights and Forecast - by Type
- 10. Middle East and Africa Nanotubes Market Analysis, Insights and Forecast, 2019-2031
- 10.1. Market Analysis, Insights and Forecast - by Type
- 10.1.1. Carbon Nanotubes
- 10.1.2. Silicon Nanotubes
- 10.1.3. Inorganic Nanotubes
- 10.1.4. Other Types (Membrane Nanotubes, Etc.)
- 10.2. Market Analysis, Insights and Forecast - by Structure Type
- 10.2.1. Non-polymer Organic Nanomaterials
- 10.2.2. Polymeric Nanomaterials
- 10.3. Market Analysis, Insights and Forecast - by Application
- 10.3.1. Hydrogen Storage Devices
- 10.3.2. Sensors
- 10.3.3. Polymeric Biomaterials
- 10.3.4. Li-ion Batteries
- 10.3.5. Luminescent Display Devices
- 10.3.6. Biosensors
- 10.3.7. Nanoelectrodes
- 10.3.8. Water Purification Filters
- 10.3.9. Semiconductor Devices
- 10.3.10. Conductive Plastics
- 10.4. Market Analysis, Insights and Forecast - by End-user Industry
- 10.4.1. Healthcare
- 10.4.2. Electronics
- 10.4.3. Energy
- 10.4.4. Automotive
- 10.4.5. Aerospace and Defense
- 10.4.6. Textile
- 10.4.7. Other En
- 10.1. Market Analysis, Insights and Forecast - by Type
- 11. North America Nanotubes Market Analysis, Insights and Forecast, 2019-2031
- 11.1. Market Analysis, Insights and Forecast - By Country/Sub-region
- 11.1.1 United States
- 11.1.2 Canada
- 11.1.3 Mexico
- 12. Europe Nanotubes Market Analysis, Insights and Forecast, 2019-2031
- 12.1. Market Analysis, Insights and Forecast - By Country/Sub-region
- 12.1.1 Germany
- 12.1.2 France
- 12.1.3 Italy
- 12.1.4 United Kingdom
- 12.1.5 Netherlands
- 12.1.6 Rest of Europe
- 13. Asia Pacific Nanotubes Market Analysis, Insights and Forecast, 2019-2031
- 13.1. Market Analysis, Insights and Forecast - By Country/Sub-region
- 13.1.1 China
- 13.1.2 Japan
- 13.1.3 India
- 13.1.4 South Korea
- 13.1.5 Taiwan
- 13.1.6 Australia
- 13.1.7 Rest of Asia-Pacific
- 14. South America Nanotubes Market Analysis, Insights and Forecast, 2019-2031
- 14.1. Market Analysis, Insights and Forecast - By Country/Sub-region
- 14.1.1 Brazil
- 14.1.2 Argentina
- 14.1.3 Rest of South America
- 15. MEA Nanotubes Market Analysis, Insights and Forecast, 2019-2031
- 15.1. Market Analysis, Insights and Forecast - By Country/Sub-region
- 15.1.1 Middle East
- 15.1.2 Africa
- 16. Competitive Analysis
- 16.1. Global Market Share Analysis 2024
- 16.2. Company Profiles
- 16.2.1 Jiangsu Cnano Technology Co Ltd
- 16.2.1.1. Overview
- 16.2.1.2. Products
- 16.2.1.3. SWOT Analysis
- 16.2.1.4. Recent Developments
- 16.2.1.5. Financials (Based on Availability)
- 16.2.2 Nanoshel LLC
- 16.2.2.1. Overview
- 16.2.2.2. Products
- 16.2.2.3. SWOT Analysis
- 16.2.2.4. Recent Developments
- 16.2.2.5. Financials (Based on Availability)
- 16.2.3 Arkema
- 16.2.3.1. Overview
- 16.2.3.2. Products
- 16.2.3.3. SWOT Analysis
- 16.2.3.4. Recent Developments
- 16.2.3.5. Financials (Based on Availability)
- 16.2.4 NanoIntegris Inc
- 16.2.4.1. Overview
- 16.2.4.2. Products
- 16.2.4.3. SWOT Analysis
- 16.2.4.4. Recent Developments
- 16.2.4.5. Financials (Based on Availability)
- 16.2.5 LG Chem
- 16.2.5.1. Overview
- 16.2.5.2. Products
- 16.2.5.3. SWOT Analysis
- 16.2.5.4. Recent Developments
- 16.2.5.5. Financials (Based on Availability)
- 16.2.6 Cheap Tubes
- 16.2.6.1. Overview
- 16.2.6.2. Products
- 16.2.6.3. SWOT Analysis
- 16.2.6.4. Recent Developments
- 16.2.6.5. Financials (Based on Availability)
- 16.2.7 Carbon Solutions Inc
- 16.2.7.1. Overview
- 16.2.7.2. Products
- 16.2.7.3. SWOT Analysis
- 16.2.7.4. Recent Developments
- 16.2.7.5. Financials (Based on Availability)
- 16.2.8 Hyperion Catalysis International
- 16.2.8.1. Overview
- 16.2.8.2. Products
- 16.2.8.3. SWOT Analysis
- 16.2.8.4. Recent Developments
- 16.2.8.5. Financials (Based on Availability)
- 16.2.9 Resonac Holdings Corporation
- 16.2.9.1. Overview
- 16.2.9.2. Products
- 16.2.9.3. SWOT Analysis
- 16.2.9.4. Recent Developments
- 16.2.9.5. Financials (Based on Availability)
- 16.2.10 Nano-C
- 16.2.10.1. Overview
- 16.2.10.2. Products
- 16.2.10.3. SWOT Analysis
- 16.2.10.4. Recent Developments
- 16.2.10.5. Financials (Based on Availability)
- 16.2.11 Thomas Swan & Co Ltd
- 16.2.11.1. Overview
- 16.2.11.2. Products
- 16.2.11.3. SWOT Analysis
- 16.2.11.4. Recent Developments
- 16.2.11.5. Financials (Based on Availability)
- 16.2.12 Nanocyl SA (Birla Carbon)
- 16.2.12.1. Overview
- 16.2.12.2. Products
- 16.2.12.3. SWOT Analysis
- 16.2.12.4. Recent Developments
- 16.2.12.5. Financials (Based on Availability)
- 16.2.1 Jiangsu Cnano Technology Co Ltd
List of Figures
- Figure 1: Global Nanotubes Market Revenue Breakdown (Million, %) by Region 2024 & 2032
- Figure 2: Global Nanotubes Market Volume Breakdown (K Tons, %) by Region 2024 & 2032
- Figure 3: North America Nanotubes Market Revenue (Million), by Country 2024 & 2032
- Figure 4: North America Nanotubes Market Volume (K Tons), by Country 2024 & 2032
- Figure 5: North America Nanotubes Market Revenue Share (%), by Country 2024 & 2032
- Figure 6: North America Nanotubes Market Volume Share (%), by Country 2024 & 2032
- Figure 7: Europe Nanotubes Market Revenue (Million), by Country 2024 & 2032
- Figure 8: Europe Nanotubes Market Volume (K Tons), by Country 2024 & 2032
- Figure 9: Europe Nanotubes Market Revenue Share (%), by Country 2024 & 2032
- Figure 10: Europe Nanotubes Market Volume Share (%), by Country 2024 & 2032
- Figure 11: Asia Pacific Nanotubes Market Revenue (Million), by Country 2024 & 2032
- Figure 12: Asia Pacific Nanotubes Market Volume (K Tons), by Country 2024 & 2032
- Figure 13: Asia Pacific Nanotubes Market Revenue Share (%), by Country 2024 & 2032
- Figure 14: Asia Pacific Nanotubes Market Volume Share (%), by Country 2024 & 2032
- Figure 15: South America Nanotubes Market Revenue (Million), by Country 2024 & 2032
- Figure 16: South America Nanotubes Market Volume (K Tons), by Country 2024 & 2032
- Figure 17: South America Nanotubes Market Revenue Share (%), by Country 2024 & 2032
- Figure 18: South America Nanotubes Market Volume Share (%), by Country 2024 & 2032
- Figure 19: MEA Nanotubes Market Revenue (Million), by Country 2024 & 2032
- Figure 20: MEA Nanotubes Market Volume (K Tons), by Country 2024 & 2032
- Figure 21: MEA Nanotubes Market Revenue Share (%), by Country 2024 & 2032
- Figure 22: MEA Nanotubes Market Volume Share (%), by Country 2024 & 2032
- Figure 23: Asia Pacific Nanotubes Market Revenue (Million), by Type 2024 & 2032
- Figure 24: Asia Pacific Nanotubes Market Volume (K Tons), by Type 2024 & 2032
- Figure 25: Asia Pacific Nanotubes Market Revenue Share (%), by Type 2024 & 2032
- Figure 26: Asia Pacific Nanotubes Market Volume Share (%), by Type 2024 & 2032
- Figure 27: Asia Pacific Nanotubes Market Revenue (Million), by Structure Type 2024 & 2032
- Figure 28: Asia Pacific Nanotubes Market Volume (K Tons), by Structure Type 2024 & 2032
- Figure 29: Asia Pacific Nanotubes Market Revenue Share (%), by Structure Type 2024 & 2032
- Figure 30: Asia Pacific Nanotubes Market Volume Share (%), by Structure Type 2024 & 2032
- Figure 31: Asia Pacific Nanotubes Market Revenue (Million), by Application 2024 & 2032
- Figure 32: Asia Pacific Nanotubes Market Volume (K Tons), by Application 2024 & 2032
- Figure 33: Asia Pacific Nanotubes Market Revenue Share (%), by Application 2024 & 2032
- Figure 34: Asia Pacific Nanotubes Market Volume Share (%), by Application 2024 & 2032
- Figure 35: Asia Pacific Nanotubes Market Revenue (Million), by End-user Industry 2024 & 2032
- Figure 36: Asia Pacific Nanotubes Market Volume (K Tons), by End-user Industry 2024 & 2032
- Figure 37: Asia Pacific Nanotubes Market Revenue Share (%), by End-user Industry 2024 & 2032
- Figure 38: Asia Pacific Nanotubes Market Volume Share (%), by End-user Industry 2024 & 2032
- Figure 39: Asia Pacific Nanotubes Market Revenue (Million), by Country 2024 & 2032
- Figure 40: Asia Pacific Nanotubes Market Volume (K Tons), by Country 2024 & 2032
- Figure 41: Asia Pacific Nanotubes Market Revenue Share (%), by Country 2024 & 2032
- Figure 42: Asia Pacific Nanotubes Market Volume Share (%), by Country 2024 & 2032
- Figure 43: North America Nanotubes Market Revenue (Million), by Type 2024 & 2032
- Figure 44: North America Nanotubes Market Volume (K Tons), by Type 2024 & 2032
- Figure 45: North America Nanotubes Market Revenue Share (%), by Type 2024 & 2032
- Figure 46: North America Nanotubes Market Volume Share (%), by Type 2024 & 2032
- Figure 47: North America Nanotubes Market Revenue (Million), by Structure Type 2024 & 2032
- Figure 48: North America Nanotubes Market Volume (K Tons), by Structure Type 2024 & 2032
- Figure 49: North America Nanotubes Market Revenue Share (%), by Structure Type 2024 & 2032
- Figure 50: North America Nanotubes Market Volume Share (%), by Structure Type 2024 & 2032
- Figure 51: North America Nanotubes Market Revenue (Million), by Application 2024 & 2032
- Figure 52: North America Nanotubes Market Volume (K Tons), by Application 2024 & 2032
- Figure 53: North America Nanotubes Market Revenue Share (%), by Application 2024 & 2032
- Figure 54: North America Nanotubes Market Volume Share (%), by Application 2024 & 2032
- Figure 55: North America Nanotubes Market Revenue (Million), by End-user Industry 2024 & 2032
- Figure 56: North America Nanotubes Market Volume (K Tons), by End-user Industry 2024 & 2032
- Figure 57: North America Nanotubes Market Revenue Share (%), by End-user Industry 2024 & 2032
- Figure 58: North America Nanotubes Market Volume Share (%), by End-user Industry 2024 & 2032
- Figure 59: North America Nanotubes Market Revenue (Million), by Country 2024 & 2032
- Figure 60: North America Nanotubes Market Volume (K Tons), by Country 2024 & 2032
- Figure 61: North America Nanotubes Market Revenue Share (%), by Country 2024 & 2032
- Figure 62: North America Nanotubes Market Volume Share (%), by Country 2024 & 2032
- Figure 63: Europe Nanotubes Market Revenue (Million), by Type 2024 & 2032
- Figure 64: Europe Nanotubes Market Volume (K Tons), by Type 2024 & 2032
- Figure 65: Europe Nanotubes Market Revenue Share (%), by Type 2024 & 2032
- Figure 66: Europe Nanotubes Market Volume Share (%), by Type 2024 & 2032
- Figure 67: Europe Nanotubes Market Revenue (Million), by Structure Type 2024 & 2032
- Figure 68: Europe Nanotubes Market Volume (K Tons), by Structure Type 2024 & 2032
- Figure 69: Europe Nanotubes Market Revenue Share (%), by Structure Type 2024 & 2032
- Figure 70: Europe Nanotubes Market Volume Share (%), by Structure Type 2024 & 2032
- Figure 71: Europe Nanotubes Market Revenue (Million), by Application 2024 & 2032
- Figure 72: Europe Nanotubes Market Volume (K Tons), by Application 2024 & 2032
- Figure 73: Europe Nanotubes Market Revenue Share (%), by Application 2024 & 2032
- Figure 74: Europe Nanotubes Market Volume Share (%), by Application 2024 & 2032
- Figure 75: Europe Nanotubes Market Revenue (Million), by End-user Industry 2024 & 2032
- Figure 76: Europe Nanotubes Market Volume (K Tons), by End-user Industry 2024 & 2032
- Figure 77: Europe Nanotubes Market Revenue Share (%), by End-user Industry 2024 & 2032
- Figure 78: Europe Nanotubes Market Volume Share (%), by End-user Industry 2024 & 2032
- Figure 79: Europe Nanotubes Market Revenue (Million), by Country 2024 & 2032
- Figure 80: Europe Nanotubes Market Volume (K Tons), by Country 2024 & 2032
- Figure 81: Europe Nanotubes Market Revenue Share (%), by Country 2024 & 2032
- Figure 82: Europe Nanotubes Market Volume Share (%), by Country 2024 & 2032
- Figure 83: South America Nanotubes Market Revenue (Million), by Type 2024 & 2032
- Figure 84: South America Nanotubes Market Volume (K Tons), by Type 2024 & 2032
- Figure 85: South America Nanotubes Market Revenue Share (%), by Type 2024 & 2032
- Figure 86: South America Nanotubes Market Volume Share (%), by Type 2024 & 2032
- Figure 87: South America Nanotubes Market Revenue (Million), by Structure Type 2024 & 2032
- Figure 88: South America Nanotubes Market Volume (K Tons), by Structure Type 2024 & 2032
- Figure 89: South America Nanotubes Market Revenue Share (%), by Structure Type 2024 & 2032
- Figure 90: South America Nanotubes Market Volume Share (%), by Structure Type 2024 & 2032
- Figure 91: South America Nanotubes Market Revenue (Million), by Application 2024 & 2032
- Figure 92: South America Nanotubes Market Volume (K Tons), by Application 2024 & 2032
- Figure 93: South America Nanotubes Market Revenue Share (%), by Application 2024 & 2032
- Figure 94: South America Nanotubes Market Volume Share (%), by Application 2024 & 2032
- Figure 95: South America Nanotubes Market Revenue (Million), by End-user Industry 2024 & 2032
- Figure 96: South America Nanotubes Market Volume (K Tons), by End-user Industry 2024 & 2032
- Figure 97: South America Nanotubes Market Revenue Share (%), by End-user Industry 2024 & 2032
- Figure 98: South America Nanotubes Market Volume Share (%), by End-user Industry 2024 & 2032
- Figure 99: South America Nanotubes Market Revenue (Million), by Country 2024 & 2032
- Figure 100: South America Nanotubes Market Volume (K Tons), by Country 2024 & 2032
- Figure 101: South America Nanotubes Market Revenue Share (%), by Country 2024 & 2032
- Figure 102: South America Nanotubes Market Volume Share (%), by Country 2024 & 2032
- Figure 103: Middle East and Africa Nanotubes Market Revenue (Million), by Type 2024 & 2032
- Figure 104: Middle East and Africa Nanotubes Market Volume (K Tons), by Type 2024 & 2032
- Figure 105: Middle East and Africa Nanotubes Market Revenue Share (%), by Type 2024 & 2032
- Figure 106: Middle East and Africa Nanotubes Market Volume Share (%), by Type 2024 & 2032
- Figure 107: Middle East and Africa Nanotubes Market Revenue (Million), by Structure Type 2024 & 2032
- Figure 108: Middle East and Africa Nanotubes Market Volume (K Tons), by Structure Type 2024 & 2032
- Figure 109: Middle East and Africa Nanotubes Market Revenue Share (%), by Structure Type 2024 & 2032
- Figure 110: Middle East and Africa Nanotubes Market Volume Share (%), by Structure Type 2024 & 2032
- Figure 111: Middle East and Africa Nanotubes Market Revenue (Million), by Application 2024 & 2032
- Figure 112: Middle East and Africa Nanotubes Market Volume (K Tons), by Application 2024 & 2032
- Figure 113: Middle East and Africa Nanotubes Market Revenue Share (%), by Application 2024 & 2032
- Figure 114: Middle East and Africa Nanotubes Market Volume Share (%), by Application 2024 & 2032
- Figure 115: Middle East and Africa Nanotubes Market Revenue (Million), by End-user Industry 2024 & 2032
- Figure 116: Middle East and Africa Nanotubes Market Volume (K Tons), by End-user Industry 2024 & 2032
- Figure 117: Middle East and Africa Nanotubes Market Revenue Share (%), by End-user Industry 2024 & 2032
- Figure 118: Middle East and Africa Nanotubes Market Volume Share (%), by End-user Industry 2024 & 2032
- Figure 119: Middle East and Africa Nanotubes Market Revenue (Million), by Country 2024 & 2032
- Figure 120: Middle East and Africa Nanotubes Market Volume (K Tons), by Country 2024 & 2032
- Figure 121: Middle East and Africa Nanotubes Market Revenue Share (%), by Country 2024 & 2032
- Figure 122: Middle East and Africa Nanotubes Market Volume Share (%), by Country 2024 & 2032
List of Tables
- Table 1: Global Nanotubes Market Revenue Million Forecast, by Region 2019 & 2032
- Table 2: Global Nanotubes Market Volume K Tons Forecast, by Region 2019 & 2032
- Table 3: Global Nanotubes Market Revenue Million Forecast, by Type 2019 & 2032
- Table 4: Global Nanotubes Market Volume K Tons Forecast, by Type 2019 & 2032
- Table 5: Global Nanotubes Market Revenue Million Forecast, by Structure Type 2019 & 2032
- Table 6: Global Nanotubes Market Volume K Tons Forecast, by Structure Type 2019 & 2032
- Table 7: Global Nanotubes Market Revenue Million Forecast, by Application 2019 & 2032
- Table 8: Global Nanotubes Market Volume K Tons Forecast, by Application 2019 & 2032
- Table 9: Global Nanotubes Market Revenue Million Forecast, by End-user Industry 2019 & 2032
- Table 10: Global Nanotubes Market Volume K Tons Forecast, by End-user Industry 2019 & 2032
- Table 11: Global Nanotubes Market Revenue Million Forecast, by Region 2019 & 2032
- Table 12: Global Nanotubes Market Volume K Tons Forecast, by Region 2019 & 2032
- Table 13: Global Nanotubes Market Revenue Million Forecast, by Country 2019 & 2032
- Table 14: Global Nanotubes Market Volume K Tons Forecast, by Country 2019 & 2032
- Table 15: United States Nanotubes Market Revenue (Million) Forecast, by Application 2019 & 2032
- Table 16: United States Nanotubes Market Volume (K Tons) Forecast, by Application 2019 & 2032
- Table 17: Canada Nanotubes Market Revenue (Million) Forecast, by Application 2019 & 2032
- Table 18: Canada Nanotubes Market Volume (K Tons) Forecast, by Application 2019 & 2032
- Table 19: Mexico Nanotubes Market Revenue (Million) Forecast, by Application 2019 & 2032
- Table 20: Mexico Nanotubes Market Volume (K Tons) Forecast, by Application 2019 & 2032
- Table 21: Global Nanotubes Market Revenue Million Forecast, by Country 2019 & 2032
- Table 22: Global Nanotubes Market Volume K Tons Forecast, by Country 2019 & 2032
- Table 23: Germany Nanotubes Market Revenue (Million) Forecast, by Application 2019 & 2032
- Table 24: Germany Nanotubes Market Volume (K Tons) Forecast, by Application 2019 & 2032
- Table 25: France Nanotubes Market Revenue (Million) Forecast, by Application 2019 & 2032
- Table 26: France Nanotubes Market Volume (K Tons) Forecast, by Application 2019 & 2032
- Table 27: Italy Nanotubes Market Revenue (Million) Forecast, by Application 2019 & 2032
- Table 28: Italy Nanotubes Market Volume (K Tons) Forecast, by Application 2019 & 2032
- Table 29: United Kingdom Nanotubes Market Revenue (Million) Forecast, by Application 2019 & 2032
- Table 30: United Kingdom Nanotubes Market Volume (K Tons) Forecast, by Application 2019 & 2032
- Table 31: Netherlands Nanotubes Market Revenue (Million) Forecast, by Application 2019 & 2032
- Table 32: Netherlands Nanotubes Market Volume (K Tons) Forecast, by Application 2019 & 2032
- Table 33: Rest of Europe Nanotubes Market Revenue (Million) Forecast, by Application 2019 & 2032
- Table 34: Rest of Europe Nanotubes Market Volume (K Tons) Forecast, by Application 2019 & 2032
- Table 35: Global Nanotubes Market Revenue Million Forecast, by Country 2019 & 2032
- Table 36: Global Nanotubes Market Volume K Tons Forecast, by Country 2019 & 2032
- Table 37: China Nanotubes Market Revenue (Million) Forecast, by Application 2019 & 2032
- Table 38: China Nanotubes Market Volume (K Tons) Forecast, by Application 2019 & 2032
- Table 39: Japan Nanotubes Market Revenue (Million) Forecast, by Application 2019 & 2032
- Table 40: Japan Nanotubes Market Volume (K Tons) Forecast, by Application 2019 & 2032
- Table 41: India Nanotubes Market Revenue (Million) Forecast, by Application 2019 & 2032
- Table 42: India Nanotubes Market Volume (K Tons) Forecast, by Application 2019 & 2032
- Table 43: South Korea Nanotubes Market Revenue (Million) Forecast, by Application 2019 & 2032
- Table 44: South Korea Nanotubes Market Volume (K Tons) Forecast, by Application 2019 & 2032
- Table 45: Taiwan Nanotubes Market Revenue (Million) Forecast, by Application 2019 & 2032
- Table 46: Taiwan Nanotubes Market Volume (K Tons) Forecast, by Application 2019 & 2032
- Table 47: Australia Nanotubes Market Revenue (Million) Forecast, by Application 2019 & 2032
- Table 48: Australia Nanotubes Market Volume (K Tons) Forecast, by Application 2019 & 2032
- Table 49: Rest of Asia-Pacific Nanotubes Market Revenue (Million) Forecast, by Application 2019 & 2032
- Table 50: Rest of Asia-Pacific Nanotubes Market Volume (K Tons) Forecast, by Application 2019 & 2032
- Table 51: Global Nanotubes Market Revenue Million Forecast, by Country 2019 & 2032
- Table 52: Global Nanotubes Market Volume K Tons Forecast, by Country 2019 & 2032
- Table 53: Brazil Nanotubes Market Revenue (Million) Forecast, by Application 2019 & 2032
- Table 54: Brazil Nanotubes Market Volume (K Tons) Forecast, by Application 2019 & 2032
- Table 55: Argentina Nanotubes Market Revenue (Million) Forecast, by Application 2019 & 2032
- Table 56: Argentina Nanotubes Market Volume (K Tons) Forecast, by Application 2019 & 2032
- Table 57: Rest of South America Nanotubes Market Revenue (Million) Forecast, by Application 2019 & 2032
- Table 58: Rest of South America Nanotubes Market Volume (K Tons) Forecast, by Application 2019 & 2032
- Table 59: Global Nanotubes Market Revenue Million Forecast, by Country 2019 & 2032
- Table 60: Global Nanotubes Market Volume K Tons Forecast, by Country 2019 & 2032
- Table 61: Middle East Nanotubes Market Revenue (Million) Forecast, by Application 2019 & 2032
- Table 62: Middle East Nanotubes Market Volume (K Tons) Forecast, by Application 2019 & 2032
- Table 63: Africa Nanotubes Market Revenue (Million) Forecast, by Application 2019 & 2032
- Table 64: Africa Nanotubes Market Volume (K Tons) Forecast, by Application 2019 & 2032
- Table 65: Global Nanotubes Market Revenue Million Forecast, by Type 2019 & 2032
- Table 66: Global Nanotubes Market Volume K Tons Forecast, by Type 2019 & 2032
- Table 67: Global Nanotubes Market Revenue Million Forecast, by Structure Type 2019 & 2032
- Table 68: Global Nanotubes Market Volume K Tons Forecast, by Structure Type 2019 & 2032
- Table 69: Global Nanotubes Market Revenue Million Forecast, by Application 2019 & 2032
- Table 70: Global Nanotubes Market Volume K Tons Forecast, by Application 2019 & 2032
- Table 71: Global Nanotubes Market Revenue Million Forecast, by End-user Industry 2019 & 2032
- Table 72: Global Nanotubes Market Volume K Tons Forecast, by End-user Industry 2019 & 2032
- Table 73: Global Nanotubes Market Revenue Million Forecast, by Country 2019 & 2032
- Table 74: Global Nanotubes Market Volume K Tons Forecast, by Country 2019 & 2032
- Table 75: China Nanotubes Market Revenue (Million) Forecast, by Application 2019 & 2032
- Table 76: China Nanotubes Market Volume (K Tons) Forecast, by Application 2019 & 2032
- Table 77: India Nanotubes Market Revenue (Million) Forecast, by Application 2019 & 2032
- Table 78: India Nanotubes Market Volume (K Tons) Forecast, by Application 2019 & 2032
- Table 79: Japan Nanotubes Market Revenue (Million) Forecast, by Application 2019 & 2032
- Table 80: Japan Nanotubes Market Volume (K Tons) Forecast, by Application 2019 & 2032
- Table 81: South Korea Nanotubes Market Revenue (Million) Forecast, by Application 2019 & 2032
- Table 82: South Korea Nanotubes Market Volume (K Tons) Forecast, by Application 2019 & 2032
- Table 83: Rest of Asia Pacific Nanotubes Market Revenue (Million) Forecast, by Application 2019 & 2032
- Table 84: Rest of Asia Pacific Nanotubes Market Volume (K Tons) Forecast, by Application 2019 & 2032
- Table 85: Global Nanotubes Market Revenue Million Forecast, by Type 2019 & 2032
- Table 86: Global Nanotubes Market Volume K Tons Forecast, by Type 2019 & 2032
- Table 87: Global Nanotubes Market Revenue Million Forecast, by Structure Type 2019 & 2032
- Table 88: Global Nanotubes Market Volume K Tons Forecast, by Structure Type 2019 & 2032
- Table 89: Global Nanotubes Market Revenue Million Forecast, by Application 2019 & 2032
- Table 90: Global Nanotubes Market Volume K Tons Forecast, by Application 2019 & 2032
- Table 91: Global Nanotubes Market Revenue Million Forecast, by End-user Industry 2019 & 2032
- Table 92: Global Nanotubes Market Volume K Tons Forecast, by End-user Industry 2019 & 2032
- Table 93: Global Nanotubes Market Revenue Million Forecast, by Country 2019 & 2032
- Table 94: Global Nanotubes Market Volume K Tons Forecast, by Country 2019 & 2032
- Table 95: United States Nanotubes Market Revenue (Million) Forecast, by Application 2019 & 2032
- Table 96: United States Nanotubes Market Volume (K Tons) Forecast, by Application 2019 & 2032
- Table 97: Canada Nanotubes Market Revenue (Million) Forecast, by Application 2019 & 2032
- Table 98: Canada Nanotubes Market Volume (K Tons) Forecast, by Application 2019 & 2032
- Table 99: Mexico Nanotubes Market Revenue (Million) Forecast, by Application 2019 & 2032
- Table 100: Mexico Nanotubes Market Volume (K Tons) Forecast, by Application 2019 & 2032
- Table 101: Global Nanotubes Market Revenue Million Forecast, by Type 2019 & 2032
- Table 102: Global Nanotubes Market Volume K Tons Forecast, by Type 2019 & 2032
- Table 103: Global Nanotubes Market Revenue Million Forecast, by Structure Type 2019 & 2032
- Table 104: Global Nanotubes Market Volume K Tons Forecast, by Structure Type 2019 & 2032
- Table 105: Global Nanotubes Market Revenue Million Forecast, by Application 2019 & 2032
- Table 106: Global Nanotubes Market Volume K Tons Forecast, by Application 2019 & 2032
- Table 107: Global Nanotubes Market Revenue Million Forecast, by End-user Industry 2019 & 2032
- Table 108: Global Nanotubes Market Volume K Tons Forecast, by End-user Industry 2019 & 2032
- Table 109: Global Nanotubes Market Revenue Million Forecast, by Country 2019 & 2032
- Table 110: Global Nanotubes Market Volume K Tons Forecast, by Country 2019 & 2032
- Table 111: Germany Nanotubes Market Revenue (Million) Forecast, by Application 2019 & 2032
- Table 112: Germany Nanotubes Market Volume (K Tons) Forecast, by Application 2019 & 2032
- Table 113: United Kingdom Nanotubes Market Revenue (Million) Forecast, by Application 2019 & 2032
- Table 114: United Kingdom Nanotubes Market Volume (K Tons) Forecast, by Application 2019 & 2032
- Table 115: France Nanotubes Market Revenue (Million) Forecast, by Application 2019 & 2032
- Table 116: France Nanotubes Market Volume (K Tons) Forecast, by Application 2019 & 2032
- Table 117: Italy Nanotubes Market Revenue (Million) Forecast, by Application 2019 & 2032
- Table 118: Italy Nanotubes Market Volume (K Tons) Forecast, by Application 2019 & 2032
- Table 119: Rest of Europe Nanotubes Market Revenue (Million) Forecast, by Application 2019 & 2032
- Table 120: Rest of Europe Nanotubes Market Volume (K Tons) Forecast, by Application 2019 & 2032
- Table 121: Global Nanotubes Market Revenue Million Forecast, by Type 2019 & 2032
- Table 122: Global Nanotubes Market Volume K Tons Forecast, by Type 2019 & 2032
- Table 123: Global Nanotubes Market Revenue Million Forecast, by Structure Type 2019 & 2032
- Table 124: Global Nanotubes Market Volume K Tons Forecast, by Structure Type 2019 & 2032
- Table 125: Global Nanotubes Market Revenue Million Forecast, by Application 2019 & 2032
- Table 126: Global Nanotubes Market Volume K Tons Forecast, by Application 2019 & 2032
- Table 127: Global Nanotubes Market Revenue Million Forecast, by End-user Industry 2019 & 2032
- Table 128: Global Nanotubes Market Volume K Tons Forecast, by End-user Industry 2019 & 2032
- Table 129: Global Nanotubes Market Revenue Million Forecast, by Country 2019 & 2032
- Table 130: Global Nanotubes Market Volume K Tons Forecast, by Country 2019 & 2032
- Table 131: Brazil Nanotubes Market Revenue (Million) Forecast, by Application 2019 & 2032
- Table 132: Brazil Nanotubes Market Volume (K Tons) Forecast, by Application 2019 & 2032
- Table 133: Argentina Nanotubes Market Revenue (Million) Forecast, by Application 2019 & 2032
- Table 134: Argentina Nanotubes Market Volume (K Tons) Forecast, by Application 2019 & 2032
- Table 135: Rest of South America Nanotubes Market Revenue (Million) Forecast, by Application 2019 & 2032
- Table 136: Rest of South America Nanotubes Market Volume (K Tons) Forecast, by Application 2019 & 2032
- Table 137: Global Nanotubes Market Revenue Million Forecast, by Type 2019 & 2032
- Table 138: Global Nanotubes Market Volume K Tons Forecast, by Type 2019 & 2032
- Table 139: Global Nanotubes Market Revenue Million Forecast, by Structure Type 2019 & 2032
- Table 140: Global Nanotubes Market Volume K Tons Forecast, by Structure Type 2019 & 2032
- Table 141: Global Nanotubes Market Revenue Million Forecast, by Application 2019 & 2032
- Table 142: Global Nanotubes Market Volume K Tons Forecast, by Application 2019 & 2032
- Table 143: Global Nanotubes Market Revenue Million Forecast, by End-user Industry 2019 & 2032
- Table 144: Global Nanotubes Market Volume K Tons Forecast, by End-user Industry 2019 & 2032
- Table 145: Global Nanotubes Market Revenue Million Forecast, by Country 2019 & 2032
- Table 146: Global Nanotubes Market Volume K Tons Forecast, by Country 2019 & 2032
- Table 147: Saudi Arabia Nanotubes Market Revenue (Million) Forecast, by Application 2019 & 2032
- Table 148: Saudi Arabia Nanotubes Market Volume (K Tons) Forecast, by Application 2019 & 2032
- Table 149: South Africa Nanotubes Market Revenue (Million) Forecast, by Application 2019 & 2032
- Table 150: South Africa Nanotubes Market Volume (K Tons) Forecast, by Application 2019 & 2032
- Table 151: Rest of Middle East and Africa Nanotubes Market Revenue (Million) Forecast, by Application 2019 & 2032
- Table 152: Rest of Middle East and Africa Nanotubes Market Volume (K Tons) Forecast, by Application 2019 & 2032
Frequently Asked Questions
1. What is the projected Compound Annual Growth Rate (CAGR) of the Nanotubes Market?
The projected CAGR is approximately 19.95%.
2. Which companies are prominent players in the Nanotubes Market?
Key companies in the market include Jiangsu Cnano Technology Co Ltd, Nanoshel LLC, Arkema, NanoIntegris Inc, LG Chem, Cheap Tubes, Carbon Solutions Inc, Hyperion Catalysis International, Resonac Holdings Corporation, Nano-C, Thomas Swan & Co Ltd, Nanocyl SA (Birla Carbon).
3. What are the main segments of the Nanotubes Market?
The market segments include Type, Structure Type, Application, End-user Industry.
4. Can you provide details about the market size?
The market size is estimated to be USD 7.98 Million as of 2022.
5. What are some drivers contributing to market growth?
Advancement in Nanotubes Technologies; Growing Adoption of Carbon Nanotubes; Other Drivers.
6. What are the notable trends driving market growth?
Electronics and Semiconductor Segment to Dominate the Market Demand.
7. Are there any restraints impacting market growth?
High Manufacturing and R&D Cost; Other Restraints.
8. Can you provide examples of recent developments in the market?
October 2023: Birla Carbon (Aditya Birla Group) acquired Nanocyl SA to enhance its growth in battery materials for lithium-ion batteries, which will add value to its nanotubes business segment.
9. What pricing options are available for accessing the report?
Pricing options include single-user, multi-user, and enterprise licenses priced at USD 4750, USD 5250, and USD 8750 respectively.
10. Is the market size provided in terms of value or volume?
The market size is provided in terms of value, measured in Million and volume, measured in K Tons.
11. Are there any specific market keywords associated with the report?
Yes, the market keyword associated with the report is "Nanotubes Market," which aids in identifying and referencing the specific market segment covered.
12. How do I determine which pricing option suits my needs best?
The pricing options vary based on user requirements and access needs. Individual users may opt for single-user licenses, while businesses requiring broader access may choose multi-user or enterprise licenses for cost-effective access to the report.
13. Are there any additional resources or data provided in the Nanotubes Market report?
While the report offers comprehensive insights, it's advisable to review the specific contents or supplementary materials provided to ascertain if additional resources or data are available.
14. How can I stay updated on further developments or reports in the Nanotubes Market?
To stay informed about further developments, trends, and reports in the Nanotubes Market, consider subscribing to industry newsletters, following relevant companies and organizations, or regularly checking reputable industry news sources and publications.
Methodology
Step 1 - Identification of Relevant Samples Size from Population Database


Step 2 - Approaches for Defining Global Market Size (Value, Volume* & Price*)

Note*: In applicable scenarios
Step 3 - Data Sources
Primary Research
- Web Analytics
- Survey Reports
- Research Institute
- Latest Research Reports
- Opinion Leaders
Secondary Research
- Annual Reports
- White Paper
- Latest Press Release
- Industry Association
- Paid Database
- Investor Presentations

Step 4 - Data Triangulation
Involves using different sources of information in order to increase the validity of a study
These sources are likely to be stakeholders in a program - participants, other researchers, program staff, other community members, and so on.
Then we put all data in single framework & apply various statistical tools to find out the dynamic on the market.
During the analysis stage, feedback from the stakeholder groups would be compared to determine areas of agreement as well as areas of divergence


